
General Biology 2 Lab Manual
Open Educational Resource
Department of Biological Sciences
Dmitry Y. Brogun, Azure N. Faucette, Kristin Polizzotto, Farshad Tamari
This Open Educational Resource Laboratory Manual was funded in part by the OER Grant at the Kingsborough Community College - The City University of New York.
Content hosted at: Manifold CUNY | | https://cuny.manifoldapp.org/projects/general-biology-oer-laboratory-manual
CUNY Academic Commons | https://generalbiologyoer.commons.gc.cuny.edu/
This publication is licensed under Creative Commons Non-Commercial Share-Alike by Dmitry Y. Brogun, Azure N. Faucette, Kristin Polizzotto, Farshad Tamari
Department of Biological Sciences, Kingsborough Community College, CUNY. Farshad.Tamari@kbcc.cuny.edu , Dmitry.Brogun@kbcc.cuny.edu
Azure.Faucette@kbcc.cuny.edu, Kristin.Polizzotto@kbcc.cuny.edu

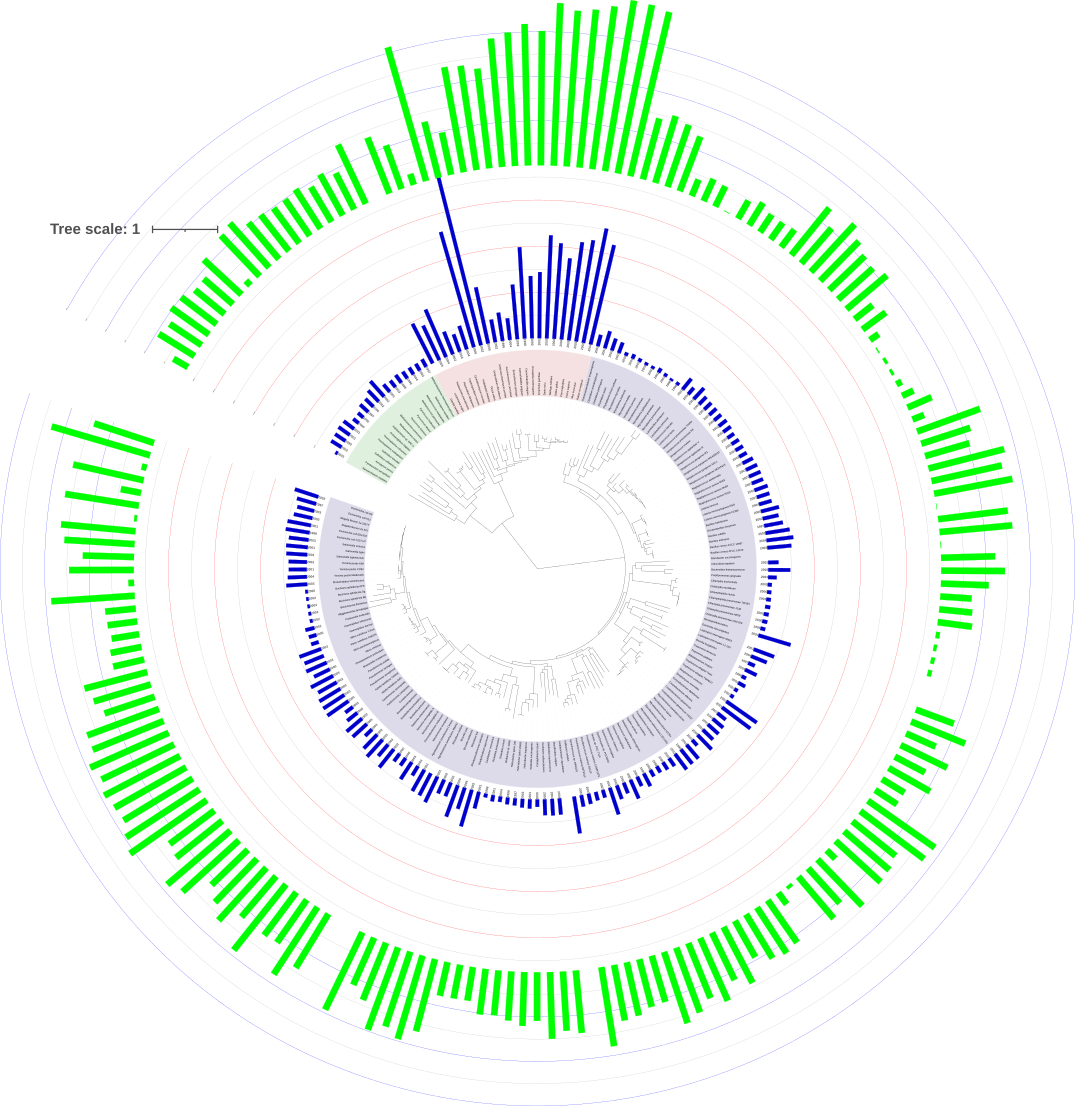
Cover Image: by Dmitry Y. Brogun (CC-BY-NC-SA) data analysis after (Letunic and Bork 2019), visualization via iTOL https://itol.embl.de.


About the Authors


Table of Contents
Lab Exercise: Evolution: Geological Time, Primate and Human Evolution, and Molecular 11
I. Geological and Evolutionary Timeline 11
A. Geological Evolutionary Timeline 11
II. Primate and Human Derived Characteristics 14
A. Primate Derived Characteristics 14
B. Human Derived Characteristics 14
A. The use of molecular data 15
B. Molecular evolution exercise 16
Lab Report: Evolution: Geological Time, Primate and Human Evolution, and Molecular 17
I. Geological and Evolutionary Timeline 17
II. Primate and Human Derived Characteristics 18
B. Molecular evolution exercise 19
Lab Exercise: Evidence of Evolution And Population Genetics 20
C. Exercise 1: The Effect of Natural Selection 22
D. Exercise 2: The Effect of Genetic Drift 25
Lab Report: Evidence of Evolution And Population Genetics 29
C. Exercise 1: The Effect of Natural Selection 29
D. Exercise 2: The Effect of Genetic Drift 30
Lab Exercise: Phylogenetics 31
I. Building the Phylogenetic Tree 31
C. Understanding phylogenies 32
Exercise 1. Reconstructing primate evolution 37
Exercise 2. Building the Phylogenetic Tree 38
Building the Phylogenetic Tree 43
Exercise 1: Prokaryotic survey 1 49
Exercise 2: Prokaryotic survey 2 49
Exercise 3. Bacteria verses conditions. 53
Exercise 4: Adopt a Bacterium 54
Exercise 1: Prokaryotic survey 1 56
Exercise 2: Prokaryotic survey 2 57
Exercise 3. Bacteria verses conditions. 61
Exercise 4: Adopt a Bacterium 61
A. Introduction: Protists - Who are they? 63
C. Classification and Phylogeny of Protists - Four Eukaryotic Supergroups 65
II. Four Eukaryotic Supergroups- Excavata,”SAR” clade, Archaeplastida, and Unikonta 65
B. Supergroup Archaeplastida 69
I. Fungal Classification and Phylogeny 76
C. Classification/Phylogeny of Fungi 77
II. Exercises: Fungal Diversity 79
D. Imperfect Fungi (Deuteromycota) 85
II. Exercises: Fungal Diversity 89
D. Imperfect Fungi (Deuteromycota) 90
Lab Exercise: Nonvascular Plants and Seedless Vascular Plants 91
I. Kingdom Plantae: Origin and Phylogeny 91
A. Introduction: Evolution, Classification, and Life Cycle 91
III. Seedless Vascular Plants 97
Lab report: Nonvascular Plants and Seedless Vascular Plants 100
I. Kingdom Plantae: Origin and Phylogeny 100
A. Introduction: Evolution, Classification, and Life Cycle 100
III. Seedless Vascular Plants 103
A. Alternation of generations 105
C. Classification- Gymnosperms and Angiosperms 106
C. Classification- Gymnosperms and Angiosperms 118
Lab Exercise: Animals I - Invertebrates 122
Superphylum Lophotrochozoa 131
Lab Report: Animals I – Invertebrates 143
Superphylum Lophotrochozoa 147
Lab Exercise: Animals II - Vertebrates 155
i. Overview and Hypothesis 157
Clade: Osteichthyes (Actinopterygii) 162
Lab Report: Animals II - Vertebrates 174
E. Clade: Osteichthyes (Actinopterygii) 177
III. Predator-Prey Dynamics 188
III. Predator-Prey Dynamics 194
I. Ecological Niche and the Effects of Competition 196
II. Keystone Species and Trophic Cascades 197
I. Ecological Niche and the Effects of Competition 200
II. Keystone Species and Trophic Cascades 200
Lab Exercise: Evolution, Geological Time, Primate and Human Evolution, and Molecular
Farshad Tamari, Ph.D.
Figures and text are intended for OER
Objectives:
- Identify major geological and evolutionary events
- Create a scaled timeline of major evolutionary events and indicate the approximate date of each
- Calculate the proportion of earth’s history for which various groups of organisms have existed
- List derived characteristics of primates and humans
- Distinguish between primitive and advanced characteristics in primate facial and skull bones
- Analyze evolutionary relationships using molecular (DNA) evidence
I. Geological and Evolutionary Timeline
A. Geological Evolutionary Timeline
Earth is approximately 4600 million years old (equivalent to 4.6 billion years old). The major events of the evolution of life on earth are summarized in Table 1, and together with the exercise that follows are adopted (with modification), from Barrow 2016. For the full article entitled Picturing Evolution through Geologic Time click here.
Major Event | Time (million years ago, mya) |
Earth forms | 4600 |
Prokaryotes | 3400 |
O2 appearance | 2400 |
Eukaryotes | 1200 |
Animals with shells | 600 |
Fish | 520 |
Amphibians | 435 |
Vascular plants | 425 |
Reptiles | 350 |
Mammal-like organisms | 275 |
Dinosaurs | 245 |
Birds | 165 |
Flowering plants | 125 |
Dinosaur extinction | 65 |
Modern mammals | 65 |
Modern humans | 0.2 |
Present | 0 |
Table 1: Major events throughout Earth’s history. Prepared by F. Tamari, adopted from Barrow 2016.
B. Exercise
Using string (thread) and a tape measure or a long ruler, measure a piece of string 4.6 meters long. Lay it flat on a surface. This represents a timeline of the Earth’s 4.6-billion-year history.
Calculate what each unit of the ruler represents in a number of years. For example:
If 4.6 m = 4.6 billion years, then 1 m = 1 billion years.
1 m = 1 billion years
1 cm = ________ years
1 mm = ________ years
Using masking tape, place a thin piece of tape on the string at the appropriate distance to indicate each evolutionary event from Table 1 on the string. On the tape indicate the date and the event. Do this until you have marked all the events on the string. Please note that in order to mark the events to scale as required, you will need to use the conversion factors you calculated in the previous step. For example, if you are marking the origin of the prokaryotes to scale, you need to know how far 3400 million years would be from 4600 million years (the beginning of your timeline). You can solve it using algebra, like this:
3400 million = X
4600 million 4.6 m
You can solve for X algebraically as follows:
X = (3400 million * 4.6 m) / 4600 million
The units “million” cancel, and your final answer is in meters (m).
This tells you how many meters to measure from 0 (the end of your timeline, or the present day). That is the point where you will place the event “prokaryotes.” Calculate the other events in Table 1 in a similar manner.
Answer the following questions:
1. What patterns if any did you notice in the timeline? In other words, what did you notice or what surprised or interested you about the spacing of the events?
2. What proportion (in %) of Earth’s life history does each even represent? Complete your work in table 2 below and show your calculations.
Major Event | Time (mya) | Calculation (work) | Proportion (%) |
Earth forms | 4600 | ||
Prokaryotes | 3400 | e.g., 100%*(3400)/4600= | ~ 74% |
O2 appearance of O2 | 2400 | ||
Eukaryotes | 1200 | ||
Animals with shells | 600 | ||
Fish | 520 | ||
Amphibians | 435 | ||
Vascular plants | 425 | ||
Reptiles | 350 | ||
Mammal-like organisms | 275 | ||
Dinosaurs | 245 | ||
Birds | 165 | ||
Flowering plants | 125 | ||
Dinosaur extinction | 65 | ||
Modern mammals | 65 | ||
Modern humans | 0.2 | ||
Present | 0 |
Table 2: Major events throughout Earth’s history exercise
II. Primate and Human Derived Characteristics
A. Primate Derived Characteristics
Primates are a group of mammals that include all monkeys and apes. The apes include gorillas, orangutans, chimpanzees, and humans.
The following are five derived characteristics of all primates:
A. Hands and feet for grasping
B. Large brain short jaws
C. Forward-looking eyes
D. Complex social behavior and parental care
E. Opposable thumbs (monkeys and apes)
B. Human Derived Characteristics
The following are five derived characteristics of humans:
A. Upright posture
B. Bipedal locomotion (on two legs)
C. Large brain
D. Language
E. Symbolic thought
An indication of the larger brain size is evidence found from cranial bones in skull fossils of different taxa. Here are some representatives:

Figure 1: Cranial and facial bone replicas. Photos by D. Brogun, panel by F. Tamari.
C. Skull fossil exercise
Watch this short video by:
American Museum of Natural History (https://www.youtube.com/watch?v=DZv8VyIQ7YU).
1. It is estimated that the chimpanzees diverged from the lineage that gave rise to the human lineage about 6 mya (including Australopithecines such as Lucy and later, other Homo species such as Homo neaderthalensis, the Neanderthals). Modern humans (Homo sapiens) evolved approximately 200,000 years ago (0.2 mya). What patterns do you notice with respect to the following cranial/facial features as we move from primitive (left) to advanced (right)?
- Jaw length:
- Cranium size:
- Bridge of the nose:
- Eyebrow ridge:
- Teeth number and specialization:
III. Molecular Evolution
A. The use of molecular data
Molecular data can be used to delineate relationships among organisms. The more DNA identity (similarity) the more closely two species are (the more recent their ancestry and point of divergence). The more DNA difference (dissimilarity) the more distantly related two organisms are considered to be. It is, therefore, valuating to calculate how similar or dissimilar conserved sequences of DNA are.
For example, look at the following two sequences (N2 and N1), representing short DNA sequences belonging to two different species. They have been aligned using bioinformatics software. Consider the first 100 nucleotides. How many of the nucleotides are identical between species N2 and N1?
Using the same software, the differences can be highlighted. Here’s a snapshot of this simple analysis.
Figure 2: DNA alignment of two simulated DNA from two hypothetical species, N1 and N2. Alignment and figure by F. Tamari

Figure 3: DNA alignment of two simulated DNA from two hypothetical species, N1 and N2. Alignment and figure by F. Tamari
For the first 100 nucleotides:
% difference = {(100%)* (# changed nucleotides)}/total number of nucleotides considered
=100%*3/100
= 3%
% identity = {(100%)* (# unchanged nucleotides)}/total number of nucleotides considered
=100%*97/100
= 97%
B. Molecular evolution exercise
1. Consider the following alignment for two species, N3 and N4.

Figure 4: DNA alignment of two simulated DNA from two hypothetical species, N3 and N4. Alignment and figure by F. Tamari.
Calculate both % difference and % identity. Show all your work.
% difference =
% identity =
Lab Report: Evolution: Geological Time, Primate and Human Evolution, and Molecular
Farshad Tamari, Ph.D.
Figures and text are intended for OER
Click here to access a downloadable version of the lab report.
I. Geological and Evolutionary Timeline
B. Exercise
Using string (thread) and a tape measure or a long ruler, measure a piece of string 4.6 meters long. Lay it flat on a surface. This represents a timeline of the Earth’s 4.6 billion-year history.
Calculate what each unit of the ruler represents in a number of years. For example:
If 4.6 m = 4.6 billion years, then 1 m = 1 billion years.
1 m = 1 billion years
1 cm = ________ years
1 mm = ________ years
Now calculate the placement of each event in meters. Use the formula given in the lab instructions and record your answers in the table below.
Major Event | Time (million years ago, mya) | Placement of event (in meters) |
Earth forms | 4600 | |
Prokaryotes | 3400 | |
O2 appearance | 2400 | |
Eukaryotes | 1200 | |
Animals with shells | 600 | |
Fish | 520 | |
Amphibians | 435 | |
Vascular plants | 425 | |
Reptiles | 350 | |
Mammal-like organisms | 275 | |
Dinosaurs | 245 | |
Birds | 165 | |
Flowering plants | 125 | |
Dinosaur extinction | 65 | |
Modern mammals | 65 | |
Modern humans | 0.2 | |
Present | 0 |
Table 1: Major events throughout Earth’s history. Prepared by F. Tamari, adopted from Barrow 2016.
Answer the following questions:
1. What patterns if any did you notice in the timeline? In other words, what did you notice or what surprised or interested you about the spacing of the events?
2. What proportion (in %) of Earth’s life history does each even represent? Complete your work in table 2 below and show your calculations.
Major Event | Time (mya) | Calculation (work) | Proportion (%) |
Earth forms | 4600 | ||
Prokaryotes | 3400 | e.g. 100%*(3400)/4600= | ~ 74% |
O2 appearance of O2 | 2400 | ||
Eukaryotes | 1200 | ||
Animals with shells | 600 | ||
Fish | 520 | ||
Amphibians | 435 | ||
Vascular plants | 425 | ||
Reptiles | 350 | ||
Mammal-like organisms | 275 | ||
Dinosaurs | 245 | ||
Birds | 165 | ||
Flowering plants | 125 | ||
Dinosaur extinction | 65 | ||
Modern mammals | 65 | ||
Modern humans | 0.2 | ||
Present | 0 |
Table 2: Major events throughout Earth’s history exercise.
II. Primate and Human Derived Characteristics
C. Skull fossil exercise
Watch these short videos by:
Chris Stringer (https://www.cshl.edu/dnalcmedia/sorting-out-human-evolution-chris-stringer/) and the
American Museum of Natural History (https://www.youtube.com/watch?v=DZv8VyIQ7YU).
1. It is estimated that the chimpanzees diverged from the lineage that gave rise to the human lineage about 6 mya (including Australopithecines such as Lucy and later, other Homo species such as Homo neaderthalensis, the Neanderthals). Modern humans (Homo sapiens) evolved approximately 200,000 years ago (0.2 mya). What patterns do you notice with respect to the following cranial/facial features as we move from primitive (left) to advanced (right)?
- Jaw length:
- Cranium size:
- Bridge of the nose:
- Eyebrow ridge:
- Teeth number and specialization:
III. Molecular Evolution
B. Molecular evolution exercise
1. Consider the following alignment for two species, N3 and N4.
Figure 4: DNA alignment of two simulated DNA from two hypothetical species, N3 and N4. Alignment and figure by F. Tamari.
Calculate both % difference and % identity. Show all your work.
% difference =
% identity =
Lab Exercise: Evidence of Evolution and
Population Genetics
Farshad Tamari, Ph.D.
Figures and text are intended for OER
Objectives:
I. Hardy-Weinberg Theorem
- Describe evidence of evolution that is based on microevolution and population genetics
- Define and use the terminology of population genetics correctly
- Use the equations of the Hardy-Weinberg equilibrium to calculate allele and genotype frequencies
- Graph allele frequencies using Microsoft Excel and identify changes in allele frequencies
- Draw graphs and explain three types of selection
A. Introduction
Direct evidence of a population that is evolving is a change in allele frequencies. The Hardy-Weinberg Theorem is one way to determine whether allele or genotype frequencies are changing from generation to generation. It states that under the conditions listed below, alleles and genotype frequencies do not change from generation to generation. As you know, most of the conditions (assumptions) are not met in real populations, and therefore, populations evolve.
Changes in allele frequencies can be calculated based on the following equations:
p + q = 1
p = frequency of dominant alleles in a population
q = frequency of recessive alleles in a population
Squaring both sides (p + q)2 = 12 will yield:
p2 + 2pq + q2 = 1
p2 = frequency of homozygous dominant genotypes (individuals) in a population
q2 = frequency of homozygous recessive genotypes (individuals) in a population
2pq = frequency of heterozygous genotypes (individuals) in a population
The conditions (assumptions) of the Hardy-Weinberg Equilibrium are:
No mutations
Random mating
No natural selection
Extremely large population size
No gene flow
No genetic drift
B. Some definitions
Terms | Definition |
Microevolution | Microevolution is a change in allele frequencies in a population over generations |
Alleles | Alternative forms of a gene, or variations of a gene |
Natural selection | Differential survival and reproduction of individuals in a population of a particular species |
Gene flow | The movement of alleles among populations die to immigration and/or emigration |
Speciation | The origin of new species |
Mutation | Changes in the nucleotide sequence of DNA |
Genetic drift | Fluctuations in allele frequencies from one generation to the next that are not based on selection |
Bottleneck effect | Constriction of the gene pool due to natural disasters (this is one example of genetic drift) |
Founder effect | Constriction of the gene pool when a few individuals become isolated from a larger population (another example of genetic drift) |
Directional selection | Favors individuals at one end of the phenotypic range |
Stabilizing selection | Favors intermediate variants and acts against extreme phenotypes at either end of the phenotypic range |
Disruptive selection | Favors individuals at both extremes of the phenotypic range and acts against intermediate variants |
Homozygous | Having two identical alleles at a particular locus |
Heterozygous | Having two different alleles at a particular locus |
Dominant | An allele that suppresses the expression of a recessive allele in a heterozygote |
Recessive | An allele whose expression is suppressed if a dominant allele is present (as in heterozygotes), but expressed in the homozygous state |
C. Exercise 1: The Effect of Natural Selection
Helpful Videos: Hardy-Weinberg problems https://www.youtube.com/watch?v=xPkOAnK20kw
How to graph in Excel https://www.youtube.com/watch?v=Xn7Sd5Uu42A
1. At-home activity: Selection of prey by a predator
Print the figure below, or draw forty small circles on a sheet of paper. Fill in 10 of the circles with black ink, fill 20 with a pencil (or a different color), and leave 10 of the circles white. These circles represent the prey species, and their colors represent variations (such as the ability to hide or to run fast) that may help them avoid being hunted and eaten by a predator. There are two alleles for the color gene, white (p) and black (q). The gray individuals are heterozygous.

Now, you will act as the predator and “hunt” the circles by drawing an X through 3 white circles, 2 gray circles, and 1 black circle. Begin by setting 30 seconds on the timer on your phone, and then start the countdown and your hunt. After each X that you draw, count to 10 in your head (about 3 seconds) before drawing the next X. If you have crossed out 3 white, 2 gray, and 1 black and you still have time left on the clock, repeat the same pattern until your 30 seconds is up. But remember to leave a little time (3 seconds or so) between each kill, or you will run out of prey before the 30 seconds is up.
The number of each color that you hunt (3 white, 2 gray, 1 black) represents the advantage that each prey variation has. You can find and eat more white than black because white is less well adapted than black. Based on the instructions given here, which color do you think is best adapted to avoid predation? Write a hypothesis about what will happen to the frequency of each allele over time.
When 30 seconds are up, see how many survivors are left (circles not crossed out are survivors). Use the number of survivors to calculate p and q as instructed below. Once you have p and q, you will calculate p2, 2pq, and q2 and use those numbers to predict how many circles of each color there will be in the next generation, as instructed below.
Once you have the new generation, repeat the hunting and the calculations in the same manner (step-by-step instructions are below). You will do this 3 times for 3 generations in total, and then you will graph your results in Excel. KCC students have free access to a web version of Excel. Click here for details.
2. Calculations
In generation 1 (represented by the figure above), the allele and genotype frequencies are as follows:
CWCW = Homozygous (white)
CWCB = Heterozygous (gray)
CBCB = Homozygous (black)
We will designate the white allele CW as p, and the black allele CB as q. There are 40 individuals in the original population, which means there are 80 alleles total since the individuals are diploid.
10 white circles 20 gray circles 10 black circles
p = [(2 x 10) + 20]/80 = 0.5
p + q =1, therefore, q = 0.5
If you are not sure why p and q are calculated in this way, please review the videos, the reading, or the PowerPoint for this week before continuing.
After the hunt, imagine that the following numbers of individuals survive. Record the number of survivors for generation 1 in the table in your lab report. Your actual number of survivors may be different from those below, but this example will show you how to do the calculations to figure out the proportions of colored circles for generation 2.
4 white circles 14 gray circles 8 black circles
Now we must recalculate new p and q values (see below). Remember that the white allele is p and the black allele is q.
p = [(2 x 4) + 14]/52 = 0.423, and q = 1- 0.42 = 0.577
p2 = (0.423)2 = 0.18 (round to two decimal places)
q2= (0.577)2 = 0.33 (round to two decimal places)
2pq = 2 * 0.423 * 0.577 = 0.49 (round to two decimal places)
Now we construct a new population with 50 individuals using the above p2, 2pq, and q2 values. You will need to round up or down to the nearest whole number if the formula gives you a number such as 16.5.
9 white circles 24 gray circles 17 black circles
(50 x p2) = 9 (50 x 2pq) = 24 (round down) (50 x q2) = 17 (round up)
You will calculate p, q, p2, 2pq, and q2 using the number of survivors in your own trial. Record the values in the table in your lab report.
Now draw generation 2 with the predicted values and do the hunt again. From the example above, we would use 9, 24, and 17 and draw the circles as shown below. Remember, you should use the numbers you calculated from your own hunt rather than these example numbers.

Now hunt again, as you did before, and record the number of survivors in your lab report. Then calculate new allele and genotype frequencies.
Based on the new allele and genotype frequencies you calculated, construct a new population (generation 3) of 50 individuals. If you have time, repeat the experiment two more times for a total of 5 generations. It may be difficult to see a trend and draw any conclusions about your hypothesis with only 3 generations.
Using Microsoft Excel, plot allele frequencies (p and q) and copy and paste your graph into the lab report. Your graph may look similar to the graph below. In 3 or 4 sentences in your lab report, describe and interpret your graph. Do the results support your hypothesis?

D. Exercise 2: The Effect of Genetic Drift
Construct an original population as you did above using 40 circles (10 white, 20 gray, and 10 black) on a piece of paper.
Calculate the allele frequencies (p and q) for the original population as you did before. They should be the same as before in generation 1.
Now, cut off a portion of the population due to genetic drift (bottleneck or founders effect). See the figure below as an example, but you can place the line anywhere you wish. The line represents some kind of natural disaster that wipes out part of the population, and only the portion of the population on the right survives. Are the changes in allele frequencies related to the color of the circles, or not? Write a hypothesis in your lab report about the effect of the natural disaster on the frequencies of the black and white alleles. Calculate new allele frequencies for the survivors. Are the new allele frequencies similar to those from the original population or do they differ significantly? In your lab report, predict how the allele frequencies would differ depending on where the line was placed. Is your hypothesis supported? How is this different from what happened in Exercise 1 above?

II. Types of Selection
Variation in a population is important for evolution. Natural selection works on individuals’ phenotypes. In general, if there is selection, it may select for or against particular phenotypes. The figures below depict three possible scenarios. In your lab report, indicate which type of selection was at work in the activity you did for exercise 1.

- Directional selection: A particular phenotype at an extreme end is being selected for, shifting the resulting population with respect to that particular phenotype to the right (below) or left (also possible).

- Stabilizing selection: A particular intermediate phenotype is being selected for, resulting in a population with less frequency in extreme phenotypes and more of the intermediate phenotypes.

- Disruptive selection: Phenotypes at the extremes are being selected for, and those that are intermediate are selected against; resulting in a population with more frequency in extreme phenotypes and less of the intermediate phenotypes.
Lab Report: Evidence of Evolution and Population Genetics
Farshad Tamari, Ph.D.
Figures and text are intended for OER
Click here to access a downloadable version of the lab report.
I. Hardy-Weinberg Theorem
C. Exercise 1: The Effect of Natural Selection
1. Write a hypothesis about what will happen to the frequency of each allele (black and white) over time.
2. Fill in the values for each generation.
Generation | # of survivors | p (white allele) | q (black allele) | p2 (predicted freq. of white homozyg.) | 2pq (predicted freq. of heterozyg.) | q2 (predicted freq. of black heterozyg.) | p2 * 50 (# of white circles for the next generation) | 2pq * 50 (# of gray circles for the next generation) | q2 * 50 (# of black circles for the next generation) |
1 | |||||||||
2 | |||||||||
3 | |||||||||
4 | |||||||||
5 | * | * | * | * | * | * |
*No data needed here, since we will not do the 6th generation
3. Copy and paste your graph here:
4. In 3 or 4 sentences, describe and interpret your graph. Do the results support your hypothesis?
D. Exercise 2: The Effect of Genetic Drift
1. Write a hypothesis about the effect of the natural disaster on the frequencies of the black and white alleles.1
2. Calculate new allele frequencies for the survivors.
3. Are the new allele frequencies similar to those from the original population or do they differ significantly?
4. In 1-2 sentences, predict how the allele frequencies would differ depending on where the line was placed.
5. Was your hypothesis supported? How is this different from what happened in Exercise 1 above?
II. Types of Selection
After studying the graphs in your lab depicting directional, stabilizing, and disruptive selection, consider the results of exercise 1. In that exercise, was the selection directional, stabilizing, or disruptive? Explain in 1-2 sentences how you know.

Lab Exercise: Phylogenetics
Dmitry Y. Brogun, Ph.D.
* Figures and text are intended for OER
Objectives:
- Explain how the following evidence is used for phylogenetic reconstruction: the fossil record, DNA, and biogeography.
- Describe specific examples of phylogenetic reconstruction, such as the relationship of humans to other primates.
- Build and analyze a phylogenetic tree, identifying patterns of shared ancestry.
- Differentiate between the allopatric and sympatric modes of speciation.
I. Building the Phylogenetic Tree
A. Introduction
Taxonomy is the classification of organisms. Phylogenies represent the foundation in classifying organisms based on their evolutionary relationships. The phylogenetic tree, depicted on the next page in Figure 1, represents patterns of ancestry - an evolutionary relatedness. In order to reconstruct these relationships, biologists must collect and analyze evidence, which they use to form a hypothesis about how the organisms are related — a phylogeny. In laboratory one, you analyzed the fossil records as evidence to support your hypothesis. In this laboratory, you will be analyzing the DNA sequences to reconstruct human evolution.
To build a phylogenetic tree such as the one on the next page in Figure 1, biologists collect data about the characters of each organism they are interested in. (For the moment, don’t worry about trying to read the names of the organisms on each branch.) Characters are heritable traits that can be compared across organisms, such as physical characteristics (morphology), genetic sequences (DNA, RNA, and proteins), and behavioral traits. Biogeography (the distribution of organisms) can also be used as evidence in reconstructing phylogeny.

C. Understanding phylogenies
In this exercise, you will learn the terminology that phylogeneticists use when constructing or analyzing phylogenetic trees. It may help to watch this video first (strongly recommended):
Reading Phylogenetic Trees (13-minute video)
https://www.youtube.com/watch?v=wCRRhZ7rO7k
B. Definitions
Terms | Definition |
Phylogenetics | Study of evolutionary relationships among individuals or genes |
Phylogeny | Actual pattern of evolutionary relationships among individuals or genes |
Taxonomy | Naming and classification of organisms |
Lineage | Series of organisms, populations, cells, or genes connected by ancestor/descendent relationships |
Phylogenetic Tree | Hypothetical reconstruction of the ancestral evolutionary relationships among individuals or genes via mathematical structure |
Node | Split point or branch point on the phylogenetic tree |
Internal Node | Represent hypothetical ancestors on the tree |
Terminal Node (aka OTU) | Represent discrete groups or individuals on the tree, grouped by similarity OTU- Operational Taxonomic Unit |
Branches | Connect nodes on the phylogenetic tree |
Root | Represent the ancestor of all the individuals or genes in the tree |
Clade | A group that includes a common ancestor and all the descendants (living and extinct) of that ancestor. A kingdom, a phylum, a family, or a species represent clades at different taxonomic levels. |
Monophyletic | Group of organisms that includes all the descendants |
Polyphyletic | Group of organisms that doesn’t includes all the descendants |
Allopatric speciation | Reproductive isolation due to the geographical separation of populations |
Sympatric speciation | Reproductive isolation takes place within the population without the geographical isolation separation |
Homologous | Shared ancestry in the evolutionary history of life |
Analogous | Different ancestry in the evolutionary history of life |
Then, study Table 1 below to familiarize yourself with the scientific names of the organisms we will use in our sample tree.
Genus | species | Common Name |
Escherichia | coli | Bacteria |
Drosophila | melanogaster | Fruit fly |
Gallus | gallus | Chicken |
Mus | musculus | Mouse |
Homo | sapiens | Human |
Table 1. Organisms used in this exercise. Prepared by D. Brogun.
Next, examine each image below, reading the explanations as you go. Figure 2 shows you the phylogenetic tree for the organisms in Table 1. Note that the left represents ancestors in the past, with the present-day species represented on the right. The length of each branch is proportional to the amount of time since the origin of each species from its common ancestor with the sister taxon next to it on the tree.
To start, we need to answer the question, what is a phylogenetic tree? First, for the evolutionary biologists, the phylogenetic tree represents a hypothesis that they use to test their predictions while reconstructing the ancestral relatedness. Second, indeed, it is a geometrical structure that often uses complicated mathematical algorithms to decipher the actual patterns of evolutionary lineages. With that in mind let’s dive into the phylogenetic tree terminology. Like a living tree, a phylogenetic tree consists of branches that are connected to nodes. The external nodes, also called Operational Taxonomic Units (OTUs) can either represent organisms as depicted in figure 2 (confide by a larger red rectangle) or DNA and protein sequences.

The internal nodes represent the ancestral lineages, and at the point, they join tree branches signifying speciation, depicted in figure 3 (confide by a black rectangle). Speciation can give rise to two or more daughter lineages, discussed below and figure 6.

Phylogenetic trees allow researchers to model common and unique evolutionary relationships between lineages. Since each lineage has the evolutionary changes that are specific to it alone and parts that are shared with other lineages.

In fact, each lineage has ancestors that are unique to that lineage and ancestors that are shared with other lineages through common ancestry.

A monophyletic group that includes all the descendants (living and extinct) of a common ancestry forms a clade. It is relatively easy to tell by just looking at the phylogenetic tree whether a monophyletic group of lineages forms a clade. You can ask yourself, what if I remove a single branch of the phylogenetic tree — will all of the organisms on that removed branch make up a clade? Thus, a monophyletic group includes all of the ancestors, whereas a non-monophyletic group, sometimes referred to as polyphyletic excludes some of them. Hint: follow the green-shaded and red-shaded rectangles in figure 6 below.

When reconstructing the evolutionary relatedness among organisms it is important to acknowledge the phylogenetic tree patterns of lineage branching might tell us the true phylogeny of the organisms being considered. Many of the phylogenies you encounter are groups of closely related species, but we can also use phylogeny to depict the relationships between all life forms.
Finally, there are many ways to depict the phylogenetic tree without changing its meaning. It is important to keep in mind that the tree branches can be rotated, and the choice of which clade goes to the right and which goes to the left does not change the relationships of the terminal nodes. Do the following phylogenetic trees below are equivalent?

Phylogeneticists often put the clade they are most interested in (whether that is Humans, chickens, or bacteria) on the right side of the phylogeny. You can read more about phylogenetic trees by following this link https://courses.lumenlearning.com/wm-biology2/chapter/phylogenetic-trees-2.
Exercise 1. Reconstructing primate evolution
Hypothesis: All primates share a common ancestry
The points described above can cause problems when it comes to human evolution because many of the related primate species are extinct (so-called “missing links” that make it more difficult to determine who our closest relatives are). The phylogeny of living species most closely related to us looks like this:

In your lab report, identify and label all parts of the phylogenetic tree depicted above (hint: check the definitions table in the introduction if you need help).
1. Root
2. Internal and External nodes
3. OTUs
4. Redraw the tree to show the unique phylogeny of the Gorilla lineage with a dotted line. In other words, use a dotted line (or a different color, whatever you like) to indicate the shared lineage of the gorillas and the unique lineage of the gorillas (see Figure 4 for an example).
5. Do the Bonobos, Chimpanzees, and Humans form a clade? Is it monophyletic? Explain how you know.
Exercise 2. Building the Phylogenetic Tree
In this exercise, you will practice building your own phylogenetic tree. First, you will manually align DNA sequences from five primates, listed in Table 3 on p. 9. To do this, you will draw vertical lines between matching nucleotides and leave blank spaces between non-matching ones (as shown in Figure 9 on the next page). Your ultimate goal is to construct a phylogenetic tree based on your manual alignments.
You will use the human DNA sequence as your reference sequence during your experiment—meaning that all other sequences will be compared to the human sequence. On the next page, you will find an example of a manual alignment between Human and Bonobo nucleotide sequences (Figure 9). These sequences are clearly similar yet are not identical. Your task is to identify which regions of the two sequences are homologous.
In the example below the two sequences are different at the sixth, seventh and eleventh positions. But with only 4 letters in the nucleotide code, you can imagine that it might be possible to align similar regions of two sequences in more than one way. More issues can arise the less related the two sequences are—if more time has passed since the common ancestor, then more mutations have probably accumulated, including deletions or insertions of larger sections of DNA that will affect alignment. So, we need a way to determine which alignment is the most likely. We do this by calculating the “cost” of a particular alignment. The lower the “cost” of the alignment, the more likely it is that your alignment is correct.
Using the formula D = s + wg, where D is the cost of alignment, s is the number of substitutions (the number of differences in the two sequences), g is the total length of any gaps, and w is the gap penalty, we can calculate the cost.
Thus, the ‘cost’ of the alignment shown below is D = 3. This number was calculated based on the alignment analysis that there are no gaps, thus g = 0, and the gap penalty w = 1 (this will be a constant in our example since we will not be aligning any sequences with gaps). There are only three nucleotide substitutions, thus s = 3. So, when we plugged the numbers into the formula to calculate the cost of the alignment, D = 3 + 1 * 0, thus D = 3. You need to repeat these calculations and manual alignments for the remaining primate species listed in Table 3 (on p. 9).

After you have completed your manual alignments and calculated the costs, you must reconstruct the primate evolution in a phylogenetic tree in your lab report. You will draw your nodes and connect your tree branches and list the OTUs. Please, keep in mind that in your phylogenetic experiment the OTUs with the lowest alignment costs will be joined by the adjacent branches, i.e. forming a clade, as depicted below in figure 10. Will your phylogenetic trees resemble the phylogeny depicted in figure 8?

Below you will find a table summarizing the primate species and the DNA sequences that you will need to analyze during your phylogenetic experiment.
Species | DNA Nucleotides (25 bases long) |
Human | ATGCTTGCATTTGCATTAATAGCGC |
Orangutan | TTCCACTCGTGTCTGACAAGATCAC |
Gorilla | TTGCAGGCGTGTCTCACAACATCCC |
Chimpanzee | ATGCTCACATATGCGTAAATAGCGC |
Bonobo | ATGCTCACATATGCGTTAATAGCGC |
Table 3. List of primates and the DNA sequences. Prepared by D. Brogun.
It is important to remember that:
- Humans did not evolve from chimpanzees. Humans and chimpanzees are evolutionary cousins and share a recent common ancestor that was neither chimpanzee nor human.
- Humans are not "higher" or "more evolved" than other living lineages. Since our lineages split, humans and chimpanzees have each evolved traits unique to their own lineages.
II. Types of Speciation
Biologists must answer the ultimate question in evolution - how a continuous process of evolutionary change can produce the discrete entities we recognize as different species? Could it be that specific gene changes are involved in reproductive isolation? Below we describe the two types of population genetics of speciation. The figures below depict two possible scenarios:
A. Sympatric speciation: During this speciation reproductive isolation takes place within a single population without geographical isolation. For example, an mtDNA phylogenetic tree of the cichlid fish species shows that they are monophyletic, suggesting that Lake 1 was colonized by the fish once, thus the speciation occurs without geographic isolation, phylogenetic tree branches depicted in red (Figure 11A).


Lab Report: Phylogenetics
Dmitry Y. Brogun, Ph.D.
* Figures and text are intended for OER
Click here to access a downloadable version of the lab report.
Exercise 1.
Reading the phylogenetic tree.
Identify and label all parts of the phylogenetic tree depicted above (hint: check the definitions table in the introduction if you need help).
1. Root
2. Internal and External nodes
3. OTUs
4. Redraw the tree to show the unique phylogeny of the Gorilla lineage with a dotted line. In other words, use a dotted line (or a different color, whatever you like) to indicate the shared lineage of the gorillas and the unique lineage of the gorillas (see Figure 4 for an example).
5. Do the Bonobos, Chimpanzees, and Human form a clade? Is it monophyletic?
Explain how you know.
Exercise 2.
Building the Phylogenetic Tree
In this exercise, you will practice building your own phylogenetic tree. First, you will manually align DNA sequences from five primates, listed in Table 3 on p. 9. To do this, you will draw vertical lines between matching nucleotides and leave blank spaces between non-matching ones (as shown in Figure 9 on the next page). Your ultimate goal is to construct a phylogenetic tree based on your manual alignments.
You will use the human DNA sequence as your reference sequence during your experiment—meaning that all other sequences will be compared to the human sequence. On the next page, you will find an example of a manual alignment between Human and Bonobo nucleotide sequences (Figure 9). These sequences are clearly similar yet are not identical. Your task is to identify which regions of the two sequences are homologous.
In the example below the two sequences are different at the sixth, seventh and eleventh positions. But with only 4 letters in the nucleotide code, you can imagine that it might be possible to align similar regions of two sequences in more than one way. More issues can arise the less related the two sequences are—if more time has passed since the common ancestor, then more mutations have probably accumulated, including deletions or insertions of larger sections of DNA that will affect alignment. So, we need a way to determine which alignment is the most likely. We do this by calculating the “cost” of a particular alignment. The lower the “cost” of the alignment, the more likely it is that your alignment is correct.
Using the formula D = s + wg, where D is the cost of alignment, s is the number of substitutions (the number of differences in the two sequences), g is the total length of any gaps, and w is the gap penalty, we can calculate the cost.
Thus, the ‘cost’ of the alignment shown below is D = 3. This number was calculated based on the alignment analysis that there are no gaps, thus g = 0, and the gap penalty w = 1 (this will be a constant in our example since we will not be aligning any sequences with gaps). There are only three nucleotide substitutions, thus s = 3. So, when we plugged the numbers into the formula to calculate the cost of the alignment, D = 3 + 1 * 0, thus D = 3. You need to repeat these calculations and manual alignments for the remaining primate species listed in Table 3 (on p. 9).
After you have completed your manual alignments and calculated the costs, you must reconstruct the primate evolution in a phylogenetic tree in your lab report. You will draw your nodes and connect your tree branches and list the OTUs. Please, keep in mind that in your phylogenetic experiment the OTUs with the lowest alignment costs will be joined by the adjacent branches, i.e. forming a clade, as depicted below in figure 10. Will your phylogenetic trees resemble the phylogeny depicted in figure 8?
Below you will find a table summarizing the primate species and the DNA sequences that you will need to analyze during your phylogenetic experiment.
Species | DNA Nucleotides (25 bases long) |
Human | ATGCTTGCATTTGCATTAATAGCGC |
Orangutan | TTCCACTCGTGTCTGACAAGATCAC |
Gorilla | TTGCAGGCGTGTCTCACAACATCCC |
Chimpanzee | ATGCTCACATATGCGTAAATAGCGC |
Bonobo | ATGCTCACATATGCGTTAATAGCGC |
Table 3. List of primates and the DNA sequences. Prepared by D. Brogun.
II. Types of Speciation
Please, provide one example for each question below.
- Biologists must answer the ultimate question in evolution - how a continuous process of evolutionary change can produce the discrete entities we recognize as different species?
- Could it be that specific gene changes are involved in reproductive isolation?
Lab Exercise: Bacteria
Kristin Polizzotto Ph.D., Dmitry Y. Brogun Ph.D., Farshad Tamari Ph.D.
* Figures and text are intended for OER
Objectives:
- Identify and define common bacterial shapes and features, including: cocci, bacilli, spirilli, pili, capsule, spore, fimbriae, flagella, plasmid, Gram-positive cell wall, Gram-negative cell wall.
- Describe various bacterial metabolic processes, including: photosynthesis, chemosynthesis, methanogenesis, nitrogen fixation.
- Identify and describe at least three vital roles that bacteria play in their ecosystems, such as primary production, decomposition, nitrogen fixation, and disease.
Three-Domain System
In a previous lab exercise, you learned about phylogenetics and the classification of organisms. In this laboratory, we will dive deeper into the phylogenetic tree, depicted below in figure 1, and learn about some of the organisms from the three Domains of Life. In 1760, Carolus Linnaeus grouped all living organisms into plants (non-motile) and animals (motile). It took almost two centuries to develop the more appropriate five-kingdom classification proposed by Whittaker and Lynn Margulis in 1968. The kingdoms proposed were Monera (unicellular prokaryotes including bacteria and cyanobacteria), Protista (unicellular eukaryotes including protozoa and unicellular algae, will be discussed in a future lab), Fungi (saprotrophs, will be discussed in a future lab), Plantae (autotrophs, will be discussed in future labs), and Animalia (heterotrophs, will be discussed in future labs). With modern DNA-based technology such as PCR and rDNA (ribosomal DNA) sequence analyses the living world is currently classified as a three-domain system with Bacteria, Archaea, and Eukarya; described by Carl Woese in 1990.

II. Overview of Bacteria
A. Introduction
The bacteria comprise one of the three domains of life and were among the first life on earth. In this lab activity, you will learn more about this fascinating group, without which no other life on earth would likely exist.
Before proceeding, you need to review the major concepts from this week relating to bacteria. You should watch this video, an entertaining and informative (7 min 31 sec) video from the Amoeba Sisters, and read this short article. These two resources will give you an excellent overview of the concepts you will need for this lab activity. You may also find the definitions below useful.
B. Some definitions
Terms | Definition |
Prokaryote | Cells that lack a nucleus and membranous organelles |
Bacteria | Prokaryotes of the Domain Bacteria (distinct from Archaea) |
Peptidoglycan | A macromolecule found in the cell walls of bacteria |
Gram stain | A staining technique that distinguishes between bacteria with different types of cell walls |
Capsule | A layer of linked polysaccharides surrounding the cell wall in certain bacteria |
Pili | Hairlike structures on the surface of some bacteria; used for attachment and adhesion |
Fimbriae | Similar to pili in structure and function, but often more numerous and shorter |
Flagella | Taillike structures on some bacteria that are used for locomotion |
Bacterial spore | A dormant, protective structure formed by some bacteria under adverse environmental conditions |
Plasmid | A small, circular strand of DNA exists outside the main chromosome in some bacteria and replicates independently of the main bacterial chromosome. |
Extremophile | Any organism that can survive in extreme conditions such as high temperature or low pH that would kill most other cells |
Chemosynthesis | The metabolic production of carbohydrates by some prokaryotes, using the energy from spontaneous chemical reactions of inorganic compounds, typically in the absence of sunlight. Compare to photosynthesis. |
Methanogenesis | The metabolic production of methane by some prokaryotes (methanogens). This is one type of anaerobic respiration. |
Nitrogen fixation | The conversion of atmospheric nitrogen (N2) to ammonia (NH3) or other forms of nitrogen that is usable by most cells. Accomplished only by certain bacteria. |
C. Photosynthetic Bacteria
Cyanobacteria have their ecological importance in the global carbon, oxygen, and nitrogen cycles, as well as their evolutionary significance in relationship to plants. Chloroplasts (plastids) are formed by symbiogenesis of cyanobacteria in plants: land plants, green algae (e.g., Chlamydomonas), and red algae. Of the 5 major groups of photosynthetic bacteria, only cyanobacteria are oxygenic during photosynthesis. They are often called blue-green algae, even though not all members are blue-green in color. Most cyanobacteria have a slimy sheath, or coating, which is often deeply pigmented, particularly in species that occur in terrestrial habitats. Cyanobacteria utilize chlorophyll a, which is responsible for their green coloration. In addition, they have unusual accessory pigments called phycobilins, which absorb wavelengths of light for photosynthesis that are missed by chlorophyll and the carotenoids, thus giving blue-green or reddish color to cyanobacteria.
Most cyanobacteria have a Gram-negative type cell wall that consists of an outer membrane component, even though they may show a distant phylogenetic relationship with certain Gram-positive bacteria.
Exercises
Exercise 1: Prokaryotic survey 1
In this exercise, you will examine cyanobacteria for structural and functional organization.

Exercise 2: Prokaryotic survey 2
This exercise is designed to familiarize you with different types of bacteria.
Preliminary Hypothesis: Bacteria will show diversity due to their morphology
The Gram stain technique is used to differentiate bacteria based on the biochemical composition and structure of their cell wall. After staining Gram-positive bacteria appear purple and Gram-negative bacteria appear pink. Identifying an unknown bacterial sample as Gram-negative or Gram-positive tells the investigator a good deal about the structure of the bacterial cell envelope. In clinical settings, knowing whether a patient is suffering from a Gram-negative or Gram-positive infection will influence the selection of antibiotics used to treat the infection.
Procedure:
Analyze images of prepared Gram stain slides of each bacterium provided below.
Examine the pictures of the bacteria provided below and note the cell morphology of each bacterial culture.
Staphylococcus aureus: Staphylococcus spp. are Gram-positive cocci arranged in
irregular, often grape-like, clusters.


Fill out the Prokaryotic survey table below based on your exploratory observations of figures 3-5, by recording the cell shape and Gram-stain.
Bacteria | Shape | Gram-stain reaction |
Treponema pallidium | Shape? | Gram-stain reaction? |
Staphylococcus aureus | Shape? | Gram-stain reaction? |
Bacillus subtilis | Shape? | Gram-stain reaction? |
Table 2. Prokaryotic survey.
Please, continue with a Prokaryotic survey Part 2 located on the next page.

Question:
1) Please draw one bacterium in each empty circle from the four different types of bacteria depicted in the top row.
2)What type of morphology, cellular structures, or arrangement do you observe in these samples presented above? Please, draw your exploratory observations. For better viewing, please, enlarge the images on your screen.
Exercise 3. Bacteria versus conditions.
Some prokaryotes belong to the domain Archaea. Many are extremophiles and thrive in harsh conditions. Here are a few groups:
Methanogens
Sulfur-loving
Thermophiles
Hyperthermophiles
Psychrophiles
Acidophiles
Halophiles
Which specific conditions do you think each group thrives in?
Exercise 4: Adopt a Bacterium
In this exercise, you will choose a specific bacterium and produce a short report on its structure and physiology. Use the lab report page (provided separately) to record specific information about your bacterium. The goal of this investigation is to gain a better understanding of the relationship between specific bacterial structures and their functions.
Here is a list of some of the features you may include in your report. Of course, you will include only those that relate to your chosen bacterial species. Use this list for ideas of what to include.
Bacterial shape
Coccus
Bacillus
Spirillum
Vibrio
Bacterial arrangement
Diplo
Staphylo
Strepto
Bacterial structures
Flagella
Pili or fimbriae
Endospore (capability to form)
Plasmids
Capsule
Gram positive cell wall
Gram negative cell wall
Gram variable cell wall
Bacterial metabolism
Photosynthesis
Chemosynthesis
Methanogenesis
Extremophile
Aerobic respiration
Anaerobic respiration
Fermentation
Methanogenesis
Nitrogen fixation
And if you need help finding an interesting species, here are some websites to check out (although you may certainly find a species on your own).
http://www.bbc.com/earth/story/20150730-ten-bacteria-with-superpowers
https://www.inverse.com/article/11386-ranking-the-top-10-best-bacteria-on-earth
https://www.discovermagazine.com/planet-earth/top-ten-bacteria
Lab Report: Bacteria
Kristin Polizzotto Ph.D., Dmitry Y. Brogun Ph.D., Farshad Tamari Ph.D.
* Figures and text are intended for OER
Click here to access a downloadable version of the lab report.
Exercises
Exercise 1: Prokaryotic survey 1
In this exercise, you will examine cyanobacteria for structural and functional organization.
Exercise 2: Prokaryotic survey 2
This exercise is designed to familiarize you with different types of bacteria.
Please, write your Preliminary Hypothesis:
Procedure:
Analyze images of prepared Gram stain slides of each bacterium provided below.
Examine the pictures of the bacteria provided below and note the cell morphology of each bacterial culture in Table 2.
Staphylococcus aureus: Staphylococcus spp. are Gram-positive cocci arranged in irregular, often grape-like, clusters.
Fill out the Prokaryotic survey table below based on your exploratory observations of figures 3-5,
by recording the cell shape and Gram-stain.
Bacteria | Shape | Gram-stain reaction |
Treponema pallidum | Shape? | Gram-stain reaction? |
Staphylococcus aureus | Shape? | Gram-stain reaction? |
Bacillus subtilis | Shape? | Gram-stain reaction? |
Table 2. Prokaryotic survey.
Question:
1) Please draw one bacterium in each empty circle from the four different types of bacteria depicted in the top row.
2)What type of morphology, cellular structures, or arrangement do you observe in these samples presented above? Please, draw your exploratory observations. For better viewing, please, enlarge the images on your screen.
Exercise 3. Bacteria versus conditions.
Some prokaryotes belong to the domain Archaea. Many are extremophiles and thrive in harsh conditions. Here are a few groups:
Methanogens
Sulfur-loving
Thermophiles
Hyperthermophiles
Psychrophiles
Acidophiles
Halophiles
Which specific conditions do you think each group thrives in?
Exercise 4: Adopt a Bacterium
In this exercise, you will choose a specific bacterium and produce a short report on its structure and physiology. Use the lab report page (provided separately) to record specific information about your bacterium. The goal of this investigation is to gain a better understanding of the relationship between specific bacterial structures and their functions.
Here is a list of some of the features you may include in your report. Of course, you will include only those that relate to your chosen bacterial species. Use this list for ideas of what to include.
Bacterial shape
Coccus
Bacillus
Spirillum
Vibrio
Bacterial arrangement
Diplo
Staphylo
Strepto
Bacterial structures
Flagella
Pili or fimbriae
Endospore (capability to form)
Plasmids
Capsule
Gram positive cell wall
Gram negative cell wall
Gram variable cell wall
Bacterial metabolism
Photosynthesis
Chemosynthesis
Methanogenesis
Extremophile
Aerobic respiration
Anaerobic respiration
Fermentation
Methanogenesis
Nitrogen fixation
And if you need help finding an interesting species, here are some websites to check out (although you may certainly find a species on your own).
http://www.bbc.com/earth/story/20150730-ten-bacteria-with-superpowers
https://www.inverse.com/article/11386-ranking-the-top-10-best-bacteria-on-earth
https://www.discovermagazine.com/planet-earth/top-ten-bacteria
Lab Exercise: Protista
Kristin Polizzotto Ph.D., Dmitry Y. Brogun Ph.D., Farshad Tamari Ph.D.
* Figures and text are intended for OER
Objectives:
- Define the term “protist” and explain why this is not a monophyletic group.
- Identify representatives from each supergroup Excavata, ”SAR” clade, Archaeplastida, and Unikonta.
- Draw a phylogenetic tree for the eukaryotes and explain why the eukaryotic supergroups form a polytomy.
- Indicate the position of plants, animals, and fungi on the eukaryote tree, and identify the group of protists most closely related to each.
- Give examples of protist species from each eukaryotic supergroup.
- Give two examples of the significant impact of specific protists on their ecosystems.
Eukaryotic Survey
Introduction: Protists - Who are they?
Protists are a diverse collection of eukaryotic organisms, while exceptions are made, they are fundamentally unicellular, found free-living in all kinds of habitats. The cells are complexly organized with organelles and nuclear envelope membranes. Most protists possess a single nucleus, but some species may have two or more. Despite drastic differences in plant-like and animal-like organelles, they share key features with many organisms that allow them to thrive in reproduction, growth, and survival with common traits found in many complex organisms. They usually reproduce asexually, but sexual reproductive processes are also known to occur between two different mating types mt+ and mt-. However, protists display certain characteristics that allow them to be placed under a different category based on the organelle structure and locomotion (motility). Amoeboids use cytoplasmic projections called pseudopodia; flagellates use flagella; ciliates use cilia, or sporozoans if they lack any motility structures. Understanding the complex history of protists and their evolutionary process is essential for our scientific discourse and discovery. In this part of the lab, we will analyze different protists to identify characteristics correlated with the cell-structure and movement. But there is little else that unifies this group—it is a term used to designate all eukaryotes that are not classified in one of the monophyletic eukaryotic kingdoms. You might ask why biologists have not created monophyletic groups for the protists. This is in fact, the main question that this lab exercise will focus on. As you work through the activities, you will discover for yourself the reasons!
Watch this video on the Paramecium movement: https://youtu.be/mh7KOtQTXrw
Hypothesis: Protists will show diversity due to its morphology and locomotion
From your previous courses, list as many characteristics of eukaryotes as you can in the space below:
Some key definitions
Terms | Definition |
Supergroup | An informal taxonomic level used to group organisms whose phylogeny is uncertain. For example, the eukaryotes are grouped into supergroups at a level that falls between domain and kingdom. |
Clade | A monophyletic group at any taxonomic level (domain or kingdom, but also genus, species, or any other level) |
Taxon | A general term used to designate a group at any taxonomic level (plural: taxa) |
Protist | An informal name for any eukaryote that is not a plant, animal, or fungus. Does not imply monophyly. |
Eukaryote | A microscopic single-celled or multicellular organism that has a nucleus and specialized organelles. Eukaryotes include plants, animals, and fungi. |
Algae | A group of prokaryotic and eukaryotic organisms, usually composed of a single cell or a colony of similar cells and includes the seaweeds. |
Classification and Phylogeny of Protists - Four Eukaryotic Supergroups
The reconstruction of evolution and phylogenetic relationships within the four Eukaryotic supergroups is still an ongoing process. With the new Whole Genome Sequencing (WGS) technologies along with the sequencing of the complete 18S rRNA markers, new members are being added to the supergroups. Not all of the clades within the supergroups are monophyletic, and an example of it is the Stramenopiles. Most of the members have arisen from the primary and secondary endosymbiosis, highlighting the fusion of the photosynthetic bacteria and heterotrophic eukaryotes. The following figure summarizes the phylogeny of Protists depicting the Four Eukaryotic Supergroups (Figure 1).

Four Eukaryotic Supergroups- Excavata,”SAR” clade, Archaeplastida, and Unikonta
Supergroup Excavata
This supergroup consists of several major groups, such as: Diplomonads and Parabasalids, with modified mitochondria, and Euglenozoans including Kinetoplastids and Euglenids, containing spiral or rod inside flagella. Some of the examples of the Diplomonads and Parabasalids include Giardia and Trichomonas. Examples of the Kinetoplastids and Euglenids include Trypanosoma and Euglena.
Example: Euglena & Trypanosoma

Euglena is a flagellated protozoan with a single flagellum used for movement. It strives in nutrient-rich freshwater, except for a few marine species, and it can be found in sewage systems. It is unique like a plant carrying out photosynthesis and if sunlight is not available, it can absorb nutrients from decayed organic material. As in higher plants the chloroplast contains chlorophylls (a and b). There are usually many bright green chloroplasts, although some species are colorless. Euglena is unusual for an alga in that it can lose its chloroplasts when kept in the dark or treated with the antibiotic streptomycin, but it is able to survive as a heterotroph. Thus, this organism has an affinity for both algae and protozoa. For this reason, Euglena is claimed by botanists as an alga, but as a protozoan by zoologists.
Trypanosoma is another example of flagellated Euglenozoa. Trichomonas vaginalis is an example causing vaginal infection and more potent trichomoniasis. Trypanosomes are microscopic, one-celled protozoans of the genus Trypanosoma, of which hundreds of species are known. A trypanosome is long, pointed, and possesses a flagellum. The flagellum arises at the front, or anterior end of the parasite and curves back to form the edge of a long undulating membrane used in locomotion. T. gambiense and T. rhodesiense cause African sleeping sickness and both are transmitted by tsetse flies.
- Supergroup “SAR” Clade (Stramenopiles, Alveolates & Rhizarians)
This supergroup consists of several major groups, such as: Stramenopiles with hairy and smooth flagella, Alveolates containing membrane-enclosed sacs (alveoli) beneath the plasma membrane, and Rhizarians with threadlike pseudopodia. Some of the examples of the Stramenopiles include diatoms, golden and brown algae, and Trichomonas. Examples of the Alveolates include dinoflagellates, Apicomplexans, and Ciliates. Examples of the Rhizarians include Foraminifera and Cercozoans.
- Stramenopiles.
Example Diatoms
Diatoms form a large group known as heterokonts, some are autotrophs (e.g., golden algae, kelp) and the rest are heterotrophs (e.g., water molds). There are more than 200 genera of living diatoms, and it is estimated that there are approximately 100,000 extant species. Diatoms form two hard cell walls (called frustules) composed of silicon oxide. Their chloroplasts contain pigments such as fucoxanthin which gives them yellowish-brown color. Diatoms can be found in saline and hypersaline environments, in freshwater, in soils, and on damp surfaces. Most live-in open water, although some live as surface films at the water-sediment interface, or even under damp atmospheric conditions. They are especially important in oceans, where they are estimated to contribute up to 45% of the total oceanic primary production.

- Alveolates
Example: Apicomplexa, Ciliophora & Tetrahymena

Sporozoans lack locomotion structures. An example is Plasmodium, the genus responsible for malaria (caused by Plasmodium falciparum transmitted via a female Anopheles mosquito vector) in humans and other animals. In humans, the parasite is found intracellularly in red blood cells and is used as a diagnosis of malaria. Another member of this group includes ciliated protozoan Ciliophora that possesses numerous cilia for locomotion. And Paramecium is a unicellular organism found in freshwater throughout the world. It has a stiff outer covering that gives it a permanent slipper shape. It swims rapidly by coordinated wavelike beats of its many cilia: short, hair-like projections of the cell. The paramecium has an external oral groove lined with cilia and leading to a mouth pore and gullet; food is digested in food vacuoles. Paramecium can divide asexually by cell division called “binary fission”. Tetrahymena is a ciliated protozoan with an oral apparatus used for feeding on bacteria. The organism swims by means of rows of cilia arranged longitudinally over the surface of the organism. The organism has two nuclei in the cell that perform different functions. Several discoveries in cellular physiology were established by studying this organism.
Rhizarians
The widespread foraminiferans and radiolarians are amoeboid protozoa, both striving in the marine environment. They contribute to the ocean sediments significantly from their external shells made up of either CaCO3 or silica, respectively. They possess slender, thread-like pseudopodia for locomotion. Members of the phylum Actinopoda also use slender pseudopodia for locomotion. These organisms differ from the Foraminifera in the composition of the shells that surround them. In the Actinopoda, the shells are made of silica, the same material in glass.
Supergroup Archaeplastida
This supergroup includes a large group of algae, specifically the green algae from which higher plants have emerged. This supergroup consists of several major groups, such as red algae that contain phycoerythrin (photosynthetic pigment), green algae with plant-type chloroplasts, and land plants (discussed in later labs). The microscopic green algae include unicellular as well as various colonial, coccoid, and filamentous forms of flagellates (usually with two flagella per cell), that all contain chloroplasts. Genera within the green algae include Euglena, Chlamydomonas, Volvox, Ulothrix, and Spirogyra.

There are about 6000 species of green algae; many species live most of their lives as single-cells, other species form colonies or long filaments. Algae employ simple reproductive structures and lack the extensive vascular structures characteristic of higher plants. Eukaryote organisms are capable of oxygenic photosynthesis. They are classified into different groups on the basis of morphology, types of chlorophylls, carbon reserve storage materials, cell wall composition, and habitat. Although many algae, like the higher plants, are non-motile, they may have motile reproductive cells.

This organism usually exists in a haploid stage, having just one copy of each chromosome (like a mammalian gamete). When mating type plus (mt+) and minus (mt-) meet (Figure 6A), flagellar adhesion and gamete activation are initiated (Figure 6B). They join their cytoplasm (plasmogamy) and their nuclei fuse (karyogamy) to form a diploid zygote (Figure 6C). The zygote is the only diploid cell stage in the life cycle, and it eventually undergoes meiosis to form a tetrad, germinating to form four new Chlamydomonas cells, two mt+ and two mt- following the Mendelian genetics. (Figure 6D). When vegetative cells are grown in a nitrogen-free growth medium, Chlamydomonas cells undergo gametogenesis and develop into gametes (Figure 6A).
Supergroup Unikonta
This supergroup consists of several major groups, such as Amoebozoans, with the lobe-shaped or tube-shaped pseudopodia, and highly variable Opisthokonts. Some examples of the Amoebozoans include Amoeba and Dictyostelium (slime molds). Examples of the Opisthokonts include choanoflagellates, animals, and fungi (discussed in future labs). This group consists of amoeboid protozoa that use pseudopodia for locomotion. Examples include amoebae (Entamoeba histolytica is the cause of amoebiasis) that do not have an outer covering on the pseudopodia (naked) or have a protein or mineral coating over the pseudopodia.
Exercises
1. Eukaryote phylogeny
- As you have learned, a group must be monophyletic in order to be considered a kingdom. Watch the video “Kingdom of Protista” from the beginning to 1:10. Based on the tree shown (0:23-0:42), do you think that protists are truly a kingdom? Explain how you know. Write your answers in the lab report.
- Watch the video “Eukaryotic Supergroups” and answer the questions below in your lab report as you go. Use the timestamps given to help you find the answers. The video is just under 9 minutes long.
This video explains that each domain can be divided into subgroups (0:42). Ideally, the next level after the domain is kingdoms, but since these have not been worked out for many eukaryotes, biologists use “supergroups” while the work of classification is in progress.
1:24 This video uses the classification system with five supergroups of eukaryotes, each of which is assumed to form a clade. What does the word “clade” mean?
2:39 Do you agree with the definition “protists are unicellular eukaryotes”? Why or why not? (see also 3:23-3:50 in the video)
4:55 Different biologists make different phylogenetic trees and different supergroups for eukaryotes. Why do you think this is so? (see also 5:11)
5:43 What is the definition of polytomy? (watch until 6:21) Why must the eukaryote tree include polytomy?
6:37 Why is it easier to figure out the evolutionary relationships for the more specific subgroups towards the right in the diagram?
7:30 How can you differentiate among the various supergroups—in other words, how can you tell them apart, according to this video?
8:00 Do you think the method in the previous question will work well for classifying an unknown protist? Why or why not?
8:16 Why does the narrator say that the term algae are not useful? In what way?
2. Classifying protists
- Visit the PondLife website and skim the page Microbes in Motion, which contains 13 short videos. Twelve of these are common protists collected from ponds and marshes right here in NYC. Choose three of these protists (don’t choose the bacteria!). Read the caption and watch the video for each of the three you selected. Then write in your lab report the following for each:
Scientific name: Use the name given on the web page
Classification: Use the tree below, and write the group to which your species belongs
How did you know: List the clues from the caption or video that helped you figure out to which group this species belongs?
- Now let’s bump it up a notch! Watch the video “Meet the Microcosmos” with particular attention to the section on protists (4:34-6:45). Then complete the activities below.
Choose one species from the video (make sure it’s a protist!) and then find out what supergroup it belongs to and why it belongs to that group (in other words, what traits does it have that place it in that group?). Write these answers in your lab report. To find the correct supergroup, you can try to google the name of the protist along with the word “classification” (for example, “Euglena classification”). If that doesn’t work, go to the Tree of Life website and enter the protist’s name into the search box in the upper right corner. If this does not immediately bring up the page for your taxon, click on the name that is closest to your protist on the results page. You can also try clicking on the links for “containing group” on the right-hand side of the page, which will tell you the higher classification for the taxon you are viewing.
Now, answer these two questions in your lab report using what you learned in the video at the indicated timestamps:
- What would be the impact on the world if diatoms suddenly went extinct? (6:10)
- What is the difference between protists and microscopic animals? How can you tell them apart? (6:46) Hint: it’s not size, and it’s not multicellularity. If you need another hint, go back to the first video in today’s lab (Kingdom of Protista) and watch 0:55-1:04 again.
- Now that you have a better idea of what a protist is and how to differentiate it from microscopic animals, let’s test your expertise. Watch the video “Introduction to the Protists” and see if you can find at least two places where the filmmaker mistook an animal for a protist. Can you catch his mistakes? One caveat: I do not mean the animals you see during the first minute of the video (bird, lizard, snake, fish, and humans). The animals that appear later on are tricky—they are microscopic, like many protists, which is why the filmmaker may not have known that they are animals. When you see an organism that you think is an animal, write down the timestamp in your lab report.
Was this easy or difficult? What made it easy or difficult for you? Write your answer in the lab report.
3. Conclusion
In your lab report, summarize what you have learned by answering the following questions.
- How is the classification of protists different from that of other eukaryotes?
- What does the current status of protist classification tell you about their evolution?
- What can you conclude about diversity in the protists? (Is it greater or less than other eukaryotes, for example?)
- What have you learned about the importance of protists in their ecosystems? What important roles do they play?
Lab Report: Protista
Kristin Polizzotto Ph.D., Dmitry Y. Brogun Ph.D., Farshad Tamari Ph.D.
* Figures and text are intended for OER
Click here to access a downloadable version of the lab report.
Exercises
1. Eukaryote phylogeny
- As you have learned, a group must be monophyletic in order to be considered a kingdom. Watch the video “Kingdom of Protista” from the beginning to 1:10. Based on the tree shown (0:23-0:42), do you think that protists are truly a kingdom? Explain how you know. Write your answers in the lab report.
- Watch the video “Eukaryotic Supergroups” and answer the questions below in your lab report as you go. Use the timestamps given to help you find the answers. The video is just under 9 minutes long.
This video explains that each domain can be divided into subgroups (0:42). Ideally, the next level after the domain is kingdoms, but since these have not been worked out for many eukaryotes, biologists use “supergroups” while the work of classification is in progress.
1:24 This video uses the classification system with five supergroups of eukaryotes, each of which is assumed to form a clade. What does the word “clade” mean?
2:39 Do you agree with the definition “protists are unicellular eukaryotes”? Why or why not? (see also 3:23-3:50 in the video)
4:55 Different biologists make different phylogenetic trees and different supergroups for eukaryotes. Why do you think this is so? (see also 5:11)
5:43 What is the definition of polytomy? (watch until 6:21) Why must the eukaryote tree include polytomy?
6:37 Why is it easier to figure out the evolutionary relationships for the more specific subgroups towards the right in the diagram?
7:30 How can you differentiate among the various supergroups—in other words, how can you tell them apart, according to this video?
8:00 Do you think the method in the previous question will work well for classifying an unknown protist? Why or why not?
8:16 Why does the narrator say that the term algae is not useful? In what way?
2. Classifying protists
- Visit the PondLife website and skim the page Microbes in Motion, which contains 13 short videos. Twelve of these are common protists collected from ponds and marshes right here in NYC. Choose three of these protists (don’t choose the bacteria!). Read the caption and watch the video for each of the three you selected. Then write in your lab report the following for each:
Scientific name: Use the name given on the web page
Classification: Use the tree below, and write the group to which your species belongs
How did you know: List the clues from the caption or video that helped you figure out to which group this species belongs?
- Now let’s bump it up a notch! Watch the video “Meet the Microcosmos” with particular attention to the section on protists (4:34-6:45). Then complete the activities below.
Choose one species from the video (make sure it’s a protist!) and then find out what supergroup it belongs to and why it belongs to that group (in other words, what traits does it have that place it in that group?). Write these answers in your lab report. To find the correct supergroup, you can try to google the name of the protist along with the word “classification” (for example, “Euglena classification”). If that doesn’t work, go to the Tree of Life website and enter the protist’s name into the search box in the upper right corner. If this does not immediately bring up the page for your taxon, click on the name that is closest to your protist on the results page. You can also try clicking on the links for “containing group” on the right-hand side of the page, which will tell you the higher classification for the taxon you are viewing.
Now, answer these two questions in your lab report using what you learned in the video at the indicated timestamps:
- What would be the impact on the world if diatoms suddenly went extinct? (6:10)
- What is the difference between protists and microscopic animals? How can you tell them apart? (6:46) Hint: it’s not size, and it’s not multicellularity. If you need another hint, go back to the first video in today’s lab (Kingdom of Protista) and watch 0:55-1:04 again.
- Now that you have a better idea of what a protist is and how to differentiate it from microscopic animals, let’s test your expertise. Watch the video “Introduction to the Protists” and see if you can find at least two places where the filmmaker mistook an animal for a protist. Can you catch his mistakes? One caveat: I do not mean the animals you see during the first minute of the video (bird, lizard, snake, fish, and humans). The animals that appear later on are tricky—they are microscopic, like many protists, which is why the filmmaker may not have known that they are animals. When you see an organism that you think is an animal, write down the timestamp in your lab report.
Was this easy or difficult? What made it easy or difficult for you? Write your answer in the lab report.
- From your previous courses, list as many characteristics of eukaryotes as you can in the space below.
3. Conclusion
In your lab report, summarize what you have learned by answering the following questions.
- How is the classification of protists different from that of other eukaryotes?
- What does the current status of protist classification tell you about their evolution?
- What can you conclude about diversity in the protists? (Is it greater or less than other eukaryotes, for example?)
- What have you learned about the importance of protists in their ecosystems? What important roles do they play?
Lab Exercise: Fungi
Farshad Tamari, Ph.D.
Figures and text are intended for OER
Objectives:
- Describe fungal classification into phyla, and provide a phylogeny of Kingdom Fungi.
- In a sentence or two, describe the characteristics of the three largest phyla in the Kingdom Fungi (Zygomycota, Ascomycota, Basidiomycota).
- Using images, explain the life cycle of typical multicellular fungi.
- Give three examples of how humans benefit from specific uses of fungi.
I. Fungal Classification and Phylogeny
A. Introduction
The study of fungi is termed mycology. Members of the Kingdom Fungi are eukaryotic organisms, which have characteristics that distinguish them from prokaryotes and from the rest of the eukaryotes. For example, fungi possess nuclei with a nuclear envelope and an endomembranous system that includes the endoplasmic reticulum and Golgi bodies. Fungi exhibit diverse morphological features that have been used in their classification, but all members do share some characteristics. For example, fungi have a cell wall composed of a durable polysaccharide called chitin (also found in arthropod exoskeletons). If not pathogenic, fungi can form symbiotic relationships or act as decomposers. Fungal species may be unicellular (e.g., yeast) or multicellular (e.g., mushrooms). Human fungal infections are called mycoses. Reproduction in fungi may include both sexual and asexual reproduction, although some species reproduce strictly asexually.
For more information, watch the following videos (optional):
Thirty-minute PowerPoint lecture on fungi
Nine-and-a-half minute overview of fungi
B. Some definitions
Terms | Definition |
Symbiosis | A type of ecological interaction in which two species are closely associated, usually temporally and spatially |
Mutualism | A type of symbiosis in which both species involved in the interaction benefit |
Commensalism | A type of symbiosis in which one organism benefits while there is no apparent benefit or disadvantage to the other |
Parasitism | A type of symbiosis in which a pathogen benefits from a host (who is harmed) |
Pathogen | Parasites that can cause disease |
Hyphae | Fungal structures that serve as building blocks in multicellular fungi. Hyphae may be organized into feeding structures called mycelia, or may form a reproductive structure called a fruiting body. |
Plasmogamy | The union between two cell membranes without the union of nuclei |
Heterokaryotic stage | A stage in fungal reproduction that occurs between plasmogamy and karyogamy |
Karyogamy | The union of nuclei in heterokaryotic cells, following plasmogamy and the heterokaryotic stage |
C. Classification/Phylogeny of Fungi
The phylogenetic relationships between the fungal classes are still under investigation. With the sequencing of complete rRNA of many different species, the classification is ever-changing and new phylogenetic trees have been generated based on this data (Tedersoo et al., 2018). The general consensus among phylogeneticists that study Kingdom Fungi is that they form a monophyletic group. The ancestor of the fungi was likely an aquatic organism that resembled a flagellated single-celled protist belonging to the group we currently know as Opisthokonta (Unikonta). Figure 1 summarizes the phylogeny of Kingdom Fungi.
Here are some highlights from each group:
Phylum | Highlight |
Chytridiomycota | The most primitive of the fungi, with approximately 1000 species. They are known for their flagellated spores. |
Zygomycota | They form a freeze-resistant reproductive structure called a zygosporangium. This group also has about 1000 species. |
Glomeromycota | They are known for forming arbuscular mycorrhizae (symbiotic relationships with plant roots). This is the smallest group at only about 160 species strong. |
Ascomycota | Known as sac fungi, they form asci (singular ascus, a sac-like structure), which contain haploid ascospores. This is the biggest group containing some 65,000 species. |
Basidiomycota | Also known as club fungi due to their club-shaped reproductive structures (basidia) containing haploid basidiospores. About 30,000 species strong. Some species are edible. |
D. Life cycle of Fungi
All unicellular fungi (such as yeast) reproduce by asexual, mitotic cell division. Multicellular fungi can reproduce via a combination of sexual and asexual reproduction (Figure 2). The sexual portion of the life cycle begins with two different parent mycelia, which grow from spores. A mycelium is a collection of structures called hyphae (long, branching filaments that increase surface area). In fungi, there are no males and females—only genetically distinct mating types (often designated + and -). Two cells from the different mating types join together, but their nuclei remain separated, each still enclosed by its nuclear envelope. This fusion of two-parent cells is called plasmogamy and results in a cell with two genetically different nuclei. Such cells are called heterokaryotic and may continue to divide and produce daughter cells that also contain two nuclei each. Some fungi remain in this heterokaryotic stage for a long time, but eventually, the nuclei combine to form diploid cells with a set of chromosomes from each parent mycelium. This fusion of the heterokaryotic nuclei into diploid nuclei is called karyogamy and produces a zygote. The zygote undergoes meiosis shortly after karyogamy, forming haploid spores which can then disperse and germinate into new mycelia to continue the life cycle. The asexual part of the life cycle results in the production of haploid spores by mitosis (Figure 2). Approximately 20,000 species of fungi, collectively known as the Deuteromycota, reproduce strictly asexually. Deuteromycota contains species from both Ascomycota and Basidiomycota.
II. Exercises: Fungal Diversity
A. Zygomycota
Rhizopus is a member of the Zygomycota. They are mainly saprotrophic, meaning that they feed on dead organisms, and therefore play a major role in decomposition. Look at the images of Rhizopus below.
- In figure 3, what do you think the black granulation (dots) represent?
- Lookup a common Rhizopus species. What does it grow on?
- What are the functions of each structure in Figure 5?
- Sporangium:
- Stolon:
- Rhizoid:
Watch this optional video on Zygomycota.
B. Ascomycota
Examine the images of Peziza and other ascomycetes below.
- What are the small, oval, green/black structures called in figure 8? (consult the caption for help)
- What is the name of the structure that contains the small, oval, green/black structures?
Some Ascomycota species are opportunistic pathogens of humans. For example, candidiasis (thrush), is caused by the fungus Candida albicans.
Watch the following interesting video on Candidiasis infections and treatment.
Here’s one example of how thrush may look:
C. Basidiomycota
Basidiomycota is the second-largest class of fungi. Collectively they are referred to as the club fungi. Observe examples in the images below.
- Many basidiomycetes are useful to humans as food, but fungi from this phylum and the other phyla have many other uses that are beneficial to humans. Look around your house and find an example of a product that could not be made without a fungus (don’t use mushrooms or other food—find something else!). If you need some ideas, watch this video from National Geographic (3:30) and this video on the uses of fungi (2:21). It’s ok if the fungus you choose is not from Phylum Basidiomycota. Take a photo of the product, copy it into your lab report, and explain how fungi were involved in the item’s production.
D. Imperfect Fungi (Deuteromycota)
Deuteromycota is composed of approximately 20,000 species belonging to the Ascomycota and the Basidiomycota. Observe the images of Penicillium and Alternaria conidia below.
- What is the significance of Penicillium?
E. Mutualistic Fungi
Fungi can form mutualistic relationships with unicellular photosynthetic organisms. These are generally called lichens. Observe the lichens in the figures below:
- Name two types of photosynthetic organisms that can form mutualistic relationships with a fungus to form lichens:
- What does the fungus bring to this mutualistic relationship?
- What does the photosynthetic organism bring to this relationship?
Lab Report: Fungi
Farshad Tamari, Ph.D.
Figures and text are intended for OER
Click here to access a downloadable version of the lab report.
Complete the report by filling in the information below. When you are done, submit your report as a Word doc or pdf (or, if you have printed the document and filled it in by hand, you may take a picture and submit it as a png, jpg, or pdf).
II. Exercises: Fungal Diversity
A. Zygomycota
- In figure 3 of your lab instructions, what do you think the black granulation (dots) represent?
- Lookup a common Rhizopus species. What does it grow on?
- What are the functions of each structure in Figure 5?
- Sporangium:
- Stolon:
- Rhizoid:
B. Ascomycota
- What are the smaller oval (green/black) structures called in figure 8 of your lab instructions? (consult the caption for help)
- What is the name of the thin, transparent structure that contains the smaller oval (green/black) structures?
C. Basidiomycota
- Look around your house and find an example of a product that could not be made without a fungus (don’t use mushrooms or other food—find something else!). If you need some ideas, watch this video from National Geographic (3:30) and this video on the uses of fungi (2:21). It’s ok if the fungus you choose is not from Phylum Basidiomycota. Take a photo of the product, copy it below, and explain how fungi were involved in the item’s production.
D. Imperfect Fungi (Deuteromycota)
- What is the significance of Penicillium?
E. Mutualistic Fungi
- Name two types of photosynthetic organisms that can form mutualistic relationships with a fungus to form lichens:
- What does the fungus bring to this mutualistic relationship?
- What does the photosynthetic organism bring to this relationship?
Lab Exercise: Nonvascular Plants and Seedless Vascular Plants
Kristin Polizzotto, Ph.D.
Figures and text are intended for OER
Objectives:
- Distinguish members of Kingdom Plantae from their nearest relatives (charophyte algae)
- Draw a basic phylogeny for Kingdom Plantae
- Diagram and explain the life cycle of plants (alteration of generations)
- Differentiate the characteristics of nonvascular plants versus seedless vascular plants
- Using images, explain the life cycles of moss (a nonvascular plant) and ferns (a seedless vascular plant)
I. Kingdom Plantae: Origin and Phylogeny
A. Introduction: Evolution, Classification, and Life Cycle
Evolution of Plants
Plants evolved from green algae (Supergroup Archaeplastida) approximately 470-480 million years ago. The nearest living relatives of the plant kingdom are a group of green algae called charophyceans or charophytes (Phylum Charophyta). A common charophyte is a stonewort. They live in freshwater and look like this:
Answer the following questions in your lab report, using information from the reading and videos provided this week in the lecture folder.
1. What evidence supports the relationship between charophytes and plants? In other words, what traits are shared by charophytes and plants?
2. What unique, derived traits evolved in plants to differentiate them from charophytes?
Classification of Plants
Plants can be classified into three basic groups: nonvascular plants, seedless vascular plants, and seed plants. Find each of these groups in this table (also found in your online reading):
Life Cycle of Plants
Study the diagram below, which depicts the general life cycle of plants. As you may know, plants have a life cycle that alternates between a haploid stage, called the gametophyte, and a diploid stage, called the sporophyte. For most plants, we usually see only the sporophyte stage. The gametophyte stage is often tiny and contained deep inside the tissues of the sporophyte stage. Understanding this life cycle is an important tool for understanding the evolution and classification of plants.
Watch this video for an explanation of the “alternation of generations” life cycle, if you need a review. You don’t need to watch the first half of the video—you can start watching at 4:12 and continue to the end (about five minutes total). Refer to the diagram above as you watch, relating the explanations in the video to the diagram.
B. Some key definitions
Terms | Definition |
Alternation of generations | A life cycle that includes a haploid stage alternating with a diploid stage, found in plants, in many multicellular algae, and even in some fungi and animals |
Sporophyte | The multicellular, diploid stage of the life cycle that produces haploid spores by meiosis |
Gametophyte | The multicellular, haploid stage of the life cycle that produces haploid gametes by mitosis |
Sporangium | Tissue or organ that produces spores (plural: sporangia) |
Gametangium | Tissue or organ that produces gametes (plural: gametangia) |
Archegonium | Refers to the female, egg-producing gametangium in multicellular algae and seedless plants |
Antheridium | Refers to the male, sperm-producing gametangium in multicellular algae and seedless plants |
Spore | A unicellular, haploid reproductive structure that germinates to produce the next stage of the life cycle by mitosis (without fertilization). May be surrounded by a protective coating; often capable of dispersion. |
Germination | Mitotic growth of a reproductive structure, such as a seed or a spore, after a period of suspended metabolic activity |
Gamete | Haploid cell that must fuse with another gamete during fertilization to produce a zygote |
Zygote | A single, diploid cell produced by the fusion of two gametes during fertilization |
Meristem | Plant tissue that divides continuously to produce undifferentiated stem cells (and thus, growth) throughout life |
Vascular tissue | Plant tissue in most plants that allows efficient transport of water, nutrients, and other substances |
C. Exercises
Now it’s time to practice what you’ve learned. Complete the activities below.
1. Plant Classification
Fill in the chart below, using the information from this web page (scroll down to the table in the section labeled “Classification”). This will tell you the names of the phyla in each group, as well as the common names for each phylum. To find the characteristics, read this page for nonvascular plants and this page for seedless vascular plants. If you cannot find information for each subgroup, that is ok—just be sure to include characteristics for each of the following groups: nonvascular plants, seedless vascular plants, seed plants, gymnosperms, and angiosperms. The first one is done for you as an example.
For each group, list the PHYLUM names in the blank spaces. | Give the common name for each phylum you listed. | List 1-2 characteristics for each group in the chart. |
I. Non-vascular plants (Bryophytes) | ||
1. Phylum Hepatophyta | Liverworts | No seeds, no vascular tissue, flat, lobed thallus (leaflike structures), gemma cups for asexual reproduction, gametophyte dominant, flagellated sperm |
2. | ||
3. | ||
II. Vascular Plants | ||
Seedless Vascular Plants | ||
1. | ||
2. | ||
Seed Plants | ||
A. Gymnosperms | ||
1. | ||
2. | ||
3. | ||
4 | ||
B. Angiosperms | ||
1. |
2. Plant Kingdom Phylogeny
To show the evolutionary relationships of the major plant groups, we can create a phylogenetic tree, as you have done in earlier labs. For those trees, you used DNA evidence. This week, you will use the characteristics from your table in exercise 1 to determine relatedness and construct a tree. Your tree should include the following groups: nonvascular plants, seedless vascular plants, seed plants, gymnosperms, angiosperms, monocots, and eudicots. Draw your tree in your lab report—use the draw and “insert text box” functions in Word, or draw on a piece of paper and take a photo to insert. Do not copy and paste an image from the internet.
3. Alternation of Generations
Click here to play a game testing your knowledge of the life cycle of plants. IMPORTANT: Click on the button labeled “Press play!” just above the diagram. Do not click on other buttons labeled “start” or “download”—these are ads trying to add an extension to your browser (and it can be hard to remove it). The game should take you about 5-10 minutes. See how fast you can get all the answers correct! Take a screenshot of your best time and paste it into your lab report.
Here’s how the screen should look:

II. Nonvascular Plants
This week we are focusing on nonvascular plants and seedless vascular plants. Click here to review a short summary highlighting the characteristics of nonvascular and seedless vascular plants.
A familiar example of a nonvascular plant is moss, such as the plant shown here:
A. What are the characteristics of nonvascular plants? Record your answers in the lab report.
B. Watch one or more of these short videos on the moss life cycle. Then label the diagram below in your lab report.
Moss Reproduction (1:03)
Roles of antheridia, archegonia, and sporangia in moss (1:10)
Life cycle of a moss (2:46)
Label the diagram using the terms in the box below:
III. Seedless Vascular Plants
A familiar example of a seedless vascular plant is a fern, such as the one pictured below.
Recall the online summary mentioned at the beginning of the previous section. Use it to answer the following question.
A. What are the characteristics of seedless vascular plants? Record your answers in the lab report.
B. Visit this webpage and use the interactive tool explaining the life cycle of a fern. Click on each label to see details of each stage and each structure. Then use the words in the text box below to label the following diagram in your lab report.
Lab report: Nonvascular Plants and Seedless Vascular Plants
Kristin Polizzotto, Ph.D.
Figures and text are intended for OER
Click here to access a downloadable version of the lab report.
I. Kingdom Plantae: Origin and Phylogeny
A. Introduction: Evolution, Classification, and Life Cycle
1. What evidence supports the relationship between charophytes and plants? In other words, what traits are shared by charophytes and plants?
2. What unique, derived traits evolved in plants to differentiate them from charophytes?
C. Exercises
Now it’s time to practice what you’ve learned. Complete the activities below.
1. Plant Classification
Fill in the chart below, using the information from this web page (scroll down to the table in the section labeled “Classification”). This will tell you the names of the phyla in each group, as well as the common names for each phylum. To find the characteristics, read this page for nonvascular plants and this page for seedless vascular plants. If you cannot find information for each subgroup, that is ok—just be sure to include characteristics for each of the following groups: nonvascular plants, seedless vascular plants, seed plants, gymnosperms, and angiosperms. The first one is done for you as an example.
For each group, list the PHYLUM names in the blank spaces. | Give the common name for each phylum you listed. | List 1-2 characteristics for each group in the chart. |
I. Non-vascular plants (Bryophytes) | ||
1. Phylum Hepatophyta | Liverworts | No seeds, no vascular tissue, flat, lobed thallus (leaflike structures), gemma cups for asexual reproduction, gametophyte dominant, flagellated sperm |
2. | ||
3. | ||
II. Vascular Plants | ||
Seedless Vascular Plants | ||
1. | ||
2. | ||
Seed Plants | ||
A. Gymnosperms | ||
1. | ||
2. | ||
3. | ||
4 | ||
B. Angiosperms | ||
1. |
2. Plant Kingdom Phylogeny
To show the evolutionary relationships of the major plant groups, we can create a phylogenetic tree, as you have done in earlier labs. For those trees, you used DNA evidence. This week, you will use the characteristics from your table in exercise 1 to determine relatedness and construct a tree. Your tree should include the following groups: nonvascular plants, seedless vascular plants, seed plants, gymnosperms, and angiosperms. Draw your tree below—use the draw and “insert text box” functions in Word, or draw on a piece of paper and take a photo to insert. Do not copy and paste an image from the internet.
3. Alternation of Generations
Click here to play a game testing your knowledge of the life cycle of plants. IMPORTANT: Click on the button labeled “Press play!” just above the diagram. Do not click on other buttons labeled “start” or “download”—these are ads trying to add an extension to your browser (and it can be hard to remove it). The game should take you about 5-10 minutes. See how fast you can get all the answers correct! Take a screenshot of your best time and paste it below.
II. Nonvascular Plants
II. Nonvascular Plants
A. Click here to review a short summary highlighting the characteristics of nonvascular and seedless vascular plants.
What are the characteristics of nonvascular plants?
1.
2.
3.
4.
5.
B. Watch one or more of these short videos on the moss life cycle. Then label the diagram below in your lab report.
Moss Reproduction (1:03)
Roles of antheridia, archegonia, and sporanigia in moss (1:10)
Life cycle of a moss (2:46)
Label the diagram using the terms in the box below:
III. Seedless Vascular Plants
A. Use the same website posted earlier (and repeated here) to answer the following question.
What are the characteristics of seedless vascular plants?
1.
2.
3.
4.
5.
B. Visit this webpage and use the interactive tool explaining the life cycle of a fern. Click on each label to see details of each stage and each structure. Then use the words in the text box below to label the following diagram.
Lab Exercise: Seed Plants
Farshad Tamari, Ph.D.
Figures and text are intended for OER
Objectives:
- Describe the alternation of generations life cycle in plants
- List characteristics of gymnosperms and angiosperms
- Identify reproductive structures in gymnosperms and angiosperms
- Summarize differences between monocots and eudicots
- Label the reproductive and non-reproductive structures of a flower
I. Introduction
A. Alternation of generations
As you learned in the last lab, plants undergo alternation of generations (Figure 1), which involves a haploid and diploid part of the life cycle. “Higher plants” such as gymnosperms and angiosperms spend less time near water and the majority of their life cycle involves macroscopic diploid (sporophyte) structures. The reproductive structures in both taxa are generally microscopic.

Figure 1: Alternation of generations (credit: F. Tamari). Mega/microsporocyte = Mega/microspore producing mother cells
Watch the following video plant diversity and classification.
Video: https://www.youtube.com/watch?v=X4L3r_XJW0I
B. Some definitions
Terms | Definition |
Alternation of generations | A life cycle defined by alternations between haploidy and diploidy |
Homomorphic spores (homosporous) | A characteristic of seedless plants whereby male and female gametes have similar morphologies |
Heteromorphic spores (heterosporous) | A characteristic of seed plants whereby male and female gametes have different morphologies |
Pollination | Transfer of pollen via wind or another vector (e.g. animal) |
Double fertilization | A characteristic of angiosperms, whereby reproduction involves two independent fertilization events |
Flower | A reproductive structure in angiosperms which produces spores and gametes |
Complete flower | A type of flower in angiosperms that contains both the male and female reproductive structures |
Fruit | A reproductive structure of angiosperms that covers the seed with an additional protective layer |
Table 1: Definitions
C. Classification- Gymnosperms and Angiosperms
Transitions or major evolutionary events (Figure 2 and Table 2) in the plant kingdom have been in part responsible for the success of the plant kingdom and eventually resulted in the evolution of “higher plants”. The first major evolutionary event in the plant kingdom is the development of a vascular system, the xylem and the phloem. Xylem transports water and minerals, while phloem transports carbohydrates. The first transition separates the non-vascular plants from the vascular plants. The second transition is the evolution of the seed and separates the seedless vascular plants from the seed (and therefore by definition vascular) plants (Figure 2 and Table 2).

Figure 2: Plant phylogeny (credits: F. Tamari).
Recent estimates of the total number of plant species place the numbers at >374,000 (Christenhusz and Byng, 2016) to > 450,000 (Prim and Jopp, 2015) species (Table 2).

Table 2: Plant classification (credits: Table, F. Tamari, number of species data from Christenhusz & Byng, 2016, Prim & Jopp, 2015)
1. What are five characteristics of seed plants? The first is easy. They have seeds. Use the readings and videos provided this week to find the answers, and record your answers in the lab report.
a. Seeds
b.
c.
d.
e.
II. Exercises
A. Gymnosperms
Use the links below and your textbook to learn more about seed plants that are gymnosperms:
https://courses.lumenlearning.com/suny-bio2labs/chapter/reading-seed-plants/
Also familiarize yourself with the life cycle of a gymnosperm:
https://www.slideshare.net/CandelaContent/seed-plants-lab (first 6 slides at this point)
Record your answers to the following in the lab report. The definitions are provided in the videos.
1. Define microspore:
2. Define megaspore:
1. Life Cycle
Take a look at the life cycle of a gymnosperm below:

Figure 3: Gymnosperm life cycle. Credit: https://commons.wikimedia.org/wiki/File:Figure_32_01_08.png
3. What do the following pictures (a and b) represent (hint: sexual reproductive structures in gymnosperms)? Record your answers to the following in the report.
a b
2. Reproduction
Gymnosperms are usually wind pollinated. Observe the micrograph below and answer the questions in your lab report.
4. Can you see the pollen grain from the pine? What does it resemble? (describe the shape)
5. What are the germinated structures (arrow) in Figure 4b called?
Figure 4: a (left) Gymnosperm pollen (400) and b (right) Gymnosperm germination (100X). Credit: F. Tamari and Department of Biological Sciences, KCC.
Observe a prepared slide of the pine ovule using high power magnification. Cover the labels, and try to identify all of the structures labeled below.

Figure 5: Pine ovule micrograph. Credit: F. Tamari and Department of Biological Sciences, KCC.
B. Angiosperms
Angiosperms (Anthophyta) are comprised of nearly 300,000 species. Two main angiosperm groups include the monocots and the eudicots (dicots). Table 3 (see next page) summarizes their differences.
Use the links below and your textbook to learn more about seed plants that are angiosperms:
https://courses.lumenlearning.com/suny-bio2labs/chapter/reading-seed-plants/
Also, familiarize yourself with the life cycle of an angiosperm:
https://www.slideshare.net/CandelaContent/seed-plants-lab (slides 7-end at this point)
6. What are the 3 F’s representing angiosperms? Record your answers to the following in the report. The definitions are provided in the videos and in your readings.
a.
b.
c.
1. Monocots vs Eudicots
Among the angiosperms, some 74,273 species are classified as monocots, and some 210,008 species are classified as eudicots (Christenhusz and Byng, 2016). Table 3 summarizes how monocots and eudicots different with respect to six characteristics.

Observe the different prepared slides of sections of monocot (left) and eudicot (right) leaves, stems, and roots (and look at the following micrographs). Do your findings match the content of Table 3?
Figure 6: Cross section of monocot (left) and a eudicot (right) stem showing the organization of vascular tissue. Credit: F. Tamari and Department of Biological Sciences, KCC.
7. Look at the following structures. Determine whether the unknown species is a monocot or a eudicot, and write the answers in your lab report.
a. Species 1: Leaves b. Species 2: Flowers and reproductive structures
c. Species 3: Dissection (x-section) of stem d. Species 4: Pollen
Figure 7: a. Leaves Primula vulgaris, b. Short-styled plant, P. vulgaris, C. Micrograph of dissection of Medicago stem, d. Schematic of monosulcate pollen from an unknown species. Figure credit: F. Tamari
2. Flower Structure
The following page shows a schematic and a real photograph of a flower for a hermaphroditic species (which has complete flowers). Complete flowers will have 1. Sepals, 2. Petals, 3. Stamens (composed of a filament and an anther), and 4. Pistils (also known as carpels and composed of a stigma, a style, and an ovary that contains ovules).
Consult Figure 8 on the next page, and answer the following in your lab report.
8. What do you think the anthers produce?
9. What will you find in the ovary?

Figure 8: Schematic depiction of reproductive organs of a complete flower. Credit: F. Tamari
10. Using your knowledge of flower structure from the videos and the previous figure, label the indicated flower parts in your lab report.
a.
b.
c.
d.
e.
f.

Figure 9: Reproductive and non-reproductive organs of a complete flower from Petunia hybrida. Credit: F. Tamari
3. Angiosperm reproduction
Angiosperm reproduction begins when a pollen grain lands on a stigma. If the pollen belongs to the same species, it usually generates a pollen tube which grows down the transmitting tissue of the style (Tamari and Shore, 2001) and enters the ovule (within the ovary) through the micropyle. Double fertilization occurs resulting in a zygote and the formation of a triploid (3n) endosperm.
Watch the following short video which focuses on angiosperm reproduction.
http://www.sumanasinc.com/webcontent/animations/content/angiosperm.html
Complete the following activity and paste the images into your lab report as indicated.
Locate a flowering plant in your home or neighborhood. Take a picture of the flower and label it using your knowledge of flower parts (refer to Figure 9 above). Identify as many structures as possible.
As you know by now, fruits are the mature ovaries that surround and protect the seeds in flowering plants. This means that many familiar foods that we do not normally think of as fruits are, scientifically speaking, fruits. Some examples of fruits are given in the website referenced earlier (https://courses.lumenlearning.com/suny-bio2labs/chapter/reading-seed-plants/).
Locate a familiar fruit (orange, apple, pear, watermelon, banana, grape, berries). Cut the fruit in the middle—meaning, a transverse cut across the “equator” rather than a sagittal cut from the stem to tip. Try to identify the seeds contained within.
Locate another fruit—this time, choose one that we don’t normally think of as a fruit (tomato, zucchini, squash, nuts, cucumber, peas in a pod). Make a transverse cut and identify the seeds.
Take a photo of the two dissected fruits and label the seeds (if visible). If the fruit is seedless, indicate with an arrow where the seeds would be if they were present. Copy and paste the image(s) into your lab report.
Lab Report: Seed Plants
Farshad Tamari, Ph.D.
Figures and text are intended for OER
Click here to access a downloadable version of the lab report.
I. Introduction
C. Classification- Gymnosperms and Angiosperms
1. What are five characteristics of seed plants? The first is easy. They have seeds. Use the readings and videos provided this week to find the answers, and record your answers in the lab report.
a. Seeds
b.
c.
d.
e.
II. Exercises
A. Gymnosperms
1. Define microspore:
2. Define megaspore:
1. Life Cycle
3. What do the following pictures (a and b) represent (hint: sexual reproductive structures in gymnosperms)? Record your answers to the following in the report.
a b
2. Reproduction
4. Can you see the pollen grain from the pine? What does it resemble? (describe the shape)
5. What are the germinated structures (arrow) in Figure 4b called?
B. Angiosperms
6. What are the 3 F’s representing angiosperms? Record your answers to the following in the report. The definitions are provided in the videos and in your readings.
a.
b.
c.
1. Monocots vs Eudicots
7. Look at the following structures. Determine whether the unknown species is a monocot or a eudicot, and write the answers in your lab report.
a. Species 1: Leaves b. Species 2: Flowers and reproductive structures
c. Species 3: Dissection (x-section) of stem d. Species 4: Pollen
Figure 7: a. Leaves Primula vulgaris, b. Short-styled plant, P. vulgaris, C. Micrograph of dissection of Medicago stem, d. Schematic of monosulcate pollen from an unknown species. Figure credit: F. Tamari
2. Flower Structure
8. What do you think the anthers produce?
9. What will you find in the ovary?
10. Using your knowledge of flower structure from the videos and the previous figure, label the indicated flower parts in your lab report.
a.
b.
c.
d.
e.
f.
Figure 9: Reproductive and non-reproductive organs of a complete flower from Petunia hybrida. Credit: F. Tamari
3. Angiosperm reproduction
Watch the following short video which focuses on angiosperm reproduction.
http://www.sumanasinc.com/webcontent/animations/content/angiosperm.html
For exercise 3 on angiosperm reproduction, paste your image(s) below, as indicated in the instructions for the activity.
Lab Exercise: Animals I - Invertebrates
Azure N. Faucette, Ph.D.
Figures and text are intended for OER
Objectives:
- Distinguish members of the Kingdom Animalia from their closest living relative (Choanoflagellates and Fungi).
- Explain the basic body plan of members in the Kingdom Animalia.
- Identify members of the Phyla Porifera, Cnidaria, Platyhelminthes, Rotifera, Annelida, Mollusca, Nematoda, Arthropoda, Echinodermata.
- Compare two types of invertebrate life cycles.
- Compare the structure and function of invertebrates.
Introduction
Background
Metazoans (animals) evolved over 600 million years ago. Their closest living relative based on molecular and morphological evidence is the choanoflagellates (flagellated protist, Figure 1). The best hypothesis to support the split from their common ancestor is the development of an extracellular matrix and communication junctions. These two features allowed the first metazoans to form cell colonies, which would eventually develop true multicellularity and specific body plans and tissues specialized for movement, nutrition, reproduction, and body support.

Some definitions
Terms | Definition |
Blastocysts | A multicellular structure that forms during the early stage of embryonic development. The cells of this structure will begin to form an inner cell mass that becomes the embryo. |
Gastrulation | A period during embryonic development when the germ layers (endoderm, mesoderm, ectoderm) are formed. |
Coelom | A term used to describe a triploblastic body cavity that develops from the mesoderm. |
Acoelom | A term used to describe triploblasts without a body cavity. |
Pseudocoelom | A term that means "false cavity." This triploblastic cavity is developing from mesoderm and endoderm. |
Mesohyl | The extracellular matrix of the Sponge that houses several cell types. |
Diploblast | Organisms that are derived from two embryonic germ layers (ectoderm and endoderm). |
Triploblast | Organisms that are derived from three embryonic germ layers (ectoderm, mesoderm, and endoderm). |
Hermaphrodite | An organism with a complete or partial set of male and female sex organs or gametes (ova or sperm). Common in simple invertebrates. |
Cephalization | A word associated with the formation of a head. It can also imply the development of a mouth and nervous tissue. |
Exoskeleton | Outer skeleton found in Arthropods. |
Table 1: Definitions
Classification
By looking at a more detailed phylogenetic tree (Figure 2), it can be said the Metazoan clade is very diverse. Some group members have similar morphological features, while simple animals, such as the sponges, Obelia, Hydra, and corals (Figure 3), look similar to plants. Based on morphology, you might begin asking yourself – What separates these simple animals from other eukaryotes you have previously discussed, like plants and fungi? It's simple! Members of this clade lack cell walls.


All animals share similar characteristics that separate them from their closest relative, the Choanoflagellates (Table 2).
Common Characteristics | Description |
Multicellularity | A condition in which an organism is composed of cells that carry out multiple, coordinated functions. In animals, these cells exist in an extracellular matrix composed of collagen fibers. |
Motility | The ability to move in response to a change in the environment (search for food, respond to a change in temperature, and mating) or disperse (larva of sessile animals). |
Heterotrophic | Animals cannot synthesize most organic molecules. Therefore, they have to feed off of the living and/or non-living organic material. |
Sexual reproduction | Most members of the animal kingdom are diploid and reproduce sexually. This means that most of their life cycle will exist in the diploid stage, while only the gametes (sperm and egg) are haploid. However, there are exceptions to this:
|
Table 2: Common characteristics shared between animals. (credits: Table, A. N. Faucette)
Use the following links below to see how animals are further classified.
- General Classification - https://youtu.be/wd-QnKlfZHI * Note: The video goes into the classification of vertebrates also. *
- Body Plans - https://youtu.be/KkzlGMlZW_c
To understand the differentiation between Protostomes and Deuterostomes - https://youtu.be/F2A4yKpTrHs
Check your knowledge:
- Use the information from the above videos to fill in the chart below. If a feature is not a characteristic of a particular phylum, either leave it blank or place a line through it.
Phylum | Motility (sessile or motile) | Type of symmetry (asymmetry, radial symmetry, bilateral symmetry) | Presence of Tissues (none, diploblastic, triploblastic) | Body Cavity (acoelom, pseudocoel, coelom) | Origin of the mouth (Protostome or Deuterostome) |
Porifera | |||||
Cnidarian | |||||
Platyhelminthes | |||||
Rotifera | |||||
Annelida | |||||
Mollusca | |||||
Nematoda | |||||
Arthropoda | |||||
Echinodermata |
Invertebrates
Phylum: Porifera
Use this link (https://courses.lumenlearning.com/boundless-biology/chapter/phylum-porifera/) and watch this video ( https://youtu.be/m8a0oNsDEx8 ) to learn more about the morphology and physiological processes of the Sponge.
Morphology
Simplest of all animals, the Sponge has an asymmetric morphology composed of specialized cells that work together. Though the previous statement is also the biological definition of tissue, the Sponge lacks "true" tissue.
- Why do you think animals in the phyla Porifera lack "true" tissue?
- Name the five shapes mentioned in the video above.
1. | |
2. | |
3. | |
4. | |
5. |
- Fill in the chart below on sponge morphology.
Name of cell | Location | Description/ Morphology | Function |
Choanocytes | |||
Amoebocytes | |||
Pinacocytes (epidermal cells) | |||
Collagenocytes | |||
Porocytes | |||
Sclerocytes |
Physiological Processes
- Label the following diagram (Figure 4) using the following terms. Using arrows, draw the direction in which water flows into and out of the Sponge.
Osculum | Ostia |
Spongocoel | Mesohyl |

- Remember, these are simple organisms; therefore, they lack complex organ systems (digestive, circulatory and respiratory, etc.). How would a sponge carry out the gas exchange, circulation, and excretion?
Reproduction
- Figure 5 is a picture of gemmules, produced as a form of asexual reproduction.
- What are gemmules?
- Why would a sponge produce gemmules?

Phylum: Cnidaria
Use the following link (https://courses.lumenlearning.com/boundless-biology/chapter/phylum-cnidaria/) to learn more about the morphology and physiological processes of cnidarians.
Morphology
Two distinct body plans exist – medusa and polyp.
- Use the reading to draw the following cnidarians. Under each picture, identify the body plan (medusa, polyp, or both) and movement (motile or sessile).
Jellyfish | Hydra | Obelia | |
Body plan | |||
Movement |
All cnidarians have specialized cells called cnidocytes that are located in their tentacles and around their mouth. Cnidocytes contain specialized organelles called nematocysts. Watch the following videos:
Nematocyst - https://youtu.be/BzwCyMCYTz8
Feeding Hydra - https://youtu.be/TfaafxnnJlY
Jellyfish tentacle - https://youtu.be/-Tp38DUjUnM
- Think about how the hydra feeds. What is the benefit of having radial symmetry?
- What is the function of the nematocyst?
- Do you think that the hydra in the video moves with the water, or does the hydra have a nervous system? Explain.
Reproduction
Watch the video on Obelia life cycle (https://youtu.be/ebyJB9Quk-g )
Watch the video on the jellyfish life cycle. (https://youtu.be/fImX8mIB_AQ)
- Label the diagram (Figure 6) below, place your answers in the boxes.

Superphylum Lophotrochozoa
Phylum: Platyhelminthes
Members of this phylum exist as either free-living entities or parasitic. Two platyhelminths we will observe are Planaria and tapeworms. Visit this website to learn more about the members of Platyhelminthes https://courses.lumenlearning.com/suny-bio2labs/chapter/reading-flatworms/
Planaria – free-living platyhelminth
Watch this short video, https://youtu.be/2Ij_wwVo2D4.
- Does the planarian show signs of cephalization? Explain.
- Is the digestive system complete or incomplete?
- If you expose planarians to light, how would they react, and why?
- What is the function of the flame cells?
- What are zooids, and how do they form?
Tapeworm – parasitic platyhelminth
Read about the tapeworm's life cycle on the CDC website (https://www.cdc.gov/parasites/taeniasis/biology.html) and watch this short video about T. saginata https://youtu.be/lWrCHxs_Emg (you do not have to listen to the diagnosis part of the video).
- What is a proglottid?
- Since cattle and pigs are not purposefully eating feces, how would the proglottid find its way into their systems?
- How are humans infected by T. saginata or T. solium?
- What is a scolex?
Phylum: Rotifera
Watch this video of rotifers under the microscope https://youtu.be/FRZ64_lZf_8. Rotifera is unique because they are sexually dimorphic – females are always larger than the males.
- Label the diagram (Figure 7) of the Rotifer.

- Name two modes of motility.
- What is the mastax?
- Describe the function of the corona.
Phyla: Annelida
Familiarize yourself with the Phylum Annelida by reading this short passage https://courses.lumenlearning.com/suny-bio2labs/chapter/reading-annelids/
- Define the following terms.
Hydrostatic skeleton –
Setae –
Clitellum –
Gizzard –
- What is the evolutionary significance of segmentation?
- Describe how earthworms can burrow and move on land without having legs.
Phylum: Mollusca
Watch this video (https://youtu.be/DfUmj4kqUVM ) on the classification of mollusks.
- Mollusks are classified into three main classes: gastropods, bivalves (also called pelecypods in the video), and cephalopods. In the chart below, explain the meaning of the names and describe how each one moves.
Class | Meaning | Locomotion (motility) |
Gastropoda | ||
Bivalvia (Pelecypoda) | ||
Cephalopoda |
- Looking at the picture below (Figure 8), it is safe to say that not all members of this phylum show signs of cephalization. Why do animals in the Class Bivalvia (Pelecypoda) lack cephalization?

Dissection
Watch this squid dissection video (https://youtu.be/vPr9xhlCBfw). As you watch, notice where the organs are located and jot down the structure's functions located in the chart below. Some of the functions can be found in your textbook, as well.
- Fill in the squid anatomy chart. In your answer, indicate how the particular organ size and shape helps the organ fulfill its function.
Organs | Function |
Beak | |
Siphon | |
Buccal mass | |
Pen | |
Brachial Heart | |
Systemic Heart | |
Nidamental Gland |
Superphylum Ecdysozoa
There are two phyla that we will discuss in this superphylum, the Arthropoda and the Nematoda. Briefly read over the information provided in this link (https://courses.lumenlearning.com/boundless-biology/chapter/superphylum-ecdysozoa/), which will help you answer the following questions. In addition, videos will be provided in each section.
Phylum: Nematoda
Watch these videos about nematodes.
Background – https://youtu.be/f0VKGYPPL9k (Disclosure: This video contains sensitive images of parasitic infections in humans. If you are sensitive to graphic visual imagery, do not watch this video past the 3:26 min mark)
Fact and Importance – https://youtu.be/vBWzrlCBhCM
- Define cuticle.
- Define ecdysis.
- Since Nematodes do not possess an exoskeleton like their closest relative, the arthropod discusses why they fall under the superphylum Ecdysozoa?
- Observation of vinegar eel - https://youtu.be/UnjwvtFvyeQ. How would you describe its movement?
Phylum: Arthropoda
Watch the following video on arthropods (https://youtu.be/tNs6MXSk_6Y)
- List the three main characteristics of the arthropod body plan.
1. | |
2. | |
3. |
- What type of circulatory system is present in this phylum?
- List 3 types of respiratory structures found in arthropods.
1. | |
2. | |
3. |
- Why do arthropods molt?
- Label the diagram (Figure 9) using the following terms:
Complete metamorphosis | Pupa | Young nymph |
Larvae | Incomplete metamorphosis | Egg |
Later nymph |

Dissection
Watch these crayfish dissection videos (External Anatomy - https://youtu.be/AOZdmUKoViY and Internal Anatomy - https://youtu.be/0QgB9xNqtGU ) or download and view the interactive PowerPoint here. Students will have to download the file and select “view presentation” or “present” to use the interactive PowerPoint. As you watch, notice where the organs are located and jot down each structure's functions located in the chart below. Some functions can be found in your lab book or reading, as well.
- Fill in the Crayfish anatomy chart. In your answer, indicate how the particular organ size and shape helps the organ fulfill its function.
Organs | Function |
Carapace | |
Walking Legs | |
Swimmerets | |
Maxillipeds | |
Uropod | |
Gastric Mill | |
Antennule | |
Antenna | |
Maxilla |
Superphylum Deuterostomia
Echinodermata
This last phylum will serve as a link between the invertebrates and the vertebrates. Members of this group are more closely related to the Phylum Chordata members than any previous phyla because Chordata and Echinodermata are both deuterostomes. To familiarize yourself with members of this group, read this short passage about Echinodermata - https://courses.lumenlearning.com/boundless-biology/chapter/superphylum-deuterostomia/. You can also watch this video - https://youtu.be/ZS-ce5NnS-g.
- Name 5 Echinoderm classes. (This can be found in the video)
1. | |
2. | |
3. | |
4. | |
5. |
- What type of symmetry is present in the adult?
- What is a water vascular system?
- Let's revisit the video on the differentiation between protostomes and deuterostomes - https://youtu.be/F2A4yKpTrHs. Now compare it to Figure 10.
- Do you see any similarities between what was described and the gastrulas that are present in Figure 10?
- What type of symmetry is present during the larval stage?

Lab Report: Animals I – Invertebrates
Azure N. Faucette, Ph.D.
Figures and text are intended for OER
Click here to access a downloadable version of the lab report.
I. Introduction
Classification: Use the information from the above videos to fill in the chart below. If a feature is not a characteristic of a particular phylum, either leave it blank or place a line through it.
Phylum | Motility (sessile, motile, or both) | Type of symmetry (asymmetry, radial symmetry, bilateral symmetry) | Presence of Tissues (none, diploblastic, triploblastic) | Body Cavity (none, acoelom, pseudocoel, coelom) | Origin of the mouth (N/A, protostome or deuterostome) |
Porifera | |||||
Cnidarian | |||||
Platyhelminthes | |||||
Rotifera | |||||
Annelida | |||||
Mollusca | |||||
Nematoda | |||||
Arthropoda | |||||
Echinodermata |
II. Invertebrates
A. Phylum: Porifera
- Why do you think animals in the phylum Porifera lack "true" tissue?
- Name the five shapes mentioned in the video above.
1. | |
2. | |
3. | |
4. | |
5. |
- Fill in the chart below on sponge morphology.
Name of cell | Location | Description/ Morphology | Function |
Choanocytes | |||
Amoebocytes | |||
Pinacocytes (epidermal cells) | |||
Collagenocytes | |||
Porocytes | |||
Sclerocytes |
Physiological Processes
- Label the following diagram (Figure 4) using the following terms. Using arrows, draw the direction in which water flows into and out of the Sponge.
Osculum | Ostia |
Spongocoel | Mesohyl |

- Remember, these are simple organisms; therefore, they lack complex organ systems (digestive, circulatory and respiratory, etc.). How would a sponge carry out the gas exchange, circulation, and excretion?
Reproduction
- Figure 5 is a picture of gemmules, produced as a form of asexual reproduction.
- What are gemmules?
- Why would a sponge produce gemmules?
B. Phylum: Cnidaria
Morphology
Two distinct body plans exist: medusa and polyp.
- Use the reading to draw the following cnidarians. Under each picture, identify the body plan (medusa, polyp, or both) and movement (motile or sessile).
Jellyfish | Hydra | Obelia | |
Body plan | |||
Movement |
- Think about how the hydra feeds. What is the benefit of having radial symmetry?
- What is the function of the nematocyst?
- Do you think that the hydra in the video moves with the water, or does the hydra have a nervous system? Explain.
Reproduction
- Label the diagram (Figure 6) below, place your answers in the boxes.

Superphylum Lophotrochozoa
C. Phylum: Platyhelminthes
- Does the planarian show signs of cephalization? Explain.
- Is the digestive system complete or incomplete?
- If you expose planarians to light, how would they react, and why?
- What is the function of the flame cells?
- What are zooids, and how do they form?
Tapeworm – parasitic platyhelminth
- What is a proglottid?
- Since cattle and pigs are not purposefully eating feces, how would the proglottid find its way into their systems?
- How are humans infected by T.saginata or T. solium?
- What is a scolex?
D. Phylum: Rotifera
- Label the diagram (Figure 7) of the Rotifer.

- Name two modes of locomotion.
- What is the mastax?
- Describe the function of the corona.
E. Phyla: Annelida
- Define the following terms.
Hydrostatic skeleton –
Setae –
Clitellum –
Gizzard –
- What is the evolutionary significance of segmentation?
- Describe how earthworms can burrow and move on land without having legs.
F. Phylum: Mollusca
- Mollusks are classified into three main classes: gastropods, bivalves (also called pelecypods in the video), and cephalopods. In the chart below, explain the meaning of the names and describe how each one moves.
Class | Meaning | Locomotion (motility) |
Gastropoda | ||
Bivalvia (Pelecypoda) | ||
Cephalopoda |
- Looking at the picture below (Figure 8), it is safe to say that not all members of this phylum show signs of cephalization. Why do animals in the Class Bivalvia (Pelecypoda) lack cephalization?
Dissection
Watch this squid dissection video (https://youtu.be/vPr9xhlCBfw). As you watch, notice where the organs are located and jot down the structure's functions located in the chart below. Some of the functions can be found in your textbook, as well.
- Fill in the squid anatomy chart. In your answer, indicate how the particular organ size and shape helps the organ fulfill its function.
Organs | Function |
Beak | |
Siphon | |
Buccal mass | |
Pen | |
Brachial Heart | |
Systemic Heart | |
Nidamental Gland |
Superphylum Ecdysozoa
G. Phylum: Nematoda
- Define cuticle.
- Define ecdysis.
- Since nematodes do not possess an exoskeleton like their closest relative, the arthropod, why do nematodes fall under the superphylum Ecdysozoa?
- Observation of vinegar eel - https://youtu.be/UnjwvtFvyeQ. How would you describe its movement?
H. Phylum: Arthropoda
- List the three main characteristics of the arthropods.
1. | |
2. | |
3. |
- What type of circulatory system is present in this phylum?
- List three types of respiratory structures found in arthropods.
1. | |
2. | |
3. |
- Why do arthropods molt?
- Label the diagram (Figure 9) using the following terms:
Complete metamorphosis | Pupa | Young nymph |
Larvae | Incomplete metamorphosis | Egg |
Later nymph |
Dissection
- Fill in the Crayfish anatomy chart. In your answer, indicate how the particular organ size and shape helps the organ fulfill its function.
Organs | Function |
Carapace | |
Walking Legs | |
Swimmerets | |
Maxillipeds | |
Uropod | |
Gastric Mill | |
Antennule | |
Antenna | |
Maxilla |
Superphylum Deuterostomia
I. Phylum: Echinodermata
- Name five Echinoderm classes.
1. | |
2. | |
3. | |
4. | |
5. |
- What type of symmetry is present in the adult?
- What is a water vascular system?
- Let's revisit the video on the differentiation between protostomes and deuterostomes - https://youtu.be/F2A4yKpTrHs. Now compare it to Figure 10.
- Do you see any similarities between what was described and the gastrulas that are present in Figure 10?
- What type of symmetry is present during the larval stage?
Lab Exercise: Animals II - Vertebrates
Dmitry Brogun, Ph.D.
Figures and text are intended for OER
Objectives:
- List characteristics found in the Subphylum Vertebrata of Kingdom Animalia
- List characteristics of each of the major tetrapod groups: amphibians, reptiles, birds, mammals; and provide examples of each
- Identify homologous structures in vertebrates, and explain the functions of each structure
- Identify representatives from the eight vertebrate clades, Agnatha, Chondrichthyes, Osteichthyes (comprised of Actinopterygii and Sarcopterygii), Amphibia, Reptilia, Aves, and Mammalia
- Identify and list eleven organ systems in vertebrate animals, their main organs, and provide the major function(s) of each (integumentary, skeletal, muscular, nervous, endocrine, digestive, respiratory, cardiovascular, lymphatic/immune, urinary, & reproductive)
- Compare the life cycles of amphibians and mammals
- Identify structures in dissected specimens of representative vertebrates (frog and fetal pig)
I. Vertebrates
Introduction
In laboratory eight, you learned taxonomy and classification of invertebrate animals. In this laboratory, we will dive deeper into the animal world and learn about some of the organisms that are vertebrates. Animals that belong to the Phylum Chordata, Subphylum Vertebrata (from the Latin word vertebratus, which means 'jointed'), in addition to the notochord, pharyngeal gill slits, a dorsal hollow nerve cord, and a post-anal tail possess a backbone or vertebral column. Currently, over 69,963 species have been classified in the subphylum Vertebrata (ITIS, the Integrated Taxonomic Information System). The reconstruction of taxonomy, evolution, and phylogenetic relationships within the Subphylum Vertebrata is still ongoing. The following figure summarizes the phylogeny of the Phylum Chordata, Subphylum Vertebrata.

Figure 1. Phylogenetic tree depicting vertebrate clades and homologous anatomical features derived from common ancestry. The vertical red bar at the right represents Subphylum Vertebrata. (Credit Dr. Dmitry Y. Brogun, anatomical features ITIS, the Integrated Taxonomic Information System).
👉 Looking at the phylogenetic tree above, please list all of the anatomical characteristics in each of the vertebrate clades in the table below. The traits are indicated on the branches of each new clade.
Clade name | Anatomical characteristic/s |
Petromyzontidae | Vertebrae |
II. Vertebrate survey
Overview and Hypothesis
This exercise is designed to familiarize you with different clades of vertebrates. You will find an example of animals from each of the various clades.
👉 Preliminary hypothesis: All vertebrates share common ancestry due to the presence of homologous structures. All vertebrates are deuterostomes. They undergo radial and indeterminate cleavage, have enterocoelous coelom formation, and the anus develops from the blastopore. Table 1 below summarizes eight clades of vertebrates that have representatives alive today (lampreys, cartilaginous fishes, bony fishes, amphibians, reptiles, birds, and mammals). One additional class (not included below) is completely extinct (armored fishes).
👉 Using the ITIS, the Integrated Taxonomic Information System (https://www.itis.gov/), please find an example for each of the clades.
Clades | Common name | Example (Genus species) |
Petromyzontida | Jawless fishes | |
Chondrichthyes | Cartilaginous fishes | |
Actinopterygii (Osteichthyes) | Ray-finned bony fishes | |
Sarcopterygii (Osteichthyes) | Lobe-finned bony fishes | |
Amphibia | Amphibians | |
Reptilia | Reptiles | |
Aves | Birds | |
Mammalia | Mammals |
Table 1: Eight vertebrate clades. (credits: Table, Credit. Dr. Dmitry Y. Brogun, taxonomy, and classification ITIS, the Integrated Taxonomic Information System).
Definitions
Terms | Definition |
Vertebrate | An animal that has a backbone or spinal column, including mammals, birds, reptiles, amphibians, and fishes |
Deuterostome | An animal in which anus develops first from the blastopore |
Fertilization | A fusion of haploid gametes, egg (n) and sperm (n), to form the diploid (2n) zygote |
Cleavage | Mitotic divisions of a fertilized egg cell |
Blastula | An animal embryo at the early stage of development when it is a hollow ball of cells |
Gastrula | An embryo at the stage following the blastula, when it is a hollow cup-shaped structure having three germ layers of cells (ectoderm, mesoderm, and ectoderm) |
Metamorphosis | An additional development that includes a significant transformation of an animal after birth or hatching |
Oviparous | The females lay eggs that hatch outside the mother's body |
Ovoviviparous | The female retains the fertilized eggs but does not nourish them, and young are born alive |
Viviparous | The embryo is nourished via a placenta that develops from the yolk sac of the egg |
Mammal | A vertebrate animal that has hair or fur, females secrete milk for the nourishment of the young and give birth to live offspring (viviparous) |
Table 2. Important definitions (Credit: Dr. Dmitry Y. Brogun)
Use the links below and your textbook to learn more about animals that are vertebrates:
Reading: Chordates | Biology II Laboratory Manual (scroll down to the Subphylum Vertebrata - Vertebrates)
Clade: Myxini
Example: Hagfish
Use these links to read about habitat, life cycle, and reproduction of the jawless fishes (Fishes | Biology for Majors II) and watch this video ( https://youtu.be/_8FVpj0p-iU ) to learn more about the morphology and physiological processes of the hagfish.
Morphology
- The general hagfish characteristics are:
- ● Cranium (skull), tongue, thick skin, cartilaginous skeleton, jawless
- ● Blind, undergo direct development with a larval stage, paired limbs absent
- ● Notochord present in the adult
- Hagfish are long, slender, and pinkish and are best known for the large quantities of sticky slime they produce. Hagfish have three accessory hearts, no cerebrum or cerebellum, no jaws or stomach, and will sneeze when their nostrils clog with their slime. Hagfish are almost blind but have well-developed senses of touch and smell. They have four pairs of sensing tentacles arranged around their mouth. The mouth lacks jaws, but a hagfish is equipped with two pairs of tooth-like rasps on the top of a tongue-like projection. Unlike other fish, the hagfish undergo direct development, with no larval stage. The newly hatched young are practically miniature versions of their parents. Young are hermaphroditic at first, bearing both sets of sex organs. Later in life, they will be either male or female but may change sex from season to season. The reconstruction of taxonomy, evolution, and phylogenetic relationships of the clade Myxini within the Subphylum Vertebrata is still ongoing.
- 👉 Name the 3 anatomical characteristics of a hagfish mentioned in the video above.
- _________________________________________
- _________________________________________
- _________________________________________

Figure 2. Hagfish: a) preserved hagfish specimen in a jar (Credit: D.Y. Brogun and Department of Biological Sciences, BC), and b) preserved hagfish dissection preparation (Author: Sturne 18; Attribution: CC BY-SA 4.0).
Clade: Petromyzontida
Example: Lamprey
Use this link to read about habitat, life cycle, and reproduction of the jawless fishes (Fishes | Biology for Majors II) and watch this video ( https://youtu.be/AzZao6SVMyc ) to learn more about the morphology and physiological processes of the lamprey.
Morphology
The general lamprey characteristics are:
● Separate sexes (males and females)
● Mate in an anadromous manner
● The vertebral column (vertebra), cranium (skull), tongue, thick skin, jawless
● Mouth with the keratinous teeth
The earliest fish (jawless Agnatha) appeared about 530 million years ago (mya). They evolved from sessile, filter-feeding ancestors in shallow fresh or brackish water. Their environment was characterized by low salt levels and was at least intermittently oxygen-depleted (hypoxic) (Davenport 2019).
- 👉 Why is the lamprey considered to be a parasite?
👉 Name the 3 anatomical characteristics of a lamprey mentioned in the video above.
- _________________________________________
- _________________________________________
- _________________________________________

A. B.
Figure 3. Lamprey a) preserved lamprey specimen in a jar (Credit: D.Y. Brogun and Department of Biological Sciences, BC), and b) freshly caught lamprey on a piece of paper for scale (Author: Fungus Guy; Attribution: CC BY-SA 3.0).
Clade: Chondrichthyes
Example: cartilaginous fishes - shark
Use this link to read about the shark's evolution (Fishes | Biology for Majors II) and watch this video
( https://youtu.be/QRC7ySD-_BY ) to learn more about the morphology and physiological processes of the sharks.
Morphology
The general shark characteristics are:
● Cartilaginous skeleton
● Teeth not fused to jaws
● No swim bladder
● Intestine with spiral valves
● Placoid scales
● No operculum
● Some ovoviviparous

Figure 4. Shark's jaw. (Credit: D.Y. Brogun and Department of Biological Sciences, BC).
👉 Name the 3 anatomical characteristics of Chondrichthyes mentioned in the video above.
- _________________________________________
- _________________________________________
- _________________________________________
Clade: Osteichthyes (Actinopterygii)
Example: bony fishes - perch
Use this link to read about the habitat, life cycle, and reproduction of the bony fishes (Fishes | Biology for Majors II) and watch this video (https://youtu.be/pNZQEmGp11k ) to learn more about the morphology and physiological processes of the bony fishes.
The bony fishes represent the largest group of vertebrates. There are almost 29,000 species of bony fish found in freshwater and marine environments in the world. They are oviparous animals. They have dermal scales, operculum over gill chamber, mineralized endoskeleton, terminal mouth, swim bladder, median, and paired fins. Yellow perch is a common freshwater fish in North America.
👉 What is the function of a swim bladder?
👉 What is the function of the operculum?
👉 Name the 3 anatomical characteristics of a bony fish mentioned in the video above.
- _________________________________________
- _________________________________________
- _________________________________________

- B. C.
Figure 5: Superclass Osteichthyes; A. Perch anatomy B. Perch skeleton C. Perch (Credit: D.Y. Brogun and Department of Biological Sciences, KCC).
Clade: Amphibia
Example - Frog
Use this link to read about the habitat, life cycle, and reproduction of the amphibians (Amphibians | Biology for Majors II) and learn more about the amphibians' morphology and physiological processes.
Members of the class Amphibia were the first vertebrates to partially live on land. This superclass includes salamanders, toads, caecilians, and frogs. Frogs are ectothermic vertebrates. They have long modified hind legs and short forelegs. They use their paired appendages to aid in movement on land. The respiratory system is characterized by lungs, gills, and a highly vascularized skin and mouth lining. The center of their circulatory system is a three-chambered heart, unlike the two-chambered heart of fish that you just learned from superclass Osteichthyes above. While the frog's skeleton is mostly cartilaginous, yet it consists of a bonier skeletal system, figure 11. The skin is smooth and moist, containing mucous glands, figures 7 & 8.
Depending on the frog species, it needs water or moist conditions to reproduce. Above all, frogs undergo complete metamorphosis, which means that they start as a small tadpole with a tail in the water and turn into an amphibian that can live in water and land with developed organ systems. Female frogs can lay hundreds of eggs in one clutch. However, most of these eggs will not end up as grown adult frogs. Since frogs deposit their eggs in the water, a large number of these eggs get eaten by fish and other predators. The tadpoles that hatch from surviving fertilized eggs become another essential food source for the organisms in the food chain. Eventually, surviving tadpoles undergo metamorphosis to transform into adult frogs. You will learn more about predator and prey interactions, food webs, and food chains during the next two labs. Figure 6 summarizes the frog life cycle.

Figure 6. Life Cycle of a Frog. (Credit: D.Y. Brogun)
👉 Using your knowledge of an animal life cycle, in one paragraph, please describe the life cycle of a frog starting from the adult frog. In your paragraph, refer to figure 6 above. Also, please use the vocabulary listed in Table 2 (on p. 4-5), and make sure to indicate whether the transition of each step is accomplished via mitosis or meiosis.
In this experiment, you will examine the external anatomy, oral cavity, digestive, circulatory, reproductive, urogenital, and nervous systems of a leopard frog. You will identify parts of its external and internal anatomies and make comparisons to the fetal pig/human anatomy.
👉 Through the dissection experiment, will you be able to conclude whether there are similarities between the organ systems of a frog and the organ systems of a human?
👉 What is the binomial nomenclature of the leopard frog (genus and species)?
👉 Please, answer whether the frogs are deuterostomes or protostomes?
Virtual Dissection:
In this experiment, you will examine the external and internal anatomy of the frog. Watch these frog dissection videos (Overview - https://youtu.be/k4PlpB-FZa4, External Anatomy- https://youtu.be/x-uUzBYaUdY, and Internal Anatomy - https://youtu.be/iDRzbRlUzDw ). As you watch, notice where the organs are located and jot down each structure's functions located in the chart below. Some functions can be found in your reading as well.

i. Dorsal view (anterior) ii. Ventral view iii. Dorsal view (posterior)
Figure 7. External anatomy of a leopard frog. (Credit: D.Y. Brogun and Department of Biological Sciences, KCC).

- ii.
Figure 8. External head and mouth anatomy of a leopard frog. (Credit: D.Y. Brogun and Department of Biological Sciences, KCC)
To continue studying the ventral, or front, side up, we use dissection pins to fasten the frog to the rubbery surface of the dissection pan. Using scissors, we can make a superficial cut just left or right of center from the lower abdomen to the lower jaw's tip. We use the pins to pin back the skin on both sides to expose the abdominal muscles. We can then lift the muscle layer and cut through the body wall to expose the internal organs.

i ii iii
Figure 9. Internal anatomy of a leopard frog. (Credit: D.Y. Brogun and Department of Biological Sciences, KCC).

- ii. iii.
Figure 10. Internal anatomy of a leopard frog. (Credit: D.Y. Brogun and Department of Biological Sciences, KCC).
- Locate the spleen and the digestive system's organs (the stomach, small intestine, large intestine, liver, gallbladder, and pancreas).
- Locate the heart and identify the atria, ventricle, and conus arteriosus. Locate the anterior and posterior vena cavae.
- Locate the kidneys, located dorsally in the body cavity.
- This specimen is female, so locate the ovaries. The eggs are expelled into the oviducts. Locate the fat bodies just above the kidneys.

i. ii. iii.
Figure 11. Review of a skeleton, life cycle, and internal anatomy of a leopard frog. (Credit: D.Y. Brogun and Department of Biological Sciences, KCC, BC).
👉 Define the following terms related to the positioning of the frog.
a. Dorsal: __________________________________________________________________________
b. Ventral: _________________________________________________________________________
c. Anterior: _________________________________________________________________________
d. Posterior: ________________________________________________________________________
👉 Without the presence of eggs, how could you tell whether your frog is male or female?
_______________________________________________________________________________________
Using information from the above videos, readings, and Virtual Frog Dissections: Virtual Frog Dissection Kit Version 2.2, https://froggy.lbl.gov/cgi-bin/dissect fill in the chart below.
👉 Fill in the Frog anatomy chart in your lab report based on figures 7 through 10.
Organs | Figure: # Letter: Ex: 7, iii, A | Function |
Eyes |
| |
Stomach |
| |
Tympanic membrane |
| |
Liver |
| |
Gullet |
| |
Oviduct |
| |
Glottis |
| |
Teeth |
| |
Intestine |
| |
Eustachian tube | ||
Egg mass | ||
Fat bodies | ||
Heart | ||
Kidney | ||
Cloaca |
Clade: Reptilia
Example - Lizards
Use this link to read about the habitat, life cycle, and reproduction of the reptiles (Reptiles | Biology for Majors II) and watch this video (https://youtu.be/Gg5qSZLP7bA ) to learn more about the morphology and physiological processes of the reptiles.
The most visible difference between reptiles and amphibians is that reptiles are covered in dry scales or scutes, while amphibians have moist skins.
The general reptilian characteristics are:
● Four Limbs (except for those that are limbless, such as snakes)
● Thermoregulation - Regulates body temperature ectothermically
● Upper jaw loosely attached to the skull
● Teeth loosely attached to the jaw
● Territorial
👉 Name the 3 anatomical characteristics of Class Reptilia mentioned in the video above.
- _________________________________________
- _________________________________________
- _________________________________________
Clade: Aves
Example – Birds
Clade Aves are part of the Class Reptilia.
Use this link to read about the habitat, life cycle, and reproduction of the birds (Birds | Biology II) and watch this video (https://youtu.be/lEgM2fXj_9I ) to learn more about the morphology and physiological processes of the birds.
The general avian characteristics are:
● Adaptations for Flight
○ Furcula (Clavicle) - Wishbone (flexible)
○ Scapula and coracoid: unite at sternum for support
○ Sternum/Keel: attachment of powerful flight (pectoral) muscles
○ Digits modified to wings
○ Fused vertebrae for support
○ Pectoral spindle - Sternum, Keel, Clavicle, and Coracoid
○ Pygostyle support tail feathers
○ Four chamber heart
● Amniotic development
○ Oviparous
● Membranes of amnion remove waste
● Yolk provides food
● Digestion:
○ Crop
● Purpose: partially digest food and regurgitation
○ Gizzard
○ Esophagus
○ Intestines
👉 Name the 3 anatomical characteristics of Class Aves mentioned in the video above.
- _________________________________________
- _________________________________________
- _________________________________________
Clade: Mammalia
Example - Human
Use this link to read about the habitat, life cycle, and reproduction of the mammals (Mammals | Biology for Majors II) and watch this video starting from the 6 min:02 sec (https://youtu.be/kgZRZmEc9j4) to learn more about the morphology and physiological processes of the mammals.
Class Mammalia is characterized by the presence of mammary glands (from Latin mamma "breast"). Females (and sometimes males) produce milk for feeding (nursing) their young, a neocortex (a region of the brain), and fur or hair. Mammals can be divided into three more groups based on how their offspring develop. These three groups are monotremes, marsupials, and the largest group, placental mammals. Monotremes are mammals that lay eggs. The only monotremes that are alive today are the spiny anteater, or echidna, and the platypus. Marsupials have a specialized pouch for the offspring's development. And, placental mammals all bear live offspring, which are nourished before birth in the mother's uterus through a specialized embryonic organ attached to the uterine wall, the placenta. The placenta is derived from the same membranes that surround the embryos in the amniote eggs of reptiles, birds, and monotremes.
👉 Are the monotreme mammals viviparous, ovoviviparous, or oviparous animals? Please explain your answer. (Hint: revisit the Definitions table 2 on pp. 4-5)
The general mammalian characteristics are:
- Endothermy
- Hair or fur on the body
- Mammary glands
- Four chambered hearts
- Sebaceous (oil-secreting glands), sudoriferous (sweat) glands, and scent glands
- Heterodont dentition (different types of teeth)
- Diaphragm
Fetal Pig Dissection
Virtual Exercise Virtual Fetal Pig
Read the Fetal Pig Dissection instructions (Fetal Pig Dissection Lab | Biology II Laboratory Manual)
Watch these Fetal Pig dissection videos (Overview External and Internal Anatomy - https://youtu.be/scGo7ERNznM). As you watch, notice where the organs are located and jot down each structure's functions located in the chart below. Some functions can be found in your lab book or reading as well.
Using information from the above videos, readings, and Virtual Pig Dissections: Virtual Fetal Pig Dissection, fill in the chart below.
👉 Fill in the 11 organ systems and list the organs found within the specific organ system on the anatomy chart below.
Organ System | Organs | The function of the organ system |
|
| |
|
| |
|
| |
|
| |
|
| |
|
| |
👉 Optional Activity - Virtual Microscopy of Each of the Organ Systems
Histology of the mammalian organ systems: Click here to access all Organ Systems
Lab Report: Animals II - Vertebrates
Dmitry Brogun, Ph.D.
Figures and text are intended for OER
Click here to access a downloadable version of the lab report.
I. Introduction
Clade name | Anatomical characteristic/s |
Petromyzontidae | Vertebrae |
👉 Looking at the phylogenetic tree (next page), please list all of the anatomical characteristics in each of the Vertebrate clades in the table below. The traits are indicated on the branches of each new clade.
Figure 1. Phylogenetic tree depicting vertebrate clades and homologous anatomical features derived from common ancestry. The vertical red bar represents Subphylum Vertebrata. (Credit Dr. Dmitry Y. Brogun, anatomical features ITIS, the Integrated Taxonomic Information System).
II. Vertebrate Survey
👉 Using the ITIS, the Integrated Taxonomic Information System (https://www.itis.gov/), please find an example for each of the clades.
Clades | Common name | Example (Genus species) |
Petromyzontidae | Jawless fishes | |
Chondrichthyes | Cartilaginous fishes | |
Actinopterygii (Osteichthyes) | Ray-finned bony fishes | |
Sarcopterygii (Osteichthyes) | Lobe-finned bony fishes | |
Amphibia | Amphibians | |
Reptilia | Reptiles | |
Aves | Birds | |
Mammalia | Mammals |
Table 1: Eight vertebrate clades. (Credit:. Dr. Dmitry Y. Brogun).
C. Clade: Myxini
Example: Hagfish
Use these links to read about habitat, life cycle, and reproduction of the jawless fishes (Fishes | Biology for Majors II) and watch this video ( https://youtu.be/_8FVpj0p-iU ) to learn more about the morphology and physiological processes of the hagfish.
👉 Name the 3 anatomical characteristics of a hagfish mentioned in the video above.
- _________________________________________
- _________________________________________
- _________________________________________
D. Clade: Petromyzontida
Example: Lamprey
Use this link to read about habitat, life cycle, and reproduction of the jawless fishes (Fishes | Biology for Majors II) and watch this video ( https://youtu.be/AzZao6SVMyc ) to learn more about the morphology and physiological processes of the lamprey.
👉 Why is the lamprey considered to be a parasite?
👉 Name the 3 anatomical characteristics of a lamprey mentioned in the video above.
- _________________________________________
- _________________________________________
- _________________________________________
D. Clade: Chondrichthyes
Example cartilaginous fishes - shark
Use this link to read about the shark’s evolution (Fishes | Biology for Majors II) and watch this video
( https://youtu.be/QRC7ySD-_BY ) to learn more about the morphology and physiological processes of the sharks.
👉 Name the 3 anatomical characteristics of Chondrichthyes mentioned in the video above.
- _________________________________________
- _________________________________________
- _________________________________________
E. Clade: Osteichthyes (Actinopterygii)
Example bony fishes – perch
Use this link to read about habitat, life cycle, and reproduction of the bony fishes (Fishes | Biology for Majors II) and watch this video (https://youtu.be/pNZQEmGp11k ) to learn more about the morphology and physiological processes of the bony fishes.
👉 What is the function of a swim bladder?
👉 What is the function of the operculum?
👉 Name the 3 anatomical characteristics of a bony fish mentioned in the video above.
- _________________________________________
- _________________________________________
- _________________________________________
F. Clade: Amphibia
Example - Frog
Use this link to read about habitat, life cycle, and reproduction of the amphibians (Amphibians | Biology for Majors II) to learn more about the morphology and physiological processes of the amphibians.

Figure 6. Life Cycle of a Frog. (Credit: D.Y. Brogun)
👉 Using your knowledge of an animal life cycle, in one paragraph please describe the life cycle of a frog starting from the adult frog. In your paragraph, refer to figure 6 above. Also, please use the vocabulary listed in Table 2 of the Lab Manual (on p. 4-5), and make sure to indicate whether the transition of each step is accomplished via mitosis or meiosis.
👉 Through the dissection experiment, will you be able to conclude whether there are similarities between the organ systems of a frog and the organ systems of a human?
👉 What is the binomial nomenclature of the leopard frog (genus and species)?
👉 Please, answer whether the frogs are deuterostomes or protostomes?
Virtual Dissection:
In this experiment, you will examine the external and internal anatomy of the frog. Watch these frog dissection videos (Overview - https://youtu.be/k4PlpB-FZa4 , External Anatomy- https://youtu.be/x-uUzBYaUdY, and Internal Anatomy - https://youtu.be/iDRzbRlUzDw ). As you watch, notice where the organs are located and jot down the functions for each structure located in the chart below. Some functions can be found in your reading as well.

i. Dorsal view (anterior) ii. Ventral view iii. Dorsal view (posterior)
Figure 7. External anatomy of a leopard frog. (Credit: D.Y. Brogun and Department of Biological Sciences, KCC).

i. ii.
Figure 8. External head and mouth anatomy of a leopard frog. (Credit: D.Y. Brogun and Department of Biological Sciences, KCC)

i ii iii
Figure 9. Internal anatomy of a leopard frog. (Credit: D.Y. Brogun and Department of Biological Sciences, KCC).

- ii. iii.
Figure 10. Internal anatomy of a leopard frog. (Credit: D.Y. Brogun and Department of Biological Sciences, KCC).
👉 Define the following terms related to the positioning of the frog.
a. Dorsal: __________________________________________________________________________
b. Ventral: _________________________________________________________________________
c. Anterior: _________________________________________________________________________
d. Posterior: ________________________________________________________________________
👉 Without the presence of eggs, how could you tell whether your frog is male or female?
_______________________________________________________________________________________
👉 Fill in the Frog anatomy chart based on figures 7 through 10.
Organs | Figure: # Letter: Ex: 7, iii, A | Function |
Eyes |
| |
Stomach |
| |
Tympanic membrane |
| |
Liver |
| |
Gullet |
| |
Oviduct |
| |
Glottis |
| |
Teeth |
| |
Intestine |
| |
Eustachian tube | ||
Egg mass | ||
Fat bodies | ||
Heart | ||
Kidney | ||
Cloaca |
G. Clade: Reptilia
Example - Lizards
Use this link to read about habitat, life cycle, and reproduction of the reptiles (Reptiles | Biology for Majors II) and watch this video (https://youtu.be/Gg5qSZLP7bA ) to learn more about the morphology and physiological processes of the reptiles.
👉 Name the 3 anatomical characteristics of Class Reptilia mentioned in the video above.
- _________________________________________
- _________________________________________
- _________________________________________
H. Clade: Aves
Example – Birds
Clade Aves are part of the Class Reptilia.
Use this link to read about habitat, life cycle, and reproduction of the birds (Birds | Biology II) and watch this video (https://youtu.be/lEgM2fXj_9I ) to learn more about the morphology and physiological processes of the birds.
👉 Name the 3 anatomical characteristics of Class Aves mentioned in the video above.
- _________________________________________
- _________________________________________
- _________________________________________
I. Clade: Mammalia
Example – Fetal pig
Use this link to read about the habitat, life cycle, and reproduction of the mammals (Mammals | Biology for Majors II) and watch this video starting from the 6 min:02 sec (https://youtu.be/kgZRZmEc9j4) to learn more about the morphology and physiological processes of the mammals.
👉 Are the monotreme mammals viviparous, ovoviviparous, or oviparous animals? Please explain your answer. (Hint: revisit the Definitions table 2 on pp. 4-5)
Fetal Pig Dissection - Virtual Exercise Virtual Fetal Pig
Read the Fetal Pig Dissection instructions (Fetal Pig Dissection Lab | Biology II Laboratory Manual)
Watch these Fetal Pig dissection videos (Overview External and Internal Anatomy - https://youtu.be/scGo7ERNznM).
👉 Fill in the 11 organ systems and list the organs that are found within the specific organ system on the anatomy chart below.
Organ System | Organs | The function of the organ system |
|
| |
|
| |
|
| |
|
| |
|
| |
|
| |
👉 Optional Activity - Virtual Microscopy of Each of the Organ Systems
Histology of the mammalian organ systems: Click here to access all Organ Systems
Lab Exercise: Ecology I
Biomes, Population Growth, and Predator-Prey Dynamics
Kristin Polizzotto, Ph.D.
Figures and text are intended for OER
Objectives:
- Identify the characteristics of Earth’s major terrestrial biomes, and describe the impacts humans have had on these biomes.
- Explain the relationships between climate (temperature and precipitation) and terrestrial biome type.
- Apply the concepts of biotic potential and environmental resistance to human population growth.
- Explain the difference between exponential and logistic growth, and define carrying capacity.
- Identify major events that have affected human population growth and explain how they have increased carrying capacity.
- Explain the dynamics in population size in a real-life predator-prey relationship.
- Explain the difference between density-dependent and density-independent factors that affect population growth.
- Interpret real-life predator-prey population data as depicted in a graph.
IMPORTANT: The first two activities in this lab require you to use interactive online tools. If you have trouble with these tools, try using a different browser (Chrome or Firefox is recommended). The third activity is also found online, but it is not an interactive tool, so it should present no technical problems.
I. Biomes
A. Introduction
Biomes are large regions with similar abiotic conditions, which results in broadly similar communities of organisms. For example, tropical rainforests are biomes in regions with warm temperatures year-round and relatively high annual levels of precipitation.
B. Some key definitions
Terms | Definition |
Biome | A large region with specific climate conditions, and particular types of organisms adapted to those conditions |
Climate | The average temperature and precipitation conditions in a given area |
Latitude | A measurement of the distance from the equator |
Species richness | The total number of species in a given area |
Biodiversity | A calculation that includes the total number of species and their relative abundance |
Anthrome | Patterns created by the interaction of humans with the natural biome, such as the urban anthrome or the agricultural anthrome. Also known as “anthropogenic biomes.” |
Disturbance | Any temporary change in environmental conditions that cause a significant change in the ecosystem (e.g., changes in biodiversity). |
Abiotic factors | Environmental factors that do not result from living things, such as precipitation, wind, temperature, soil type, oxygen saturation, salinity, fire, etc. |
Biotic factors | Environmental factors that result from living things, such as competition, predation, and symbiosis. |
C. Activity
In this activity, you will use an interactive website to explore the major terrestrial biomes. On that website, you will click “Launch Interactive” to get to the Biome Viewer and complete the activity. It can be slow to load, and does not work on mobile phones and tablets, so be sure to consult with your instructor if you have difficulties.
Click here for a worksheet to guide you through the activity. The pdf worksheet is clickable and fillable, but first, you must download the pdf, save it on your device, and then open your saved file and enter your answers directly into the pdf to save and submit as your lab report. Alternatively, the worksheet questions are copied in the lab report, if you prefer to use a Word document rather than a pdf.
This activity is one of many educational online activities published by the Howard Hughes Medical Institute.
Here are some tips for this activity:
- Be sure to read the tips section in the worksheet before starting the activity. Try out each tip first to make sure you know where everything is in the interactive tool. If you don’t do this first, you may get frustrated trying to complete the worksheet.
- For #2, fill out the chart for all six biomes yourself (since you are not working with a group).
- For #3, “patterns” means relationships between the two variables (latitude and species richness).
- For #3, the “I wonder” section is where you should indicate what other variables might show patterns.
- For #5c & 5d, to find the number of species not listed as “least concern,” click on the ℹ︎. (information symbol) under “more” in the biome details sidebar on the right, and then choose “wildlife” and click “threat filter” on the left. Then click on “least concern” to deselect it, and the remaining species are all those that are under some kind of threat. The threat levels for each species are determined by the International Union for Conservation of Nature (IUCN).
II. Population Growth
A. Introduction
Changes in population size, density, and other demographic factors are a major focus of ecological research. Such studies include investigation of the biotic and abiotic factors that affect population growth, characterization of growth patterns (e.g., exponential or logistic), as well as the impacts of population growth on ecosystems. In this activity, you will use an online interactive tool to explore the population growth of humans, as well as the impact of human population growth on climate change. Be sure to review the key definitions below before attempting the activity. There is a worksheet to guide you through the activity. A link to the worksheet is provided in section C below.
B. Some key definitions
Terms | Definition |
Population | A group of organisms of the same species in a given area. |
Exponential growth | Population growth that follows an exponential or J-shaped curve. This type of growth may occur in any population as long as resources are sufficient to sustain growth. |
Logistic growth | Population growth initially follows an exponential curve but levels out at a population size that is sustainable with available resources. The curve has an S-shape. |
Carrying capacity | The population size is sustainable in a given environment based on available resources. |
Limiting factors, or environmental resistance | Any factors that limit population growth, such as disease, lack of food, water, or space. |
Biotic potential | The inherent biological potential of all organisms to grow exponentially when resources are unlimited. |
Density | The number of organisms per unit area or per unit volume. |
Density-dependent factors | Limiting factors that have a variable effect depending on population density. For example, contagious disease limits the population more severely the more dense the population. |
Density-independent factors | Limiting factors that have a consistent, invariable effect regardless of population density. For example, temperature change limits population at the same rate regardless of population density. |
C. Activity
This activity is one of many educational online activities published by Biology Corner. Click here to access the pdf worksheet for this activity (or, if you prefer, the same questions are copied below). Be sure to read the instructions on the pdf first. Important: you only need to answer questions 1-13 for this lab. The pdf is clickable and fillable, so you can download the pdf, save it on your device, then open the saved file and enter your answers directly into the pdf and save it to submit as your lab report; or, simply answer the questions directly in your lab report.
III. Predator-Prey Dynamics
A. Introduction
One very interesting area of ecological research is an investigation of the effects that predators and prey have on each other. Predators and prey exert selective pressures on each other, as well as influencing each other’s population size and density. In this activity, we will focus on the effects they have on one another’s population dynamics. There is a document in the link in part C below to guide you through an analysis of actual population data from a study of Arctic foxes and lemmings.
B. Some key definitions
Terms | Definition |
Predator | An organism (usually an animal) that actively hunts other species, which it consumes. |
Prey | An organism (usually an animal) that is hunted and consumed by another species. |
Predation rate | The proportion of prey consumed by predators per unit time. For example, a rate of 0.02/year means that 2% of the population is consumed each year. |
Logarithmic scale | A way to display the data on the x or y axis that permits one to display data over a very wide range. For example, instead of labeling the axis arithmetically in consistent increments (e.g., 1, 2, 3, 4, 5, etc.), the axis may be labeled logarithmically in increments that increase by a standard factor (e.g., 1, 10, 100, 1000, etc.). |
Nonlinear regression | A statistical method used to create a best-fit curve (in other words, an equation) to represent the relationship between two related variables on a graph. Linear regression also does this, but only works when the two variables have a direct and consistent relationship. Nonlinear regression may be used when the two variables may not be directly related, or when other variables may also affect the relationship. When attempting to fit a curve to your data, a good rule of thumb to decide between linear and nonlinear regression is to try linear first. If you cannot find a curve that fits your data well, you may need to use nonlinear regression. |
C. Activity
This activity is one of many educational online activities published by the Howard Hughes Medical Institute. Unlike the previous two activities, this activity does not include an online interactive tool. Instead, click here for a pdf with a graph of predator-prey data excerpted from an actual research study. The pdf provides background information on the research as well as helpful tips for interpreting the data. Learning to correctly interpret data and draw conclusions is a central skill in science. The document is actually the instructor’s guide with potential classroom discussion questions, but you will be answering these questions independently. The pdf is not clickable nor fillable, so you should type or write your answers to the discussion questions on the separate lab report page provided. Be sure to read the Background Information and Interpreting the Graph sections—many of the answers to the discussion questions are found there.
Here are images of the lemming (prey) and the Arctic fox (predator) that were studied in this research:
Lab report: Ecology I
Biomes, Population Growth, and Predator-Prey Dynamics
Figures and text are intended for OER
Click here to access a downloadable version of the lab report.
IMPORTANT: The first two activities in this lab require you to use interactive online tools. If you have trouble with these tools, try using a different browser (Chrome or Firefox is recommended). The third activity is also found online, but it is not an interactive tool, so it should present no technical problems.
I. Biomes
C. Activity
In this activity, you will use an interactive website to explore the major terrestrial biomes. On that website, you will click “Launch Interactive” to get to the Biome Viewer and complete the activity. It can be slow to load, and does not work on mobile phones and tablets, so be sure to consult with your instructor if you have difficulties.
Click here for a worksheet to guide you through the activity. The pdf worksheet is clickable and fillable, but first you must download the pdf, save it on your device, and then open your saved file and enter your answers directly into the pdf to save and submit as your lab report. Alternatively, the worksheet questions are copied in the lab report, if you prefer to use a Word document rather than a pdf.
Here are some tips for this activity:
- Be sure to read the tips section in the worksheet before starting the activity. Try out each tip first to make sure you know where everything is in the interactive tool. If you don’t do this first, you may get frustrated trying to complete the worksheet.
- For #2, fill out the chart for all six biomes yourself (since you are not working with a group).
- For #3, “patterns” means relationships between the two variables (latitude and species richness).
- For #3, the “I wonder” section is where you should indicate what other variables might show patterns.
- For #5c & 5d, to find the number of species not listed as “least concern,” click on the ℹ︎. (information symbol) under “more” in the biome details sidebar on the right, and then choose “wildlife” and click “threat filter” on the left. Then click on “least concern” to deselect it, and the remaining species are all those that are under some kind of threat. The threat levels for each species are determined by the International Union for Conservation of Nature (IUCN).
- Drop the pin on any point in one of the biomes listed in Table 1 below and record the following:
Biome name:
Latitude and longitude:
Temperature range:
Precipitation range:
Species richness:
- Complete the table by dropping a pin in each of the other biomes listed and filling in the requested information.
Biome | Latitude | Species Richness |
Tundra | ||
Boreal Forest | ||
Temperate Deciduous Forest | ||
Desert | ||
Tropical Rainforest | ||
Alpine |

- Based on the information you compiled in the table above, complete the following table.
What pattern do you observe between latitude and species richness? | What conclusion can you draw about the relationship between these two variables? | What questions do you have about the pattern? |
- Change the view to a flat map and turn on the gridlines. Click on the Sahara Desert near the Tropic of Cancer. Click “compare” and select the tropical rain forest biome in Southeast Asia at about the same latitude. Then, answer the following questions:
- How do rainfall and temperature patterns differ between the biomes?
- List the species richness for each biome.
Sahara Desert: ______________ SE Asia Tropical Forest: _____________ - Think about the difference or similarity in species richness between these two biomes. What could account for this difference or similarity?
- Go back to your original biome from question 1. Make sure you are still in flat map view. Change to the Anthrome layer and select the year 2000.
- Select the point in your biome with the highest level of human disturbance. List the Anthromes at this location for each of these years:
- 1700: _________________________ 1800: _________________________ 1900: _________________________ 2000: _________________________
- Briefly summarize how humans have impacted the environment at this location over time. At this location, record the following:
- Anthrome (year 2000): _______________________
- Species Richness: ________________
- # Species NOT listed as “Least Concern”: ___________
- Now select the point in your biome with the lowest level of human disturbance. Ideally, it should be a wilderness area, but as close as possible to the last location. Record the following:
- Anthrome: _______________________
- Species Richness: ________________
- # Species NOT listed as “Least Concern”: ___________
- Summarize the differences in species richness and IUCN status of species between the two locations. Make a claim for how human disturbance could have impacted biodiversity in your biome. Support your claim with evidence.
II. Population Growth
C. Activity
This activity is one of many educational online activities published by Biology Corner. Click here to access the pdf worksheet for this activity (or, if you prefer, the same questions are copied below). Be sure to read the instructions on the pdf first. Important: you only need to answer questions 1-13 for this lab. The pdf is clickable and fillable, so you can download the pdf, save it on your device, then open the saved file and enter your answers directly into the pdf and save it to submit as your lab report; or, simply answer the questions below.
Go to the World Population History website and click “Explore the Map” on the entrance screen. The red and yellow dots represent populations of 1 million.
1. Examine the colored chart at the bottom of the screen. It is divided into five categories. Roll over the icons (right side) to see what five categories are displayed. The first one is Food/Agriculture. List the other four categories below.
2. Each diamond on the chart represents an event that happened. Go to the year 400 and click on the diamond to find out what new technology occurred. A new screen will open with more information. What was this technology and why would it have an impact on population growth?
3. Click on other diamonds to find out impacts on human populations. Complete the chart below with 4 “events” that impacted human growth.
Year | Event | Why did it affect growth? |
4. Use the tool at the bottom to move through time. (slide to right). How did the number of dots on the map change? What areas were the most populated in 1800?
5. You can use the magnifying glass to zoom into areas in the 1990’s and 2000’s. What “people and society” event happened in 1980 that was aimed at population growth?
6. You can use the magnifying glass to zoom into areas in the 1990’s and 2000’s. What agricultural problem occurred in 2006?
7. The timeline makes predictions about the future. What year are they predicting there will be freshwater shortages? Suggest how this shortage may affect the human population
8. The top menu has a button called overlays. Use the dropdown menu to select “Fossil Fuel CO2 Emissions.” What happens to CO2 emissions between 1751 and 2010? How do you know?
9. In the year 2000, which areas had the most CO2 emissions? How do you know?
10. Use the dropdown menu to overlay fertility rate. Move the slider to 1950. What was the average number of children per woman in the US at this time? What was the fertility rate in the year 2000? What do these two numbers tell you about the population of the United States?
Examine the graph shown below: CE = Common Era

11. The graph starts in the year 1 C.E. How many years did it take for the population to reach 1 billion people?
12. It took 123 years to grow from 1 billion to 2 billion people. How long did it take to get from 6 billion to 7
billion people? What does this mean about the rate of population growth?
13. Suggest a reason why the population grew so slowly before the 1800s.
III. Predator-Prey Dynamics
C. Activity
Unlike the previous two activities, this activity does not include an online interactive tool. Instead, click here for a pdf with a graph of predator-prey data excerpted from an actual research study. The document is actually the instructor’s guide with potential classroom discussion questions, but you will be answering these questions independently. The pdf is not clickable nor fillable, so you should type or write your answers to the discussion questions below. Be sure to read the Background Information and Interpreting the Graph sections—many of the answers to the discussion questions are found there.
- What relationship does the graph plot?
- Why did the scientists use a logarithmic scale on the graph’s x-axis?
- Why was a nonlinear regression curve chosen to fit the data?
- What trends do you see in the data? Describe the shape of the plot. What relationship, if any, exists between Arctic fox offspring density and lemming population density? When does Arctic fox offspring density begin to rise? Why doesn’t it begin rising earlier?
- When do offspring numbers begin to level off? Why? Besides prey availability, what factors might limit the density of Arctic fox offspring produced?
- In this study area, lemmings have three additional predators: stoat, snowy owl, and long-tailed skua. How would these predators affect the Arctic fox?
- What is a density-dependent factor in a population? Explain your answer using the relationship between the lemming and the Arctic fox as an example.
- Refute or support the statement: “Lemming density controls the number of Arctic fox young produced in the High Arctic tundra of Greenland.” Use evidence from the graph to support your argument.
- Predict what will happen to the Arctic fox population if lemming density increases above 100 lemmings per hectare. Use evidence to support your argument.
- Why are population “densities” used to illustrate an effect instead of simply reporting total population counts?
Lab Exercise: Ecology 2
Niche, Competition, and Trophic Cascades
Kristin Polizzotto, Ph.D.
Figures and text are intended for OER
Objectives:
- Explore the concept of an ecological niche and the difference between a fundamental niche and a realized niche using an example of two barnacle species competing for the same resource.
- Using the same two competing barnacle species, demonstrate how limiting factors (predation and desiccation tolerance) interact to result in competitive exclusion, resource partitioning, and realized niches.
- Investigate the concept of trophic cascades and explain how a keystone species can indirectly affect the biodiversity and nutrient cycling of an entire ecosystem.
I. Ecological Niche and the Effects of Competition
A. Introduction
An important concept in community ecology is the idea of niche. An ecological niche is defined as the total resources that a species requires for its survival. This includes all the ways in which a species interacts with the abiotic and biotic factors in its environment and is sometimes referred to as its role in the ecosystem in which it lives. Several species in a given ecosystem may compete for the same resources (space, food, etc.), and this interaction may result in either competitive exclusion (the exclusion of one species from the niche) or in resource partitioning (alterations to the niche of each competing species).
B. Some key definitions
Terms | Definition |
Limiting factors, or environmental resistance | Any factors that limit population growth, such as disease, lack of food, water, or space. |
Abiotic factors | Environmental factors that do not result from living things, such as precipitation, wind, temperature, soil type, oxygen saturation, salinity, fire, etc. |
Biotic factors | Environmental factors that result from living things, such as competition, predation, and symbiosis. |
Ecological niche | The total resources that a species requires for its survival. |
Fundamental niche | The total resources that a species may potentially use, if no competition exists |
Realized niche | The total resources that a species actually uses when it must compete with other species for the same resources. |
Competitive exclusion | A possible outcome of competition between two species for the same resource, in which one species eventually outcompetes the other, forcing it to migrate or to become extinct. |
Resource partitioning | A possible outcome of competition between two species for the same resource, in which the species narrow or specialize their niche in order to avoid competition. |
C. Activity
This online activity allows you to explore the outcome of a real-life competition for space between two species. This well-known example involves barnacles, which are sessile marine arthropods that settle permanently on rocks in the intertidal zone. They must remain attached to the rocks to survive, so there is strong competition for limited space. At the same time, there are two other important limiting factors: desiccation (or drying out) during low tide, and predation (being eaten by a snail predator).
This interactive tool allows you to change the variables in the environment (settling rate of barnacles, tidal level, and a number of predators) and then see how those changes affect the competition for space. After trying out the simulation, you will answer the following questions, which are also located in the separate lab report.
- How does changing the tidal level affect the outcome of competition?
- How does changing the number of barnacle larvae affect the outcome of competition? Answer this for each species.
- How does changing the density of predators affect the outcome of competition?
- Does the competition between the barnacles result in competitive exclusion, resource partitioning, or both? Explain your answer and use specific data from the simulation to support your answer.
Click here for the link to the interactive. Be sure to read the tips below before you begin.
Tips for using the interactive tool:
- Read the background information first and review the tutorial carefully before you try the experiment. Otherwise, you’re likely to get pretty confused.
- For the first trial, keep all the variables at the default level (don’t change them yet). For each trial, change only one variable at a time to make it easier to see the effects of each one separately. When you are ready to change the variables, I recommend altering them as follows. This will make it easier to see the effects.
- Tidal change: increase from 3 m to 6 m
- Larvae: increase from 2.5 larvae/ml to 5 larvae/ml
- Thais predators: increase from 3 to 6
- Run each trial at 10x (use the fast forward button to increase the speed)—otherwise it takes too long to get results.
- Run each trial for 15 days (the data counter keeps track of the days for you—watch it and pause when you get to 15).
- Keep track of the results of each trial on a piece of paper. Write down what the picture and the graph tell you at the end of each trial. Use the lab report questions (the 4 questions above) as a guide for what you need to get from your results.
II. Keystone Species and Trophic Cascades
A. Introduction
In many ecosystems, one species may have a disproportionate effect on ecosystem dynamics. For example, the removal of a particular species may cause significant changes in biodiversity and nutrient cycling throughout the ecosystem and may even result in a collapse of the entire system. Depending on the role of this species, it may be called a foundation species, a keystone species, or an ecosystem engineer. Today’s activity focuses on keystone species, whose presence is the “key” to some aspect of ecosystem dynamics. For example, the biodiversity of the entire ecosystem generally decreases dramatically when the keystone species decreases in number or disappears. Such amplified effects are called trophic cascades and may begin at either the top or the bottom levels of the trophic structure.
B. Some key definitions
Terms | Definition |
Keystone species | A species that is not necessarily abundant, but has a disproportionate effect on biodiversity, nutrient cycling, or other key ecosystem processes. |
Foundation species | A species that provide food, shelter, and other resources to many other species in the community. Often a producer, such as the pine trees in an alpine ecosystem. |
Ecosystem engineers | A species that physically alter the environment in such a way as to significantly change the composition of the ecosystem. For example, reef-building corals. |
Trophic cascade | A series of changes in the population sizes of organisms at many different trophic levels, often precipitated by a change in just one species that has many indirect, cascading effects. |
Top-down control | Predators (or other high-level consumers) exert a strong influence on the dynamics of lower trophic levels. |
Bottom-up control | Abiotic resources (or producers) exert a strong influence on the dynamics of higher trophic levels. |
C. Activity
In this online interactive activity, you will predict whether specific organisms have positive or negative effects on other organisms in adjacent trophic levels. You will then trace the indirect effects of this interaction through the rest of the ecosystem, and predict how the ecosystem will change with the removal or addition of a particular species.
Use the “Click and Learn” activity found here to explore the concept of trophic cascades.
When you are finished, answer the 6 questions below. These are also located in the separate lab report. You will notice that similar questions are asked (and answered) in the Click and Learn activity.
- Throughout most of the 1800s, sea otters were hunted to near-extinction all along the Pacific coast of North America. How did this impact those ecosystems?
- How did the diet of each of the following change after the near-extinction of the otters?
Species | Scientific name | Dietary changes |
Glaucous-winged gull | ||
Bald eagle |
- Why did the ecosystem of the Aleutian Islands of Alaska change from grassland to tundra after the introduction of Arctic foxes? Explain the trophic cascade that caused this to occur.
- Why did lakes in the Midwestern US change color after the removal of bass by overfishing? Explain the trophic cascade that caused this to occur.
- Why did the forest disappear after the construction of a dam in Venezuela? (Hint: it is not because the forest was drowned by water.) Explain the trophic cascade that caused this to occur.
- Did the African savanna ecosystem experience more fires or less fires after humans developed a vaccine for rinderpest? Explain the trophic cascade that caused this to occur.
Lab Report: Ecology 2
Kristin Polizzotto, Ph.D.
Figures and text are intended for OER
Click here to access a downloadable version of the lab report.
I. Ecological Niche and the Effects of Competition
C. Activity
- How does changing the tidal level affect the outcome of competition?
- How does changing the number of barnacle larvae affect the outcome of competition? Answer this for each species.
- How does changing the density of predators affect the outcome of competition?
- Does the competition between the barnacles result in competitive exclusion, resource partitioning, or both? Explain your answer and use specific data from the simulation to support your answer.
II. Keystone Species and Trophic Cascades
C. Activity
Answer the following questions based on what you learned in the online interactive activity related to trophic cascades.
- Throughout most of the 1800s, sea otters were hunted to near-extinction all along the Pacific coast of North America. How did this impact those ecosystems?
- How did the diet of each of the following change after the near-extinction of the otters?
Species | Scientific name | Dietary changes |
Glaucous-winged gull | ||
Bald eagle |
- Why did the ecosystem of the Aleutian Islands of Alaska change from grassland to tundra after the introduction of Arctic foxes? Explain the trophic cascade that caused this to occur.
- Why did lakes in the Midwestern US change color after the removal of bass by overfishing? Explain the trophic cascade that caused this to occur.
- Why did the forest disappear after the construction of a dam in Venezuela? (Hint: it is not because the forest was drowned by water.) Explain the trophic cascade that caused this to occur.
- Did the African savanna ecosystem experience more fires or fewer fires after humans developed a vaccine for rinderpest? Explain the trophic cascade that caused this to occur.