Notes
Chapter 1: Nutrition and You
Adapted from: Zimmerman and Snow. “An Introduction to Nutrition” v. 1.0. Accessed on December 4, 2017. https://2012books.lardbucket.org/books/an-introduction-to-nutrition/
Also includes selected sections from: Lindshield, B. L. Kansas State University Human Nutrition (FNDH 400) Flexbook. Accessed on December 4, 2017. goo.gl/vOAnR
As we get started on our journey into the world of health and nutrition, our first focus will be to demonstrate that nutritional science is an evolving field of study, continually being updated and supported by research, studies, and trials.
Sections:
Let’s begin with a story: the story of peptic ulcers and H. pylori.
Peptic ulcers are painful sores in the gastrointestinal tract. Symptoms of peptic ulcers include abdominal pain, nausea, loss of appetite, and weight loss. The cure for this ailment took some time for scientists to figure out. If your grandfather complained to his doctor of symptoms of peptic ulcer, he was probably told to avoid spicy foods, alcohol, and coffee, and to manage his stress. In the early twentieth century, the medical community thought peptic ulcers were caused by what you ate and drank, and by stress.
Image source: https://www.gicare.com/diseases/peptic-ulcer/
In 1915, Dr. Bertram W. Sippy devised the “Sippy diet” for treating peptic ulcers. Dr. Sippy advised patients to drink small amounts of cream and milk every hour in order to neutralize stomach acid. Ultimately, the Sippy diet did not cure peptic ulcers and in the latter 1960s, scientists discovered the diet was associated with a significant increase in heart disease due to its high saturated fat content.
In the 1980s, Australian physicians Barry Marshall and Robin Warren proposed a radical hypothesis — that the cause of ulcers was bacteria that could survive in the acidic environment of the stomach and small intestine1. They met with significant opposition to their hypothesis but they persisted with their research. Their research led to an understanding that the spiral shape of the bacterium Helicobacter pylori (H. pylori) allows it to penetrate the stomach’s mucous lining, where it secretes an enzyme that generates substances to neutralize the stomach’s acidity. This weakens the stomach’s protective mucous, making the tissue more susceptible to the damaging effects of acid, leading to the development of sores and ulcers. H. pylori also prompt the stomach to produce even more acid, further damaging the stomach lining
In 1994, the National Institutes of Health held a conference on the cause of peptic ulcers. There was scientific consensus that H. pylori cause most peptic ulcers and that patients should be treated with antibiotics.
In 1996, the Food and Drug Administration (FDA) approved the first antibiotic that could be used to treat patients with peptic ulcers. Nevertheless, the link between H. pylori and peptic ulcers was not sufficiently communicated to health-care providers. In fact, 75 percent of patients with peptic ulcers in the late 1990s were still being prescribed antacid medications and advised to change their diet and reduce their stress.
In 1997, the Centers for Disease Control and Prevention (CDC), alongside other public health organizations, began an intensive educational campaign to convince the public and health-care providers that peptic ulcers are a curable condition requiring treatment with antibiotics. Today, if you go to your primary physician you will be given the option of taking an antibiotic to eradicate H. pylori from your gut.
The H. pylori discovery was made recently, overturning a theory applied in our own time. The demystification of disease requires the continuous forward march of science, overturning old, traditional theories and discovering new, more effective ways to treat disease and promote health. In 2005, Marshall and Warren were awarded the prestigious Nobel Prize in medicine for their discovery that many stomach ulcers are caused by H. pylori.
A primary goal of this text is to provide you with information backed by nutritional science, and with a variety of resources that use scientific evidence to optimize health and prevent disease. In this chapter, you will see that there are many conditions and deadly diseases that can be prevented by good nutrition. You will also discover the many other determinants of health and disease, how the powerful tool of scientific investigation is used to design dietary guidelines, and recommendations that will promote health and prevent disease.
“The most exciting phrase to hear in science, the one that heralds new discoveries, is not ‘Eureka!’ but ‘That’s funny...’”
- Isaac Asimov (January 2, 1920–April 6, 1992)
References & Links
1Marshall and Warren. “Ulcers — The Culprit Is H. Pylori!” National Institutes of Health, Office of Science Education. Accessed on November 10, 2011. http://science.education.nih.gov/home2.nsf/Educational+ResourcesResource+FormatsOnline+Resources+High+Sc hool/928BAB9A176A71B585256CCD00634489
Your View of Food
Americans are bombarded with television programs that show where to find the best dinners, pizzas, and cakes, and the restaurants that serve the biggest and juiciest burgers. Other programs feature chefs battling to prepare meals, and the top places to burst your belly from consuming atomic chicken wings and deli sandwiches longer than a foot. There are also shows that feature bizarre foods from cultures around the world. How do you use the information from popular network food shows to build a nutritious meal? You don’t — these shows are for entertainment. The construction of a nutritious meal requires learning about which foods are healthy and which foods are not, how foods and nutrients function in your body, and how to use scientific resources. This text is designed to provide you with the information necessary to make sound nutritional choices that will optimize health and help prevent disease.
How do you fill your plate? © Shutterstcock
The word nutrition first appeared in 1551 and comes from the Latin word nutrire, which means, “to nourish.” Today, we define nutrition as the sum of all processes involved in how organisms obtain nutrients, metabolize them, and use them to support all of life’s processes. Nutritional science is the investigation of how an organism is nourished, and incorporates the study of how nourishment affects personal health, population health, and planetary health. Nutritional science covers a wide spectrum of disciplines. As a result, nutritional scientists can specialize in
particular aspects of nutrition such as biology, physiology, immunology, biochemistry, education, psychology, sustainability, and sociology.
Without adequate nutrition, the human body does not function optimally, and severe nutritional inadequacy can lead to disease and even death. The typical American diet is lacking in many ways, from not containing the proper amounts of essential nutrients, to being too speedily consumed, to being only meagerly satisfying. Dietitians are nutrition professionals who integrate their knowledge of nutritional science into helping people achieve a healthy diet and develop good dietary habits. The Academy of Nutrition and Dietetics (AND) is the largest organization of nutrition professionals worldwide and dietitians registered with the AND are committed to helping Americans eat well and live healthier lives. To learn more from the AND’s nutritional advice, visit http://www.eatright.org.
Nutrition, Health, and Disease
Your ability to wake up, to think clearly, to communicate, to hope, to dream, to go to school, to gain knowledge, to go to work, to earn a living, and to do all of the things that you like to do are dependent upon one factor—your health. Good health means you are able to function normally and work hard to achieve your goals in life. In 1946, the World Health Organization (WHO) defined health as “a state of complete physical, mental, and social well-being, and not merely the absence of disease or infirmity.”1
This definition was adopted into the WHO constitution in 1948 and has not been amended since. A triangle is often used to depict the equal influences of physical, mental, and social well- being on health (Figure 1.1).
Figure 1.1 The Health Triangle.
Disease is defined as any abnormal condition affecting the health of an organism, and is characterized by specific signs and symptoms. Signs refer to identifying characteristics of a disease such as swelling, weight loss, or fever. Symptoms are the features of a disease recognized by a patient and/or their doctor. Symptoms can include nausea, fatigue, irritability, and pain. Diseases are broadly categorized as resulting from pathogens (i.e., bacteria, viruses, fungi, and parasites), deficiencies, genetics, and physiological dysfunction. Diseases that primarily affect physical health are those that impair body structure (as is the case with osteoporosis), or functioning (as is the case with cardiovascular disease). The most effective and affordable method of preventing chronic disease starts with optimal nutrition.
Required Web Link
Mission Critical Health - Chronic Disease Nutrition
The foods we eat affect all three aspects of our health. For example, a teen with Type 2 diabetes (a disease brought on by poor diet) is first diagnosed by physical signs and symptoms such as increased urination, thirstiness, and unexplained weight loss. However, research has also found that teens with Type 2 diabetes have impaired thinking and do not interact well with others in school, thereby affecting mental and social wellbeing. Type 2 diabetes is just one example of a physiological disease that affects all aspects of health—physical, mental, and social.
Public Health and Disease Prevention
In 1894, the first congressional funds were appropriated to the US Department of Agriculture (USDA) for the study of the relationship between nutrition and human health. Dr. Wilbur Olin Atwater was appointed as the Chief of Nutrition Investigations and is recognized as the “Father of Nutrition Science” in America.2
Under his guidance, the USDA released the first bulletin to the American public that contained information on the amounts of fat, carbohydrates, proteins, and food energy in various foods. Nutritional science advanced considerably in these early years, but it took until 1980 for the USDA and the US Department of Health and Human Services (HHS) to jointly release the first edition of Nutrition and Your Health: Dietary Guidelines for Americans.
Although wide distribution of dietary guidelines did not come about until the 1980s, many historical events that demonstrated the importance of diet to health preceded their release. Assessments of the American diet in the 1930s led President Franklin D. Roosevelt to declare in his inaugural address on January 20, 1937, “I see one-third of our nation is ill-housed, ill-clad, and ill-nourished.” From the time of Atwater until the onset of the Great Depression nutritional scientists had discovered many of the vitamins and minerals essential for the functioning of the human body. Their work and the acknowledgement by President FDR of the nutritional inadequacy of the American diet evoked a united response between scientists and government leading to the enrichment of flour, the development of school lunch programs, and advancements of nutritional education in this country.
In the latter part of the twentieth century nutritional scientists, public health organizations, and the American public increasingly recognized that eating too much of certain foods is linked to chronic diseases. We now know that diet-related conditions and diseases include hypertension (high blood pressure), obesity, Type 2 diabetes, cardiovascular disease, some cancers, and osteoporosis. These diet-related conditions and diseases are some of the biggest killers of Americans. The HHS reports that unhealthy diets and inactivity cause between 310,000 and 580,000 deaths every single year.3
According to the USDA, eating healthier could save Americans over $70 billion per year and this does not include the cost of obesity, which is estimated to cost a further $117 billion per year. Unfortunately, despite the fact that the prevalence of these diseases can be decreased by healthier diets and increased physical activity, the CDC reports that the federal government spends one thousand times more to treat disease than to prevent it ($1,390 versus $1.21 per person each year).4
In 2010, the new edition of the dietary guidelines identified obesity as the number one nutritional-related health problem in the United States and established strategies to combat its incidence and health consequences in the American population. A 2008 study in the journal Obesity reported that if current trends are not changed, 100 percent of Americans will be overweight or obese in 2048!5
In 2011, the US federal government released a new multimedia tool that aims to help Americans choose healthier foods from the five food groups (grains, vegetables, fruits, dairy, and proteins). The tool, called “Choose MyPlate,” (Figure 1.2) is available at choosemyplate.gov. Whether at home or on-the-go, MyPlate can help you find a healthy eating style that works for you. (Watch Video 1.1).
Figure 1.2 The Federal Government’s New and Improved Tool of Nutritional Communication
Required Video 1.1
The U.S. Department of Agriculture’s Center for Nutrition Policy and Promotion introduces the “MyPlate, MyWins” video series that shows how small changes to what you eat and drink add up.
Rate My Plate Game
References & Links
1World Health Organization. Preamble to the Constitution of the World Health Organization as adopted by the International Health Conference, New York, June 19–July 22, 1946. http://www.who.int/suggestions/faq/en/
2Combs, G.F. “Celebration of the Past: Nutrition at USDA.” J Nutr 124, no. 9 supplement (1994): 1728S–32S. http://jn.nutrition.org/content/124/9_Suppl/1728S.long
3Center for Science in the Public Interest. “Nutrition Policy.” Accessed March 1, 2012. http://www.cspinet.org/nutritionpolicy/nutrition_policy.html#disease
4Combs, G.F. “Celebration of the Past: Nutrition at USDA.” J Nutr 124, no. 9 supplement (1994): 1728S–32S. http://jn.nutrition.org/content/124/9_Suppl/1728S.long
5Wang Y, et al. “Will All Americans Become Overweight or Obese? Estimating the Progression and Cost of the US
Obesity Epidemic.” Obesity 10, no. 16 (October 2008): 2323–30. http://www.nature.com/oby/journal/v16/n10/full/oby2008351a.html
What’s in Food?
The foods we eat contain nutrients. Nutrients are substances required by the body to perform its basic functions. Nutrients must be obtained from diet, since the human body does not synthesize them. Nutrients are used to produce energy, detect and respond to environmental surroundings, move, excrete wastes, respire, (breathe), grow, and reproduce. There are six classes of nutrients required for the body to function and maintain overall health (Figure 1.3). These are carbohydrates, lipids, proteins, water, vitamins, and minerals. Foods also contain non-nutrients that may be harmful (such as cholesterol, dyes, and preservatives) or beneficial (such as antioxidants). Non-nutrient substances in food will be further explored in later chapters.
Image Source: https://i0.wp.com/asc-spacebook.weebly.com/uploads/2/3/0/7/23071160/8313087.jpg.
Figure 1.3 The Six Essential Nutrients.
MACRONUTRIENTS
Nutrients that are needed in large amounts are called macronutrients. There are three classes of macronutrients: carbohydrates, lipids, and proteins (Figure 1.4). These can be metabolically processed into cellular energy. The energy from macronutrients comes from their chemical bonds. This chemical energy is converted into cellular energy that is then utilized to perform work, allowing our bodies to conduct their basic functions. A unit of measurement of food energy is the calorie. On nutrition food labels, the amount given for “calories” is actually
equivalent to each calorie multiplied by one thousand. A kilocalorie (one thousand calories, denoted with a small “c”) is synonymous with the “Calorie” (with a capital “C”) on nutrition food labels. Water is also a macronutrient in the sense that you require a large amount of it, but unlike the other macronutrients it does not yield calories.
Figure 1.4 The Macronutrients: Carbohydrates, Lipids, Protein, and Water.
Carbohydrates
Carbohydrates are molecules composed of carbon, hydrogen, and oxygen in a 1:2:1 ratio. The major food sources of carbohydrates are grains, milk, fruits, and starchy vegetables like potatoes. Non-starchy vegetables also contain carbohydrates, but in lesser quantities.
Carbohydrates are broadly classified into two forms based on their chemical structure: fast- releasing carbohydrates, often called simple sugars, and slow-releasing carbohydrates.
Fast-releasing carbohydrates consist of one or two basic units. Examples of simple sugars include sucrose, the type of sugar you would have in a bowl on the breakfast table, and glucose, the type of sugar that circulates in your blood.
Slow-releasing carbohydrates are long chains of simple sugars that can be branched or unbranched. During digestion, the body breaks down all slow-releasing carbohydrates to simple sugars, mostly glucose. Glucose is then transported to all our cells where it is stored, used to make energy, or used to build macromolecules. Fiber is also a slow-releasing carbohydrate, but it cannot be broken down in the human body and passes through the digestive tract undigested unless the bacteria that inhabit the gut break it down.
In addition to providing energy and serving as building blocks for bigger macromolecules, carbohydrates are essential for proper functioning of the nervous system, heart, and kidneys. As mentioned, glucose can be stored in the body for future use. In humans, the storage molecule of carbohydrates is called glycogen and in plants, it is known as starches. Glycogen and starches are slow-releasing carbohydrates.
Lipids
Lipids are also a family of molecules composed of carbon, hydrogen, and oxygen, but unlike carbohydrates, they are insoluble in water. Lipids are found predominately in butter, oils, meats, dairy products, nuts, and seeds, and in many processed foods. The three main types of lipids are triglycerides (triacylglycerol), phospholipids, and sterols. The main job of lipids is to store energy. Lipids provide more energy per gram than carbohydrates (nine kilocalories per gram of lipids versus four kilocalories per gram of carbohydrates). In addition to energy storage, lipids serve as cell membranes, surround and protect organs, aid in temperature regulation, and regulate many other functions in the body.
Proteins
Molecules composed of chains of amino acid subunits are called proteins. Amino acids in turn, are simple subunits composed of carbon, oxygen, hydrogen, and nitrogen. The food sources of proteins are meats, dairy products, seafood, and a variety of different plant-based foods, most notably soy. The word protein comes from a Greek word meaning “of primary importance,” which is an apt description of these macronutrients. Proteins provide four kilocalories of energy per gram; however, providing energy is not protein’s most important function. Proteins provide structure to bones, muscles and skin, and play a role in conducting most of the chemical reactions that take place in the body. Scientists estimate that greater than one-hundred thousand different proteins exist within the human body.
WATER
There is one other nutrient that we must have in large quantities: water. Water does not contain carbon, but is composed of two hydrogens and one oxygen per molecule of water. More than 60 percent of your total body weight is water. Without it, nothing could be transported in or out of the body, chemical reactions would not occur, organs would not be cushioned, and body temperature would fluctuate widely. According to the “rule of threes,” a generalization supported by survival experts, a person can survive three minutes without oxygen, three days without water, and three weeks without food. Since water is so critical for life’s basic processes, the amount of water input and output is supremely important.
MICRONUTRIENTS
Micronutrients are nutrients required by the body in lesser amounts, but are still essential for carrying out bodily functions. Micronutrients include all the essential minerals and vitamins. There are sixteen essential minerals and thirteen vitamins (See Table 1.1 "Minerals and Their Major Functions" and Table 1.2 "Vitamins and Their Major Functions" for a complete list and their major functions). In contrast to the macronutrients, the micronutrients are not directly used for making energy, but they assist in the process as being part of enzymes (i.e., coenzymes). Enzymes are proteins that catalyze chemical reactions in the body and are involved in all aspects of body functions from producing energy, to digesting nutrients, to building macromolecules. Micronutrients play many roles in the body.
Minerals
Minerals are solid inorganic substances that form crystals and are classified depending on how much of them we need. Trace minerals such as zinc, iron, or iodine are only required in a few milligrams or less per day. While major minerals such as calcium, sodium, and potassium are required in hundreds of milligrams per day. Many minerals are critical for enzyme function, others are used to maintain fluid balance, build bone tissue, synthesize hormones, transmit nerve impulses, contract and relax muscles, and protect against harmful free radicals.
MAJOR MINERALS | MAJOR FUNCTION |
Sodium | Fluid balance, nerve transmission, muscle contraction |
Chloride | Fluid balance, stomach acid production |
Potassium | Fluid balance, nerve transmission, muscle contraction |
Calcium | Bone and teeth health maintenance, nerve transmission, muscle contraction, blood clotting |
Phosphorus | Bone and teeth health maintenance, acid-base balance |
Magnesium | Protein production, nerve transmission, muscle contraction |
Sulfur | Protein production |
TRACE MINERALS | MAJOR FUNCTIONS |
Iron | Carries oxygen, assists in energy production |
Zinc | Protein and DNA production, wound healing, growth, immune system function |
Iodine | Thyroid hormone production, growth, metabolism |
Selenium | Antioxidant |
Copper | Coenzyme and iron metabolism |
Manganese | Coenzyme |
Table 1.1 Minerals and Their Major Functions
Vitamins
Unlike minerals, vitamins are all organic compounds. The thirteen vitamins are categorized as either water-soluble or fat-soluble. The water-soluble vitamins are vitamin C and all the B vitamins. The fat-soluble vitamins are A, D, E, and K. Vitamins are required to perform many functions in the body such as making red blood cells, synthesizing bone tissue, and playing a role in normal vision, nervous system function, and immune system function. Vitamin deficiencies can cause severe health problems. For example, a deficiency in niacin causes pellagra. Until scientists found out that better diets relieved the signs and symptoms of pellagra, many people with the disease ended up in insane asylums awaiting death (Watch Video 1.2). Other vitamins were also found to prevent certain disorders and diseases such as scurvy (vitamin C), night blindness (vitamin A), and rickets (vitamin D).
Required Video 1.2
Pellagra: This video provides a brief history of Dr. Joseph Goldberger’s discovery that pellagra was a diet-related disease.
WATER-SOLUBLE VITAMINS | MAJOR FUNCTIONS |
B1 (thiamine) | Coenzyme, energy metabolism assistance |
B2 (riboflavin) | Coenzyme, energy metabolism assistance |
B3 (niacin) | Coenzyme, energy metabolism assistance |
B5 (pantothenic acid) | Coenzyme, energy metabolism assistance |
B6 (pyroxidine) | Coenzyme, amino acid synthesis assistance |
B7 (biotin) | Coenzyme |
B9 (folate) | Coenzyme, essential for growth |
B12 (cobalamin) | Coenzyme, red blood cell synthesis |
C | Collagen synthesis, antioxidant |
FAT-SOLUBLE VITAMINS | MAJOR FUNCTIONS |
A | Vision, reproduction, immune system function |
D | Bone and teeth health maintenance, immune system function |
E | Antioxidant, cell membrane protection |
K | Bone and teeth health maintenance, blood clotting |
Table 1.2 Vitamins and Their Major Functions
Food Energy
Food energy is measured in kilocalories (kcals), commonly referred to as Calories. This terminology is technically incorrect, but is used so commonly that we will refer to them as calories throughout the course. A kilocalorie is the amount of energy needed to raise 1 kilogram of water 1 degree Celsius. A food’s kilocalories are determined by putting the food into a bomb calorimeter and determining the energy output (energy = heat produced). The link below is to a video of a bomb calorimeter showing how one is used (Watch Video 1.3).
Required Video 1.3
This video shows how a bomb calorimeter can be set up and operated.
https://youtu.be/ohyA9amFfsc
© Science Media Group
Among the nutrients, the amount of kilocalories per gram that each provide are shown below.
Energy (kcal/g) No Energy
Carbohydrates (4) Vitamins
Proteins (4) Minerals
Lipids (9) Water
As can be seen, only carbohydrates, proteins, and lipids provide energy. However, there is another energy source in the diet that is not a nutrient: alcohol. Just to re-emphasize, alcohol is NOT a nutrient! However, it does provide energy. In fact, alcohol provides seven kilocalories per gram.
Image source: https://img.aws.livestrongcdn.com/ls-article-image-673/ds- photo/getty/article/176/192/517043773.jpg
Phytochemicals, Zoochemicals, and Functional Foods
Beyond macronutrients and micronutrients, there is a lot of interest in non-nutritive compounds found in foods that may be either beneficial or detrimental to health.
Phytochemicals
Phytochemicals are compounds in plants (phyto) that are believed to provide health benefits beyond the traditional nutrients. One example is lycopene in tomatoes, which is thought to potentially decrease the risk of some cancers (in particular prostate cancer). Diets rich in fruits and vegetables have been associated with decreased risk of chronic diseases. Many fruits and vegetables are rich in phytochemicals, leading some to hypothesize that phytochemicals are responsible for the decreased risk of chronic diseases. The role that phytochemicals play in health is still in the early stages of research, relative to other areas of nutrition such as micronutrients. The Linus Paulding Institute has a website containing good information on phytochemicals if you are interested in learning more about them (Interactive web link 1.2).
Image source: https://jbenjaminblog.wordpress.com/tag/tomato/
Interactive web link 1.2
Linus Paulding Institute: Phytochemicals http://lpi.oregonstate.edu/infocenter/phytochemicals.html
Zoochemicals
Zoochemicals are the animal equivalent of phytochemicals in plants. They are compounds in animals that are believed to provide health benefits beyond the traditional nutrients that food contains. Hopefully the name is pretty easy to remember because you can find animals at a zoo. Some compounds can be both phytochemicals and zoochemicals. An example of compounds that can be classified as both are the yellow carotenoids lutein and zeaxanthin. Kale, spinach, and corn contain phytochemicals and are good sources of lutein and zeaxanthin. Whereas egg yolks contain zoochemicals and are also a good source of these carotenoids.
Functional Foods
There are a number of definitions of functional foods. Functional foods are generally understood to be a food, or a food ingredient, that may provide a health benefit beyond the traditional nutrients (macro and micronutrients) it contains. Functional foods are often a rich source of a phytochemical or zoochemical, or contain more of a certain nutrient than a normal food.
Food Quality
One measurement of food quality is the amount of nutrients it contains relative to the amount of energy it provides. High-quality foods are nutrient dense, meaning they contain many of the nutrients relative to the amount of calories they provide. Nutrient-dense foods are the opposite of “empty-calorie” foods such as carbonated sugary soft drinks, which provide many calories
and very little, if any, other nutrients. Food quality is additionally associated with its taste, texture, appearance, microbial content, and how much consumers like it.
Food: A Better Source of Nutrients
It is better to get all your micronutrients from the foods you eat as opposed to from supplements. Supplements contain only what is listed on the label, but foods contain many more macronutrients, micronutrients, and other chemicals, like antioxidants that benefit health. While vitamins, multivitamins, and supplements are a $20 billion industry in this country and more than 50 percent of Americans purchase and use them daily, there is no consistent evidence that they are better than food in promoting health and preventing disease. Dr. Marian Neuhouser, associate of the Fred Hutchinson Cancer Research Center in Seattle, says that “…scientific data are lacking on the long-term health benefits of supplements. To our surprise, we found that multivitamins did not lower the risk of the most common cancers and also had no impact on heart disease.”1
References & Links
1Woodward, K. “Multivitamins Each Day Will Not Keep Common Cancers Away; Largest Study of Its Kind Provides Definitive Evidence that Multivitamins Will Not Reduce Risk of Cancer or Heart Disease in Postmenopausal Women.” Fred Hutchinson Cancer Research Center. Center News 16 (February 2009). http://www.fhcrc.org/about/pubs/center_news/online/2009/02/multivitamin_study.html
How to Determine the Health Effects of Food and Nutrients
Similar to the method by which a police detective finally charges a criminal with a crime, nutritional scientists discover the health effects of food and its nutrients by first making an observation. Once observations are made, they come up with a hypothesis, test their hypothesis, and then interpret the results. After this, they gather additional evidence from multiple sources and finally come up with a conclusion on whether the food suspect fits the claim. This organized process of inquiry used in forensic science, nutritional science, and every other science is called the scientific method (Figure 1.5).
Image Source: https://s3-us-west-2.amazonaws.com/courses-images/wp- content/uploads/sites/1931/2017/05/30180407/figure-01-01-05.png
Figure 1.5 The basic steps of the scientific method.
In 1811, French chemist Bernard Courtois was isolating saltpeter for producing gunpowder to be used by Napoleon’s army. To carry out this isolation he burned some seaweed and in the process observed an intense violet vapor that crystallized when he exposed it to a cold surface. He sent the violet crystals to an expert on gases, Joseph Gay-Lussac, who identified the crystal as a new element. It was named iodine, the Greek word for violet. The following scientific record is some of what took place in order to conclude that iodine is a nutrient.1
Image source: http://medicscientist.com/wp-content/uploads/2012/07/GOITERandTHYROIDITIS.jpg
Evidence-Based Approach to Nutrition
It took more than one hundred years from iodine’s discovery as an effective treatment for goiter until public health programs recognized it as such. Although a lengthy process, the scientific method is a productive way to define essential nutrients and determine their ability to promote health and prevent disease. The scientific method is part of the overall evidence- based approach to designing nutritional guidelines.
The Food and Nutrition Board of the Institute of Medicine, a nonprofit, nongovernmental organization, constructs its nutrient recommendations (i.e., Dietary Reference Intakes, or DRI) using an evidence-based approach to nutrition. The same approach is used by the USDA and HHS, which are departments of the US federal government. The USDA and HHS websites are great tools for discovering ways to optimize health; however, it is important to gather nutrition information from multiple resources, as there are often differences in opinion among various scientists and public health organizations. While the new Dietary Guidelines, published in 2010, have been well-received by some, there are nongovernmental public health organizations that are convinced that some pieces of the guidelines may be influenced by lobbying groups and/or the food industry. For example, the Harvard School of Public Health (HSPH) feels the government falls short by being “too lax on refined grains”.2
The guidelines recommend getting at least half of grains from whole grains but according to the HSPH this still leaves too much consumption of refined grains. For a list of reliable sources that advocate good nutrition to promote health and prevent disease using evidence-based science (see Table 1.3 "Web Resources for Nutrition and Health"). In later chapters, we will further discuss distinguishing criteria that will enable you to wade through misleading nutrition information and instead gather your information from reputable, credible websites and organizations. Throughout the course, you are also required to cite credible websites and organizations in your discussion posts.
GOVERNMENTAL WEBSITES | |
US Department of Agriculture | |
USDA Center for Nutrition Policy and Promotion | |
US Department of Health and Human Services | |
Centers for Disease Control and Prevention | |
Food and Drug Administration | |
Healthy People | |
Office of Disease Prevention and Health Promotion | |
Health Canada | |
INTERNATIONAL WEBSITES | |
World Health Organization | |
Food and Agricultural Organization of the United Nations | |
NON-GOVERNMENTAL WEBSITES | |
Harvard School of Public Health | |
Mayo Clinic | |
Linus Pauling Institute | |
American Society for Nutrition | |
American Medical Association | |
American Diabetes Association | |
The Academy of Nutrition and Dietetics | |
Institute of Medicine: Food and Nutrition | |
Dietitians of Canada | |
Table 1.3 Web Resources for Nutrition and Health
Types of Scientific Studies
There are many types of scientific studies that can be used to provide supporting evidence for a particular hypothesis. The various types of studies include epidemiological studies, interventional clinical trials, and randomized clinical interventional trials.
Epidemiological studies are observational studies and are often the front-line studies for public health. The CDC defines epidemiological studies as scientific investigations that define frequency, distribution, and patterns of health events in a population. Thus, these studies describe the occurrence and patterns of health events over time. The goal of an epidemiological study is to find factors associated with an increased risk for a health event, though these sometimes remain elusive. An example of an epidemiological study is the Framingham Heart Study, a project of the National Heart, Lung and Blood Institute and Boston University that has been ongoing since 1948. This study first examined the physical health and lifestyles of 5,209 men and women from the city of Framingham, Massachusetts and has now incorporated data from the children and grandchildren of the original participants. One of the seminal findings of this ambitious study was that higher cholesterol levels in the blood are a risk factor for heart disease.3
Epidemiological studies are a cornerstone for examining and evaluating public health and some of their advantages are that they can lead to the discovery of disease patterns and risk factors for diseases, and they can be used to predict future healthcare needs and provide information for the design of disease prevention strategies for entire populations. Some shortcomings of epidemiological studies are that investigators cannot control environments and lifestyles, a specific group of people studied may not be an accurate depiction of an entire population, and these types of scientific studies cannot directly determine if one variable causes another.
Interventional clinical trial studies are scientific investigations in which a variable is changed between groups of people. When well done, this type of study allows one to determine causal relationships. An example of an interventional clinical trial study is the Dietary Approaches to Stop Hypertension (DASH) trial published in the April 1997 issue of The New England Journal of Medicine. In this study, 459 people were randomly assigned to three different groups; one was put on an average American control diet, a second was put on a diet rich in fruits and vegetables, and the third was put on a combination diet rich in fruits, vegetables, and low-fat dairy products with reduced saturated and total fat intake. The groups remained on the diets for eight weeks. Blood pressures were measured before starting the diets and after eight weeks. Results of the study showed that the group on the combination diet had significantly lower blood pressure at the end of eight weeks than those who consumed the control diet. The
authors concluded that the combination diet is an effective nutritional approach to treat high blood pressure.4 The attributes of high-quality clinical interventional trial studies are:
Randomized clinical interventional trial studies are powerful tools to provide supporting evidence for a particular relationship and are considered the “gold standard” of scientific studies. A randomized clinical interventional trial is a study in which participants are assigned by chance to separate groups that compare different treatments. Neither the researchers nor the participants can choose which group a participant is assigned. However, from their limitations it is clear that epidemiological studies complement interventional clinical trial studies and both are necessary to construct strong foundations of scientific evidence for health promotion and disease prevention.
Other scientific studies used to provide supporting evidence for a hypothesis include laboratory studies conducted on animals or cells. An advantage of this type of study is that they typically do not cost as much as human studies and they require less time to conduct. Other advantages are that researchers have more control over the environment and the number of confounding variables can be significantly reduced. Moreover, animal and cell studies provide a way to study relationships at the molecular level and are also helpful in determining the exact mechanism by which a specific nutrient causes a change in health. The disadvantage of these types of studies are that researchers are not working with whole humans and thus the results may not be relevant. Nevertheless, well-conducted animal and cell studies that can be repeated by multiple researchers and obtain the same conclusion are definitely helpful in building the evidence to support a scientific hypothesis.
Evolving Science
Science is always moving forward, albeit sometimes slowly. One study is not enough to make a guideline or a recommendation or cure a disease. Science is a stepwise process that builds on past evidence and finally culminates into a well-accepted conclusion. Unfortunately, not all scientific conclusions are developed in the interest of human health and it is important to know where a scientific study was conducted and who provided the money. Indeed, just as an air
quality study paid for by a tobacco company diminishes its value in the minds of readers, so does one on red meat performed at a laboratory funded by a national beef association. Science can also be contentious even amongst experts that don’t have any conflicting financial interests. Contentious science is actually a good thing as it forces researchers to be of high integrity, well-educated, well-trained, and dedicated (Watch Video 1.4). It also instigates public health policy makers to seek out multiple sources of evidence in order to support a new policy. Agreement involving many experts across multiple scientific disciplines is necessary for recommending dietary changes to improve health and prevent disease. Although a somewhat slow process, it is better for our health to allow the evidence to accumulate before incorporating some change in our diet.
Required Video 1.4
The Experts Debate: This webcast from March 29, 2011 demonstrates how science is always evolving and how debate among nutrition science experts influences policy decisions. https://youtu.be/KBryEJXSaLk
Nutritional Science Evolution
One of the newest areas in the realm of nutritional science is the scientific discipline of nutritional genetics, also called nutrigenomics. Genes are part of DNA and contain the genetic information that make up all our traits. Genes are codes for proteins and when they are turned “on” or “off,” they change how the body works. While we know that health is defined as more than just the absence of disease, there are currently very few accurate genetic markers of good health. Rather, there are many more genetic markers for disease. However, science is evolving and nutritional genetics aims to identify what nutrients to eat to “turn on” healthy genes and “turn off” genes that cause disease. Eventually this field will progress so that a person’s diet can be tailored to their genetics. Thus, your DNA will determine your optimal diet.
Using Science and Technology to Change the Future
As science evolves, so does technology. Both can be used to create a healthy diet, optimize health, and prevent disease. Picture yourself not too far into the future: you are wearing a small “dietary watch” that painlessly samples your blood, and downloads the information to your cell phone, which has an app that evaluates the nutrient profile of your blood and then recommends a snack or dinner menu to assure you maintain adequate nutrient levels. What else is not far off? How about another app that provides a shopping list that adheres to all dietary guidelines and is emailed to the central server at your local grocer who then delivers the food to your home? The food is then stored in your smart fridge which documents your daily diet at home and delivers your weekly dietary assessment to your home computer. At your
computer, you can compare your diet with other diets aimed at weight loss, optimal strength training, reduction in risk for specific diseases or any other health goals you may have. You may also delve into the field of nutritional genetics and download your gene expression profiles to a database that analyzes yours against millions of others.
References & Links
1Zimmerman, M.B. “Research on Iodine Deficiency and Goiter in the 19th and Early 20th Centuries.” J Nutr 138, no. 11 (November 2008): 2060–63. http://jn.nutrition.org/content/138/11/2060.full
2The Harvard School of Public Health. “New US Dietary Guidelines: Progress, Not Perfection.” 2012. The President and Fellows of Harvard College. http://www.hsph.harvard.edu/nutritionsource/whatshould-you-eat/dietary-
guidelines -2010/index.html
3The Framingham Heart Study, a project of the National Heart, Lung, and Blood Institute and Boston University. “History of the Framingham Heart Study.” c 2012 Framingham Heart Study. http://www.framinghamheartstudy.org/about/history.html
4Appel, L. J., et al. “A Clinical Trial of the Effects of Dietary Patterns on Blood Pressure.,” N Engl J Med 336 (April 1997): 1117–24. http://www.nejm.org/doi/full/10.1056/NEJM199704173361601
In addition to nutrition, health is affected by genetics, the environment, life cycle, and lifestyle. These factors are referred to as “determinants” of health and they all interact with each other. For example, family income influences the food choices available and the quantity and quality of food that can be purchased, which of course affects nutrition. Except for nutrition and lifestyle, these factors can be difficult or impossible to change.
Genetics
Everyone starts out in life with the genes handed down to them from the families of their mother and father. Genes are responsible for your many traits as an individual and are defined as the sequences of DNA that code for all the proteins in your body. The expression of different genes can determine the color of your hair, skin, and eyes, and even if you are more likely to be fat or thin and if you have an increased risk for a certain disease. The sequence of DNA that makes up your genes determines your genetic makeup, also called your genome, which is inherited from your mother and father. In 2003, the Human Genome Project was completed and now the entire sequence of DNA in humans is known. It consists of about three billion individual units and contains between twenty-five and thirty thousand genes. The human genome that was sequenced was taken from a small population of donors and is used as a reference DNA sequence for the entire population. Each of us has a similar but unique DNA sequence. Only identical twins and cloned animals have the exact same DNA sequence.
Now that we understand the map of the human genome, let us enter the fields of nutrigenomics and epigenetics. Recall that nutrigenomics is an emerging scientific discipline aimed at defining healthy genes and not-so healthy genes and how nutrients affect them.
Currently, scientists cannot change a person’s DNA sequence. However, they have discovered that chemical reactions in the body can turn genes “on” and “off,” causing changes in the amounts and types of proteins expressed. Epigenetics is another rapidly advancing scientific field in which researchers study how chemical reactions turn genes “on” and “off” and the factors that influence the chemical reactions. Some of these factors are now known to be nutrients. Researchers at the Genetic Science Learning Center at the University of Utah conducted an experiment in which some pregnant mice were fed a diet containing folate, choline, vitamin B12, and betaine, and other pregnant mice were fed a diet that did not contain these nutrients and chemicals. Both groups of pregnant mice were also fed bisphenol A, a chemical in plastic, which alters DNA by inhibiting a specific chemical reaction. The mice born from the mother fed the supplemented diet were brown, thin, and healthy. The mice born from the mother fed the unsupplemented diet were yellow, fat, and unhealthy. This is a dramatic example of how nutrients change not the sequence of DNA, but which genes are expressed.
These two mice look different, but have identical DNA sequences. Thus, not only do the things you eat determine your health but so do the things your mother ate during pregnancy.
Moreover, other studies have demonstrated what your dad ate—and what your grandmother ate while she was pregnant with your mother!—also can affect your gene expression and, consequently, your health. Does this make it OK for you to blame your mother and father for all of your shortcomings? No. Genetics are important in determining your health, but they are certainly not the only determinant.
The Life Cycle
The life cycle of human beings originates from a fertilized egg, which develops into a fetus that is eventually born as a baby. A baby develops into a child, transitions through the wonderful phase of adolescence, becomes an adult, and then advances into old age and eventually death (Figure 1.6 "The Life Cycle: The Forward March to Old Age and Ultimately Death"). The current average life expectancy in America is approaching eighty. To see how this compares with other countries, see Note 1.39 "Interactive 1.3".
© Shutterstock
Figure 1.6 The Life Cycle: The Forward March to Old Age and Ultimately Death.
A person’s stage of life influences their health and nutritional requirements. For example, when you are an adolescent, your bones grow quickly. More calcium, a bone-building nutrient, is required in the diet during this life stage than at other ages. As you get older, the aging process affects how your body functions. One effect of aging, apparently earlier in women than in men, is the deterioration of bone tissue. As a result, women over age fifty-one need more calcium in their diet than younger adult women. Another life-cycle stage, pregnancy, requires several adjustments to nutrition compared to non-pregnant women. It is recommended that a pregnant woman consume more protein than a non-pregnant woman to support growth and
development, and to consume more of some vitamins, such as folate, to prevent certain birth defects. The USDA provides information on healthy diets for many different stages of the life cycle on their website. Healthy aging requires eating a diet that matches one’s life stages to support the body’s specific physiological requirements. What else is known to help a person age slowly and gracefully? Diets high in vegetables and fruits are associated with increased longevity and a decreased risk of many diseases.
Environment
Your environment has a large influence on your health, genetics, life cycle, and lifestyle. Scientists say that the majority of your expressed traits are a product of your genes and environment, of which nutrition is a component. An example of this interaction can be observed in people who have the rare genetic disorder, phenylketonuria (PKU) (Figure 1.7).
Figure 1.7 The interplay of genetics and environment.
Sources: http://topnews.co.uk/214471-rare-disorder-known-phenylketonuria and http://www.georgiapku.org/AboutUs.html. © Shutterstock
The clinical signs of PKU are mental retardation, brain damage, and seizures and are caused by the build-up of the amino acid phenylalanine and its metabolites (breakdown products produced during metabolism) in the body. The high level of phenylalanine in a person who has PKU is the result of a change in the gene that encodes for an enzyme that converts phenylalanine into the amino acid tyrosine. This genetic change, called a mutation, causes the enzyme to not function properly. In this country and many others, all newborn babies are screened for PKU in order to diagnose and treat the disease before the development of mental retardation and brain damage. Once diagnosed, PKU is treated by strict adherence to a diet low
in phenylalanine, consisting mostly of fruits, vegetables, and grains. Adhering to this diet for life allows an individual with PKU to lead a normal life without suffering the consequences of brain damage, mental retardation, or seizures. In the example of PKU, the consequences of a genetic mutation are modified by diet. Thus, a person’s genes can make them more susceptible to a particular disease, or cause a disease, and their environment can decrease or increase the progression and severity of the condition.
Socioeconomic Status
Multiple aspects of a person’s environment can affect nutrition, which in turn affects health. One of the best environmental predictors of a population’s health is socioeconomic status. Socioeconomic status is a measurement made up of three variables: income, occupation, and education. Socioeconomic status affects nutrition by influencing what foods you can afford and consequently, food choice and food quality. Nutrition and health are generally better in populations that have higher incomes, better jobs, and more education. On the other hand, the burden of disease is highest in the most disadvantaged populations. A commentary in the Journal of the American Medical Association reports that the lower life expectancy of populations of lower socioeconomic status is largely attributable to increased death from heart disease. The American Heart Association states that having a healthy diet is one of the best weapons to fight heart disease and it is therefore essential that all socioeconomic status groups have access to high-quality, nutrient-dense foods. The disparities in nutrition and health in America are directly related to the disparity in socioeconomic status.1
Other dimensions that affect health disparity are race, ethnic group, sex, sexual identity, age, disability, and geographic location. The federal government recognizes the issue of inequitable health among Americans and one of the overarching goals of Healthy People 2020, a large program managed by the HHS, is to “Achieve health equity, eliminate disparities, and improve the health of all groups.” To work toward this monumental goal, the HHS is actively tracking disease patterns, chronic conditions, and death rates among the many different types of people that live in the United States.
Lifestyle
One facet of lifestyle is your dietary habits. Recall that we discussed briefly how nutrition affects health. A greater discussion of this will follow in subsequent chapters of this book as there is an enormous amount of information regarding this aspect of lifestyle. Dietary habits include what a person eats, how much a person eats during a meal, how frequently meals are consumed, and how often a person eats out at restaurants. Other aspects of lifestyle include physical activity level, recreational drug use, and sleeping patterns, all of which play a role in health and impact nutrition. Following a healthy lifestyle improves your overall health.
Physical Activity Level
In 2008, the HHS released the Physical Activity Guidelines for Americans (Interactive web link 1.3). The HHS states, “Being physically active is one of the most important steps that Americans of all ages can take to improve their health. The 2008 Physical Activity Guidelines for Americans provides science-based guidance to help Americans aged six and older improve their health through appropriate physical activity.” The guidelines recommend exercise programs for people in many different stages of their lifecycle including for pregnant women and for adults and children who have disabilities. The HHS reports that there is strong evidence that increased physical activity decreases the risk of early death, heart disease, stroke, Type 2 diabetes, high blood pressure, and certain cancers; prevents weight gain and falls; and improves cognitive function in the elderly. New guidelines are expected to be released in 2018.
Interactive web links 1.3:
2008 Physical Activity Guidelines for Americans
https://health.gov/PAGuidelines/default.aspx
Recreational Drug Use
Recreational drug use, which includes tobacco smoking and alcohol consumption along with narcotic and other illegal drug use, has a large impact on health. Smoking cigarettes causes lung cancer, eleven other types of cancer, heart disease, and several other disorders or diseases that markedly decrease quality of life and increase mortality. In the United States, smoking causes more than four hundred thousand deaths every single year, which is far more than deaths associated with any other lifestyle component.2 Also according to the CDC, excessive alcohol intake causes an estimated seventy-five thousand deaths per year.3
Staying away from excessive alcohol intake lowers blood pressure, the risk from injury, heart disease, stroke, liver problems, and some types of cancer. Abstaining from alcohol also aids in weight loss and increases the money in your wallet. While heavy drinking of alcoholic beverages is associated with several bad health effects, consuming alcohol in moderation has been found to promote health such as reducing the risk for heart disease and Type 2 diabetes in some people. The HHS defines drinking in moderation as no more than one drink a day for women and two drinks a day for men. Illicit and prescription drug abuse are associated with decreased health and is a prominent problem in the United States. The health effects of drug abuse can be far-reaching including increased risk for stroke, heart disease, cancer, lung disease, and liver disease.
Sleeping Patterns
Inadequate amounts of sleep, or not sleeping well, can also have remarkable effects on a person’s health. In fact, sleeping can affect your health just as much as diet or exercise. At least 10 percent of Americans have chronic insomnia. Scientific studies have shown that insufficient sleep increases the risk for heart disease, Type 2 diabetes, obesity, and depression. Abnormal breathing during sleep, a condition called sleep apnea, is also linked to an increased risk for chronic disease.4 (Watch Video 1.5)
Required Video 1.5
Brief promotional video with easy to follow tips to improve your sleep and hence overall well- being. https://youtu.be/DMX1P8fDrlc
Nutrition, Genetics, Environment, and Lifestyle Interact to Affect Health
The Pima Indians who inhabit parts of southern Arizona and the Pima Indians that live across the border in Mexico are genetically and culturally similar, but there are vast differences in the health of these two populations. In America, the Pima Indians have the highest rate of obesity and Type 2 diabetes compared to any other ethnic group. However, the Pima Indians who live in Mexico do not share these same health problems because of a complex interplay between nutrition, genetics, environment, and lifestyle. Over one hundred years ago, the Pima Indians were farmers, hunters, and gatherers and their diets consisted of about 70 percent carbohydrate, 15 percent protein, and 10 to 15 percent fat. Typical of the lives of farmers, hunters, and gatherers a century ago, they lived through times of feast and times of famine.
The geneticist James Neel proposed in 1962 that the Pima Indians carried a “thrifty gene” that makes them very efficient at storing fat during times of plenty so they do not starve when food is scarce. After World War II, the Pima Indians in America either went back to reservations in southern Arizona or moved to the cities for work. They rapidly adopted the American diet and lifestyle and consumed high-fat, processed foods, and refined grains and were more sedentary than their counterparts in Mexico, who retained their more traditional diet and lifestyle. Today, the typical American Pima Indian diet obtains more than 40 percent of calories from fat. The “thrifty gene” in the American Pima Indian population increased their susceptibility to the consequences of the high-fat American diet and sedentary lifestyle because they were genetically better at storing fat than others. The story of the Pima Indians and the difference between the health of their populations in America and Mexico demonstrates the interactions between nutrition, genetics, environment, and lifestyle. Indeed, preliminary studies suggest that when American Pima Indians switch back to the diets of their ancestors and consume
beans, corn, grains, and greens and other low-fat, high-fiber plant foods, the benefits are weight loss and reduced risk of chronic disease. The health status of American Pima Indians is considered “a canary in the coal mine,” meaning they provide a warning to the American people (Figure 1.8).
Although the health consequences of the American diet and lifestyle in Pima Indians appeared rapidly in their population, all Americans that partake in the current trends of American diet and lifestyle are at risk. On the lighter side (literally!), the new studies that show changing back to more traditional diets markedly improved the health of the American Pima Indians suggest that all Americans can reduce their risk for diet-related diseases even when their genetic susceptibility for these diseases is high.
Pima Indians living in America are genetically similar to those who live in Mexico, but differences in their nutrition, environment, and lifestyle changes their health.
Source: http://paleobioticslab.com/general-interest-articles/so-go-the-pimas-so-go-the-rest-of-us/.
Figure 1.8 The Interplay of Nutrition, Genetics, Environment, and Lifestyle Affects Health.
Personal Choice: The Challenge of Choosing Foods
From visiting websites about traditional foods of different cultures and ethnic groups, you may have noticed that a few more things besides environment and lifestyle that influence the foods you choose to eat. Different foods affect energy level, mood, how much is eaten, how long before you eat again, and if cravings are satisfied. We have talked about some of the physical effects of food on your body, but there are other effects too. Food regulates your appetite and
how you feel. Multiple studies have demonstrated that some high-fiber foods and high-protein foods decrease appetite by slowing the digestive process and prolonging the feeling of being full. The effects of individual foods and nutrients on mood are not backed by consistent scientific evidence but in general, most studies support that healthier diets are associated with a decrease in depression and improved well-being. To date, science has not been able to track the exact path in the brain that occurs in response to eating a particular food, but it is quite clear that foods, in general, stimulate emotional responses in people.
Food also has psychological, cultural, and religious significance, so your personal choices of food affect your body, mind, and soul. The social implications of food have a great deal to do with what people eat, as well as how and when. Special events in individual lives—from birthdays to funerals—are commemorated with equally special foods. Being aware of these forces can help people make healthier food choices—and still honor the traditions and ties they hold dear. Typically, eating kosher food means a person is Jewish; eating fish on Fridays during Lent means a person is Catholic; fasting during the ninth month of the Islamic calendar means a person is Muslim. On New Year’s Day, people from New England like to combine pork and sauerkraut as a way to eat their way to luck. Several hundred miles away in the southern United States, people eat Hoppin’ John, a favorite local dish made with black-eyed peas and pork, while fish is the “lucky” food of choice for Japanese Americans. National food traditions are carried to other countries when people immigrate. American cuisine would not be what it is today without the contributions of Italian, Chinese, Mexican, and other immigrants.
Factors that Drive Food Choices
Along with these influences, a number of other factors affect the dietary choices individuals make, including:
convenient, but might not offer substantial nutrition. Yet getting in the habit of drinking an ample amount of water each day can yield multiple benefits.
References & Links
1Fiscella, K. and D. Tancredi. “Socioeconomic Status and Coronary Heart Disease Risk Prediction.” JAMA 300, no. 22 (2008): 2666–68.
2Centers for Disease Control and Prevention. “Smoking and Tobacco Use.” Last updated March 21, 2011. http://www.cdc.gov/tobacco/data_statistics/fact_sheets/health_effects/tobacco_related_mortality/index.htm 3Centers for Disease Control and Prevention. “Alcohol and Drug Use.” Last updated June 7, 2012. http://www.cdc.gov/healthyyouth/alcoholdrug/
4National Sleep Foundation. “Can’t Sleep? What to Know about Insomnia.” Accessed February 12, 2012. http://www.sleepfoundation.org/article/sleep-related-problems/insomniaand-sleep
You may remember that when you were younger your mother or grandmother made you swallow that teaspoonful of cod liver oil because she said it was good for you. You don’t have to have a PhD to know some of the basic ways you can adapt your life to be healthier. However, the mainstream media inundates the American population with health cures and tips, making it confusing to develop the best plan for your health. This section will equip you with tools to assess and improve your health.
Personal Health Assessment
One of the easiest places to begin a personal health assessment is by examining the results from your last physical. Often a person will leave the doctor’s office without these results. Remember that the results belong to you and having this information on hand provides you with much of what you need to keep track of your health. During a physical, after obtaining weight and height measurements, a nurse will typically examine blood pressure. Blood pressure is a measurement of the forces in the arteries that occur during each heartbeat. It is a principle vital sign and an indicator of cardiovascular health.
In most circumstances, a physical includes blood tests, which measure many health indicators, and you have to request the results. Once you have the results-in-hand, it is good practice to file them in a binder so you can compare them from year to year. This way you can track your blood-cholesterol levels and other blood-lipid levels and blood-glucose levels. These are some of the more general measurements taken but in many instances, blood tests also examine liver and kidney function, vitamin and mineral levels, hormone levels, and disease markers. Your doctor uses all of these numbers to assess your health and you can use them to play a more active role in keeping track of your health.
Hearing and vision are additionally part of a general health assessment. If you wear glasses, contacts, or a hearing aid you already are aware of how important it is to know the results of these exams. If you have not experienced vision or hearing problems yet your likelihood of experiencing them markedly increases over the age of forty. Another component of overall health is oral health. The health of your teeth, gums, and everything else in your mouth are an integral component of your overall health. This becomes apparent when a person experiences a tooth infection, which if left untreated significantly impairs physical, mental, and social well- being.
Other indicators of health that you can measure yourself are body mass index (BMI) and fitness. BMI is a standardized measurement that indicates if a person is underweight, of normal weight,
overweight, or obese and is based on data from the average population. You can calculate this yourself or use one of the many BMI calculators on the web (Interactive web links 1.4). It has some limitations. One limitation is that it does not take into account how much of your weight is made up of muscle mass, which weighs more than fat tissue. BMI and other measurements of body composition and fitness are more fully discussed in later chapters. This discussion of a personal health assessment has focused primarily on physical health, but remember that mental and social well-being also affect health. During a physical, a doctor will ask how you are feeling, if you are depressed, and if you are experiencing behavioral problems. Be prepared to answer these questions truthfully, so that your doctor can develop a proper treatment plan to manage these aspects of health.
Interactive web links 1.4:
BMI Calculator for Adults: https://www.cdc.gov/healthyweight/assessing/bmi/adult_bmi/english_bmi_calculator/bmi_calcula tor.html
BMI Calculator for Teens and Children: https://nccd.cdc.gov/dnpabmi/calculator.aspx
Taking charge of your health will pay off and equip you with the knowledge to better take advantage of your doctor’s advice during your next physical. Health calculators, such as those that calculate BMI, ideal weight, target heart rate among many others, and personal health assessments will help you to take charge of your health, but they should not take the place of visiting your doctor.
Dietary Assessment
The first step in assessing your diet is to find out if the foods you eat are good for your health and provide you with all the nutrients you need. Begin by recording in a journal what you eat every day, including snacks and beverages. You can track calories over time, diet quality, and find many other tools to evaluate your daily food consumption at www.choosemyplate.org. The questions these tools can help answer include: How much food do you have to eat to match your level of activity? How many calories should you eat? What are the best types of food to get the most nutrients? What nutrients are contained in different foods? How do you plan a menu that contains all the nutrients you need? Make the first step and assess your diet. This book will provide you with interactive resources, videos, and audio files to empower you to create a diet that improves your health.
Family Medical History
Because genetics play a large role in defining your health, it is a good idea to take the time to learn some of the diseases and conditions that may affect you. To do this, you need to record your family’s medical history. Start by simply drawing a chart that details your immediate family and relatives. Many families have this and you may have a good start already. The next time you attend a family event start filling in the blanks. What did people die from? What country did Grandpa come from? While this may be a more interesting project historically, it can also provide you with a practical tool to determine what diseases you might be more susceptible.
This will allow you to make better dietary and lifestyle changes early on to help prevent a disease from being handed down from your family to you. It is good to compile your information from multiple relatives.
Lifestyle Assessment
A lifestyle assessment includes evaluating your personal habits, level of fitness, emotional health, sleep patterns, and work-life balance. Many diseases are preventable by simply staying away from certain lifestyles. Don’t smoke, don’t drink excessively, and don’t do recreational drugs. Instead, make sure you exercise. Find out how much to exercise by reading the 2008 Physical Activity Guidelines for Americans. There is a wealth of scientific evidence that increased physical activity promotes health, prevents disease, and is a mood enhancer. Emotional health is often hard to talk about; however, a person’s quality of life is highly affected by emotional stability. Harvard’s Women’s Health Watch notes six reasons to get enough sleep: Sleep promotes healthy brain function, while lack of sleep can cause weight gain and increase appetite, decrease safety (falling asleep while driving), make a person moody and irritable, decrease health of the cardiovascular system and prevent the immune system from functioning well.1
Finding balance between work and life is a difficult and continuous process involving keeping track of your time, taking advantage of job flexibility options, saying no, and finding support when you need it. Work-life balance can influence what you eat too.
References & Links
1Harvard Health Publications. “Importance of Sleep: Six Reasons Not to Scrimp on Sleep.” Harvard’s Women’s Health Watch (January 2006). c 2000–2012 Harvard University.
http://www.health.harvard.edu/press_releases/importance_of_sleep_and _health
The science of nutrition includes the study of how organisms obtain food from their environment. An ecosystem is defined as the biological and physical environments and their interactions with the community of organisms that inhabit those environments as well as the interactions among the organisms. Human nutrition and the health of the world’s ecosystem are interdependent, meaning that what we eat and where we get it from affects the world. In turn, the health of the earth influences our health. The term sustainability is used to indicate the variety of approaches aimed at improving our way of life. Sustainability promotes the development of conditions under which people and nature can interact harmoniously. It is based upon the principle that everything needed for human survival depends upon the natural environment.
A major theme of sustainability is to ensure that the resources needed for human and environmental health will continue to exist. A healthy ecosystem, one that is maintained over time, is harmonious and allows for social and economic fulfillment for present and future generations. Nutritious foods come from our ecosystem and to ensure its availability for generations to come, it must be produced and distributed in a sustainable way. The American Public Health Association (APHA) defines a sustainable food system as “one that provides healthy food to meet current food needs while maintaining healthy ecosystems that can also provide food for generations to come with minimal negative impact to the environment.”1
It also states the attributes of a sustainable food system are:
Available Accessible Affordable to all Humane
jJst
A sustainable food system does not just include the food and those who consume the food, but also those that produce the food, like farmers and fishermen, and those who process, package, distribute, and regulate food. Unfortunately, we have a long way to go to build a sustainable food system.
The Challenges
The most prominent challenge to building a sustainable food system is to make food available and accessible to all. The Food and Agricultural Organization of the United Nations (FAO) states the right to food is a fundamental human right and its mission is to assist in building a food- secure world. Food security in America (Figure 1.9) is defined as the “access by all people at all times to enough food for an active, healthy life.”2
Image Source: Calculated by ERS using data from the December 2009 Current Population Survey Food Security Supplement.
Figure 1.9 Food Security Status in the United States.
As of 2009, 14.9 percent of households, or 17.4 million people in the United States, had very low or low food security and these numbers have risen in recent years.3
Food security is defined by the FAO as existing “when all people, at all times, have physical, social, and economic access to sufficient, safe, and nutritious food which meets their dietary needs and food preferences for an active and healthy life.” (Figure 1.10) The FAO estimates that 925 million worldwide were undernourished in 2010. Although there was a recent decline in overall food insecurity (attributable mostly to a decline in undernourished people in Asia), the number of undernourished people world-wide is still higher than it was in 1970, despite many national and international goals to reduce it.4
Source: Calculated by ERS based on Current Population Survey Food Security Supplement data.
Figure 1.10 Food Insecurity: A Global Perspective.
Another challenge to building a sustainable food system is to supply high-quality nutritious food. The typical American diet does not adhere to dietary guidelines and recommendations, is unhealthy, and thus costs this country billions of dollars in healthcare. The average American diet contains too many processed foods with added sugars and saturated fats and not enough fruits, vegetables, and whole grains. Moreover, the average American takes in more kilocalories each day than ever before. This shift of the population toward unhealthy, high-calorie diets has fueled the obesity and diet-related disease crisis in this nation. Overall the cost of food for the average American household has declined since the 1970s; however, there has been a growth of “food deserts.” A food desert is a location that does not provide access to affordable, high- quality, nutritious food. One of the best examples of a “food desert” is in Detroit, Michigan. The lower socioeconomic status of the people who live in this city does not foster the building of grocery stores in the community. Therefore, the most accessible foods are the cheap, high- caloric ones sold in convenience stores. As a result, people who live in Detroit have some of the highest incidences of obesity, Type 2 diabetes, and cardiovascular disease in the country.
A fourth challenge to building a sustainable food system is to change how we produce, process, and distribute food. Large agribusiness, complex industrial processing, and massive retail conglomerations distort the connection we have between the food on our plate and where it came from. More food is being produced in this nation than ever before, which might sound
good at first. However, some factors that have contributed to higher food production include using genetically engineered plants, excessive use of herbicides and pesticides, and the selective promotion of only a few crops by the policy of crop-specific subsidies (money given to farmers by the federal government). The subsidies are given toward the support of only about eight crops, most notably corn and soybeans. This policy diminishes the variety of crops, decreases biodiversity among crops, and supports large agribusiness while disadvantaging small- and medium-sized farms. Additionally, the whole system of food production, processing, and distribution is lengthy, requiring a great deal of energy and fossil fuels, and promotes excessive use of chemicals to preserve foods during transportation and distribution. In fact, the current US food system uses approximately 22 percent of the energy in this country and is responsible for at least 20 percent of greenhouse gas emissions.5
Solutions to the Challenges
While these challenges are daunting there are many potential solutions that are gaining momentum in the United States. The APHA advocates expanding the infrastructure for locally grown food, improving access to healthy and local food for low-income Americans, providing education on food origin and production, building up the livelihoods of local farmers, and using sustainable farming methods. Detroit is currently a “food desert,” but there is a fantastic example of how to positively impact the growth of a sustainable food system within the city. It is called the Eastern Market and it is a six-block inner city market with over 250 vendors marketing local produce, meat, seafood, plants, fresh-cut flowers and much, much more. Unlike many urban farmers’ markets it sells foods that are of better quality and lower prices than grocery stores. Its forty-thousand visitors every Saturday demonstrate its success as a community-based way to foster good nutrition, good health, and social interaction.
References & Links
1American Public Health Association. “Towards a Healthy, Sustainable Food System.” Policy Statement Database. Policy no. 200712 (November 6, 2007). http://www.apha.org/advocacy/policy/policysearch/default.htm?id=1361 2US Department of Agriculture, Economic Research Service. “Food Security in the United States: Key Statistics and Graphics.” Last updated June 4, 2012. http://www.ers.usda.gov/Briefing/FoodSecurity/stats_graphs.htm#food_secure
3Food and Agricultural Organization of the United Nations. “Food Security: Concepts and Measurement.” In
Corporate Document Repository, ID: 144369. 2003. http://www.fao.org/docrep/005/y4671e/y4671e06.htm
4Food and Agriculture Organization of the United Nations. “How Does International Price Volatility Affect Domestic Economies and Food Security? In The State of Food Insecurity in the World. 2011. http://www.fao.org/publications/sofi/en/
5Canning, P. et al. “Energy Use in the US Food System.” US Department of Agriculture, Economic Research Report, no. ERR-94 (March 2010). http://www.ers.usda.gov/Publications/ERR94/ERR94_ReportSummary.pdf
Chapter 2: Energy-Yielding Macronutrients
As you have learned, there are three energy-yielding macronutrients: carbohydrates, proteins, and lipids. The energy contained in these molecules is found in the electrons that are shared in the covalent bonds that link the atoms. Our individual cells (in a process called Cellular Respiration, documented in a later chapter) deconstruct these molecules, and use the energized electrons to generate the ATP needed to keep our cells alive. This chapter goes more in depth about these major dietary components that are so critical to life.
Sections:
Carbohydrates
Carbohydrates have become surprisingly divisive. Some people swear by them, others swear against them. But it is important to understand that carbohydrates are a diverse group of compounds that have a multitude of effects in the body. Thus, trying to make blanket statements about carbohydrates is probably not a good idea.
Carbohydrates are named because they are hydrated (as in water, H2O) carbon. Below is the formula showing how carbon dioxide (CO2) and water (H2O) are used to make carbohydrates (CH2O)n and oxygen (O2). The “n” after the carbohydrate in the formula indicates that the chemical formula is repeated an unknown number of times, but that for every carbon and oxygen, there will always be two hydrogens. Putting it another way: a carbohydrate always contains carbon, hydrogen, and oxygen atoms in a ratio of 1:2:1.
CO2 + H2O --> (CH2O)n + O2
Carbohydrates are produced by plants through a process known as photosynthesis. In this process, plants use the energy from photons of light to synthesize carbohydrates. The formula for this reaction looks like this:
Carbon Dioxide + water Carbohydrate (Glucose) and Oxygen
6CO2 + 6H2O + Light --> C6H12O6 + 6O2
1
Light (sunlight) in the reaction above is the energy that will ultimately be stored in the glucose molecule (C6H12O6). This will be the energy available for use when a human being consumes a glucose molecule! There are many different types of carbohydrates as shown in the figure below. One way that carbohydrates can be classified is into simple carbohydrates, complex carbohydrates, and sugar alcohols. As the names imply, complex carbohydrates contain more sugar units, while simple carbohydrates contain either 1 or 2 sugars. In the next sections, you will learn more about the different forms of carbohydrates.
Figure 2.11 The different forms of carbohydrates Subsections:
No References
2
Simple Carbohydrates
As shown in the figure below, simple carbohydrates can be further divided into monosaccharides and disaccharides. Mono- means one, thus monosaccharides contain one sugar. Di- means two, thus disaccharides contain 2 sugar units.
Figure 2.111 Overview of Carbohydrates
Monosaccharides
While there are many organic compounds that qualify as monosaccharides, there are only three that are found in the foods we eat. These three monosaccharides are: glucose, fructose and galactose. Notice that all are 6-carbon sugars (hexoses). However, fructose has a five member ring, while glucose and galactose have 6 member rings. Also notice that the only structural difference between glucose and galactose is the position of the alcohol (OH) group that is shown in red.
3
Figure 2.112 The 3 monosaccharides
Despite these differences in structure, glucose, galactose, and fructose have the same chemical formula (C6H12O6). Molecules with a common chemical formula, yet different chemical structures, are called isomers. These three monosaccharides are additionally characterized by the following:
Glucose - Product of photosynthesis, major source of energy in our bodies Fructose - Commonly found in fruits and used commercially in many beverages
Galactose - Not normally found in nature alone, normally found in the disaccharide lactose (also known as milk sugar)
Required Web Link
Not familiar with ring structures? See how glucose forms a ring.
Disaccharides
Disaccharides are produced from 2 monosaccharides. The commonly occurring disaccharides are:
Maltose (glucose + glucose, aka malt sugar) - seldom found in foods, present in alcoholic beverages and barley
Sucrose (glucose + fructose, aka table sugar) - only made by plants.
Lactose (galactose + glucose, aka milk sugar) - primary milk sugar
The different disaccharides and the monosaccharides components are illustrated in Figure 2.113.
4
Figure 2.113 The 3 disaccharides
Each of these disaccharides contains glucose and all the reactions are dehydration reactions (a reaction that creates a link between two molecules through the loss of a molecule of water).
You might hear the term glycosidic bond used to identify the bonds between monosaccharides. A glycoside is a sugar, so glycosidic is referring to a sugar bond. Interestingly, lactose has a unique glycosidic bond. People require special enzyme, lactase, to break this bond, and the absence of lactase activity leads to lactose intolerance.
High-Fructose Corn Syrup
Food manufacturers are always searching for cheaper ways to produce their food. One method that has been popular is the use of high-fructose corn syrup as an alternative to sucrose. High- fructose corn syrup contains either 42 or 55% fructose, which is similar to sucrose1.
Nevertheless, because an increase in high-fructose corn syrup consumption (see figure below) has coincided with the increase in obesity in the U.S., there is a lot of controversy surrounding its use.
5
Figure 2.114 U.S. per capita sugar and sweetener consumption2
Opponents claim that high-fructose corn syrup is contributing to the rise in obesity rates. As a result, some manufactures have started releasing products made with natural sugar. You can read about this trend in the following New York Times article in the link below. Also, manufacturers tried to rebrand high-fructose corn syrup as corn sugar to get around the negative perception of the name. But the FDA rejected the Corn Refiners Association request to change the name officially to corn sugar as described in the second link. The last link is a video made by the American Chemical Society that gives some background on how HFCS is produced and how it compares to sucrose.
Required Web Links
Sugar is back on labels, this time as a selling point No new name for high-fructose corn syrup
(Video): Sugar vs. High Fructose Corn Syrup - What's the Difference? (2:41)
References & Links
Links
Not familiar with Ring structures? See how glucose forms a ring - http://en.wikipedia.org/wiki/File:Glucose_Fisher_to_Haworth.gif
6
Sugar is back on labels, this time as a selling point - http://www.nytimes.com/2009/03/21/dining/21sugar.html?_r=1&ref=nutrition
No new name for high-fructose corn syrup - http://well.blogs.nytimes.com/2012/05/31/no-new-name-for-high- fructose-corn-syrup/?_r=0
Video
Sugar vs. High Fructose Corn Syrup – What's the Difference? - https://www.youtube.com/watch?v=fXMvregmU1g
Sugar Alcohols (Polyols, Sugar Replacers)
Sugar(s) can provide a lot of calories and contribute to tooth decay. Thus there are many other compounds that are used as alternatives to sugar that have been developed or discovered. We will first consider sugar alcohols and then the alternative sweeteners in subsequent sections.
Below you can see the structure of three common sugar alcohols: xylitol, sorbitol, and
mannitol.
Figure 2.121 Structure of three commonly used sugar alcohols: xylitol, sorbitol, and mannitol1-3 Remember that alcohol subgroups are (OH), and you can see many of them in these structures.
Sugar alcohols are also known as "sugar replacers", because some in the public might get confused by the name sugar alcohol. Some might think a sugar alcohol is a sweet alcoholic beverage. Another name for them is nutritive sweeteners, which indicates that they do provide calories. Sugar alcohols are nearly as sweet as sucrose but only provide approximately half the calories as shown below. The name polyols also seems to be increasingly used to describe these compounds.
7
Table 2.121 Relative sweetness of monosaccharides, disaccharides, and sugar alcohols4,5
Sweetener | Relative Sweetness | Energy (kcal/g) |
Lactose | 0.2 | 4* |
Maltose | 0.4 | 4 |
Glucose | 0.7 | 4 |
Sucrose | 1.0 | 4 |
Fructose | 1.2-1.8 | 4 |
Erythritol | 0.7 | 0.4 |
Isomalt | 0.5 | 2.0 |
Lactitol | 0.4 | 2.0 |
*Differs based on a person’s lactase activity
Sugars are fermented by bacteria on the surfaces of teeth. This results in a decreased pH (higher acidity) that leads to tooth decay and, potentially, cavity formation (a process officially known as dental caries). The major advantage of sugar alcohols over sugars is that sugar alcohols are not fermented by bacteria on the tooth surface. There is a nice picture of this process in the link below as well as a video explaining the process of tooth decay.
Required Web Links Sugar and Dental Caries Video: Tooth Decay (1:06)
References & Links
Link
Sugar and Dental Caries - http://www.asu.edu/courses/css335/caries.htm
Video
Tooth Decay - http://www.youtube.com/watch?v=_oIlv59bTL4
8
Alternative Sweeteners
Alternative sweeteners are simply alternatives to sucrose and other mono- and disaccharides that provide sweetness. Many have been developed to provide zero-calorie or low calorie sweetening for foods and drinks.
Because many of these provide little to no calories, these sweeteners are also referred to as non-nutritive sweeteners (FDA is using high-intensity sweeteners to describe these products3). Aspartame does provide calories, but because it is far sweeter than sugar, the small amount used does not contribute meaningful calories to a person's diet. Until the FDA allowed the use of the term stevia, this collection of sweeteners was commonly referred to as artificial sweeteners, because they were synthetically or artificially produced. However, with stevia, the descriptor artificial can no longer be used to describe these sweeteners. More recently, Luo Han Guo (monk fruit) extracts have also been allowed to be used as another high-intensity sweetener that is not synthesized or artificially produced. The table in the link below summarizes the characteristics of the FDA approved high-intensity sweeteners.
Required Web Link
Saccharin
Saccharin is the oldest of the artificial sweeteners. Saccharin was linked to bladder cancer in rats in the late 70’s, but subsequent research did not establish the link in humans. While saccharin might not present as a significant health hazard, you do not want to use it in cooking or baking because it develops a bitter taste4.
Figure 2.131 Structure of saccharin5
9
Cyclamate
Cyclamate (sodium cyclamate) is a artificial sweetener that was discovered in 1937. It was banned by the FDA in 1969, primarily due to its questionable safety. Cyclamate is about 30 times sweeter than sucrose, and is often used in combination with other artificial sweeteners. Cyclamate is approved for use in over 80 countries, including those in the European Union and Canada.
Aspartame
Aspartame is made up of 2 amino acids (phenylalanine and aspartate) and a methyl (CH3) group. Aspartame is marketed under the product name NutraSweet ®. The compound is broken down during digestion into the individual amino acids. This is why it provides 4 kcal/g, just like protein4. Because it can be broken down to phenylalanine, products that contain aspartame contain the following message: "Phenylketonurics: Contains phenylalanine." Phenylketonuria (PKU) will be covered in greater detail in section 2.25. When heated, aspartame breaks down and loses its sweet flavor1.
Figure 2.132 Structure of aspartame6
Neotame
Neotame is like aspartame version 2.0. Neotame is structurally identical to aspartame except that it contains an additional side group (bottom of figure below, which is flipped backwards to make it easier to compare their structures). While this looks like a minor difference, it has profound effects on the properties of neotame. Neotame is much sweeter than aspartame and is heat-stable. It can still be broken down to phenylalanine, but such small amounts are used that it is not a concern for those with PKU1,4.
10
Figure 2.133 Structure of neotame7
Advantame
The newest, sweetest alternative sweetener approved by the FDA in 2014 is advantame. It is heat-stable and does not have a trade name yet3. Notice it also has a similar structure to aspartame and neotame. Like Neotame, it can be broken down to phenylalanine, but such small amounts are used that it is not a concern for those with PKU. However, it has a much higher acceptable daily intake than Neotame4, meaning there is less concern about adverse effects from consuming too much.
Figure 2.134 Structure of advantame8
11
Acesulfame-Potassium (K)
Acesulfame-potassium (K) is not digested or absorbed, therefore it provides no energy or potassium to the body1. It is a heat-stable alternative sweetener.
Figure 2.135 Structure of acesulfame-potassium (K)9
Sucralose
Sucralose is structurally identical to sucrose except that 3 of the alcohol groups (OH) are replaced by chlorine molecules (Cl). This small change causes sucralose to not be digested and as such is excreted in feces1,4. It is a heat-stable alternative sweetener.
Figure 2.136 Structure of sucralose10
Stevia
Stevia is a heat-stable alternative sweetener derived from a South American shrub, with the leaves being the sweet part. The components responsible for this sweet taste are a group of compounds known as steviol glycosides. The structure of steviol is shown in Figure 2.137.
12
Figure 2.137 Structure of steviol12
The term glycoside means that there are sugar molecules bonded to steviol. The two predominant steviol glycosides are stevioside and rebaudioside A. The structure of these two steviol glycosides are very similar13. The structure of stevioside is shown below as an example.
Figure 2.138 Structure of stevioside14
The common name for a sweetener containing primarily rebaudioside A is rebiana13. Stevia sweeteners have been marketed as natural alternative sweeteners, something that has been stopped by lawsuits as described in the following link.
Required Web Link
What is natural and who decides?
13
Luo Han Guo Extracts
Luo Han Guo (aka Siraitia grosvenrii Swingle, monk fruit) extracts are a newer, natural heat- stable alternative sweetener option derived from a native Chinese fruit. These extracts are sweet because of the mogrosides that they contain3. The structure of a mogroside is shown below.
Figure 2.139 Structure of a mogroside15
References & Links
Links
FDA High-Intensity sweeteners - http://www.fda.gov/food/ingredientspackaginglabeling/foodadditivesingredients/ucm397725.htm
What is natural and who decides? - http://www.nutraingredients-usa.com/Markets/Pure-Via-to-settle-class- action-suit-over-natural-claims
14
Oligosaccharides
Within the category of complex carbohydrates, there are oligosaccharides and polysaccharides. Oligosaccharides (oligo means few) are composed of 3-10 sugar units and polysaccharides contain greater than 10 sugar units.
Figure 2.141 Overview of carbohydrates
Raffinose and stachyose are the most common oligosaccharides. They are found in legumes, onions, broccoli, cabbage, and whole wheat1. The link below shows the raffinose and stachyose content of some plant foods.
Required Web Link
Raffinose and stachyose content of selected plant foods
15
The structures of the two oligosaccharides are shown below.
Figure 2.142 Structure of raffinose2
Figure 2.143 Structure of stachyose3
Our digestive system lacks the enzymes necessary to digest the unique glycosidic bonds found in oligosaccharides. As a result, the oligosaccharides are not digested in the small intestine and reach the colon where they are fermented by the bacteria there. Gas (methane, CH4) is produced as a byproduct of this bacteria fermentation that can lead to flatulence. To combat this problem, Beano® is a popular product that contains an enzyme (alpha-galactosidase) to break down oligosaccharides, thereby preventing them from being used to produce gas. The video link below describes how Beano® works.
Required Web Link
(Video) Beano's University of Gas: Lesson 2
16
References & Links
Videos
Raffinose and stachyose content of foods - http://books.google.com/books?id=LTGFV2NOySYC&pg=PA374&lpg=PA374&dq=raffinose+and+stachyose+conten t+of+vegetables&source=bl&ots=X4Dr7jWmwL&sig=CJFvhAIysSZCP2SOy_MqhfoVYQQ&hl=en&ei=TSRITdTfLNH0gA fB2MX_BQ&sa=X&oi=book_result&ct=result&resnum=6&ved=0CD0Q6AEwBQ#v=onepage&q=raffinose%20and%2 0stachyose%20content%20of%20vegetables&f=false
Beano's University of Gas - http://beano.com.cn/university-of-gas#
Polysaccharides
Poly means "many" and thus polysaccharides are made up of many monosaccharides (>10). There are 3 main classes of polysaccharides: starch, glycogen, and most fibers. The following sections will describe the structural similarities and differences between the 3 classes of polysaccharides that are divided in the figure below.
17
Subsections:
Starch
Starch is the storage form of glucose in plants. There are two forms of starch (shown in the figures below): amylose and amylopectin. Structurally they differ in that amylose is a linear polysaccharide (Figure 2.1511), whereas amylopectin is branched (Figure 2.1512).
Figure 2.1511 Structure of amylose
Figure 2.1512 Structure of amylopectin
Amylopectin is more common than amylose (4:1 ratio on average) in starch1,2. Some starchy foods include grains, root crops, tubers, and legumes.
References & Links
18
Glycogen
Glycogen is similar to starch in that it is a storage form of glucose. Glycogen, however, is the carbohydrate storage form in animals, rather than plants. It is even more highly branched than amylopectin, as shown below.
Figure 2.1521 Structure of glycogen
The advantage of glycogen's highly branched structure is that the multiple ends (shown in red above) are where enzymes start to cleave off glucose molecules. As a result, with many ends available, it can provide glucose much more quickly to the body than it could if it was a linear molecule like amylose with only two ends. Although glycogen is characteristically found in muscle tissue (meats), we consume almost no glycogen, because it is rapidly broken down by enzymes in animals after slaughter1.
References & Links
1. Whitney E, Rolfes SR. (2008) Understanding Nutrition. Belmont, CA: Thomson Wadsworth.
Fiber
The simplest definition of fiber is indigestible matter. Indigestible means that it survives digestion in the small intestine and reaches the large intestine.
There are 3 major fiber classifications1:
Dietary Fiber - non-digestible carbohydrates and lignin that are intrinsic and intact in plants
19
Functional Fiber - isolated, non-digestible carbohydrates that have beneficial physiological effects in humans
Total Fiber - dietary fiber + functional fiber
The differences between dietary and functional fiber are compared in the table below: Table 2.1531 Differences between dietary fiber and functional fiber
Dietary Fiber | Functional Fiber |
Intact in plants | Isolated, extracted, or synthesized |
Carbohydrates + lignins | Only carbohydrates |
Only from plants | From plants or animals |
No proven benefit | Must prove benefit |
Dietary fiber is always intact in plants, whereas functional fiber can be isolated, extracted or synthesized. Functional fiber is only carbohydrates, while dietary fiber also includes lignins. Functional fiber can be from plants or animals, while dietary fiber is only from plants.
Functional fiber must be proven to have a physiological benefit, while dietary fiber does not. The reason behind the non-digestibility of fiber is the unique glycosidic bonds that link the individual monosaccharide units; the glycosidic bonds in fiber cannot be broken by our digestive enzymes.
Fiber can be classified by its physical properties. In the past, fibers were commonly referred to as soluble and insoluble. This classification distinguished whether the fiber was soluble in water. However, this classification is being phased out in the nutrition community. Instead, most fibers that would have been classified as insoluble fiber are now referred to as non- fermentable and/or non-viscous and soluble fiber as fermentable, and/or viscous because these better describe the fiber's characteristics2. Fermentable refers to whether the bacteria in the colon can ferment or degrade the fiber into short chain fatty acids and gas. Viscous refers to the capacity of certain fibers to form a thick gel-like consistency.
The following table lists some of the common types of fiber and provides a brief description about each.
20
Table 2.1532 Common types of non-fermentable, non-viscous (insoluble) fiber
Fiber | Description |
Cellulose | Main component of plant cell walls |
Hemicellulose | Surround cellulose in plant cell walls |
Lignin | Non-carbohydrate found within “woody” plant cell walls |
Table 2.1533 Common types of fermentable, viscous (soluble) fiber
Fiber | Description |
Hemicellulose | Surround cellulose in plant cell walls |
Pectin | Found in cell walls and intracellular tissues of fruits and berries |
Beta-glucans | Found in cereal brans |
Gums | Viscous, usually isolated from seeds |
The following table gives the percentage of total dietary fiber in 5 foods. Table 2.1534 Total dietary fiber (as percent of sample weight)3
Food | Total Dietary Fiber |
Cereal, all bran | 30.1 |
Blueberries, fresh | 2.7 |
Broccoli, fresh, cooked | 3.5 |
Pork and beans, canned | 4.4 |
Almonds, with skin | 8.8 |
21
The table below shows the amount of non-fermentable, non-viscous fiber in these same five foods.
Table 2.1535 Non-viscous fiber (as percent of sample weight)3
Food | Hemicellulose | Cellulose | Pectin | Lignin | Total |
Cereal, all bran | 15.3 | 7.5 | 0.9 | 4.3 | 28.0 |
Blueberries, fresh | 0.7 | 0.4 | 0.4 | 0.9 | 2.4 |
Broccoli, fresh, cooked | 0.9 | 1.2 | 0.7 | 0.3 | 3.1 |
Pork and beans, canned | 0.9 | 1.6 | 0.3 | 0.2 | 3.0 |
Almonds, with skin | 1.8 | 3.3 | 1.6 | 1.9 | 8.6 |
The table below shows the amount of fermentable, viscous fiber in these same five foods.
Table 2.1536 Viscous Fiber (as percent of sample weight)3
Food | Hemicellulose | Pectin | Total |
Cereal, all bran | 2.0 | 0.1 | 2.1 |
Blueberries, fresh | 0.1 | 0.2 | 0.3 |
Broccoli, fresh, cooked | 0.2 | 0.2 | 0.4 |
Pork and beans, canned | 1.1 | 0.3 | 1.4 |
Almonds, with skin | 0.2 | tr | 0.2 |
tr = trace amounts
Foods that are good sources of non-fermentable, non-viscous fiber include whole wheat, whole grain cereals, broccoli, and other vegetables. This type of fiber is believed to decrease the risk of constipation and colon cancer, because it increases stool bulk and reduces transit time4. This reduced transit time theoretically means shorter exposure to consumed carcinogens in the intestine, and thus lower cancer risk.
Fermentable, viscous fiber can be found in oats, rice, psyllium seeds, soy, and some fruits. This type of fiber is believed to decrease blood cholesterol and sugar levels, thus also lowering the risk of heart disease and diabetes, respectively4. Its viscous nature slows the absorption of glucose preventing blood glucose from spiking after consuming carbohydrates. It lowers blood cholesterol levels primarily by binding bile acids, which are made from cholesterol, and causing them to be excreted. As such, more cholesterol is used to synthesize new bile acids.
22
References & Links
92: 175-186.
Proteins
Proteins are another major macronutrient that, like carbohydrates, are made up of small repeating units. But instead of sugars, proteins are made up of amino acids. In the following sections, you will learn more about how proteins are synthesized and why they are important in the body.
Subsections:
Amino Acids
Similar to carbohydrates, proteins contain carbon (C), hydrogen (H), and oxygen (O). However, unlike carbohydrates (and lipids) proteins also contain nitrogen (N). Proteins are made up of smaller units called amino acids. This name, amino acid, signifies that each contains an amino (NH2) and carboxylic acid (COOH) groups. The only structural difference in the 20 amino acids is the side group represented by the R below.
23
Fig 2.211 Structure of an amino acid
To illustrate the differences in the side group we will consider glycine and alanine, the two simplest amino acids. For glycine, the R group is hydrogen (H), while in alanine the R group is a methyl (CH3). The structures of these two amino acids are shown below.
Figure 2.212 Structure of glycine
Figure 2.213 Structure of alanine
Individual amino acids are joined together using a peptide bond (green) and is shown in the figure below. You might note that the formation of a peptide bond is a dehydration reaction (a reaction that creates a link between two molecules through the loss of a molecule of water).
This is the same basic reaction that links monosaccharides into more complex carbohydrates.
24
Figure 2.214 Peptide bond formation1
In addition to dipeptides, amino acids can also come together to form tripeptides (three amino acids), oligopeptides (3-10 amino acids), and polypeptides (10 or more amino acids). A polypeptide is a chain of amino acids as shown below.
Figure 2.216 A polypeptide chain2
References & Links
25
Protein Synthesis
Protein synthesis is a process critical to life. It is a cellular-based process that makes the proteins that are necessary to keeping each of our cells alive and functional. The process of protein synthesis (making protein) is not as simple as stringing together amino acids to form a polypeptide. As shown below, this is a fairly involved process. DNA contains the genetic code that is used as a template to create mRNA in a process known as transcription. The mRNA then moves out of the nucleus into the cytoplasm where it serves as the template for the process of translation, where tRNAs bring in individual amino acids that are bonded together to form a polypeptide.
Figure 2.221 The process of creating a polypeptide1
Tiny, intracellular structures, known as ribosomes, assist with translation. After translation, the polypeptide can be folded or gain structure as shown below and will be discussed in the next subsection (Protein Structure).
26
Figure 2.222 Protein synthesis and processing
These videos do an excellent job of showing and explaining how protein synthesis occurs.
Required Web Links Video: Transcription (1:49) Video: Translation (2:05)
References & Links
Videos
Transcription - http://www.youtube.com/watch?v=5MfSYnItYvg Translation - http://www.youtube.com/watch?v=8dsTvBaUMvw
27
Protein Structure
There are four levels of protein structure. Primary structure is the linear polypeptide chain. Secondary structure occurs when hydrogen bonding between amino acids in the same polypeptide chain causes the formation of structures such as beta-pleated sheets and alpha- helices. Tertiary structure, a three-dimensional folding of the polypeptide chain, occurs as a result of an attraction between different amino acids of the polypeptide chain and interactions between the different secondary structures. Finally, certain proteins contain quaternary structure where multiple polypeptide chains are bonded together to form a larger molecule.
Hemoglobin, the protein that binds oxygen in our red blood cells, is an example of a protein with quaternary structure. The figure below illustrates the different levels of protein structure.
Figure 2.231 Different Protein Structures1
28
This video does a nice job of illustrating and explaining the different protein structures.
Required Web Link
Video: Protein Structure (0:52)
References & Links
1. "225 Peptide Bond-01" by OpenStax College - Anatomy & Physiology, Connexions Web site. http://cnx.org/content/col11496/1.6/, Jun 19, 2013. Licensed under CC BY 3.0 via Commons - https://commons.wikimedia.org/wiki/File:225_Peptide_Bond- 01.jpg#/media/File:225_Peptide_Bond-01.jpg
Video
Protein Structure - http://www.youtube.com/watch?v=lijQ3a8yUYQ
Protein Functions
There are various functions of proteins in the body that are described below.
Structural
Proteins, such as collagen, serve as the scaffolding of the body, and thus are important for the structure of tissues.
Figure 2.241 Triple-helix structure of collagen1
Enzymes
We will discuss a number of enzymes throughout this class, and the vast majority are proteins. An enzyme catalyzes (enhances the rate) of a chemical reaction. The key part of an enzyme is its "active site". The active site is where a compound to be acted on, known as a substrate, enters. Enzymes are specific for their substrates; they do not catalyze reactions on any random compounds floating by. You might have heard the "lock and key" analogy used for enzymes and substrates, respectively.
29
After the substrate enters the active site and binds, the enzyme slightly changes shape (conformation). The enzyme then catalyzes a reaction that, in the example below, splits the substrate into two parts. The products of this reaction are released and the enzyme returns to its native or original shape. It is then ready to catalyze another reaction. The figure and video below nicely illustrate the function of an enzyme.
Figure 2.242 The function of enzymes2
Required Web Link
Enzymes’ names commonly end in -ase, and many are named for their substrate. For example, the enzyme amylase cleaves bonds found in amylose and amylopectin.
Hormones
Many hormones are proteins. A hormone is a compound that is produced in one tissue, released into circulation, then has an effect on a different organ. Most hormones are produced from several organs, collectively known as endocrine organs. Insulin is an example of a hormone that is a protein.
Required Web Link
Fluid Balance
Proteins help to maintain the balance between fluids in the plasma and the interstitial fluid. Interstitial fluid is the fluid that surrounds cells. Interstitial fluid and plasma (fluid part of blood) are the two components of extracellular fluid, or the fluid outside of cells. The following figure illustrates the exchange of fluid between interstitial fluid and plasma.
30
Figure 2.243 Interstitial Fluid and plasma3
Acid-Base Balance
Proteins serve as buffers, meaning that they help to prevent the pH of the body from getting too high or too low.
Transport
Transport proteins move molecules through circulation or across cell membranes. One example is hemoglobin that transports oxygen through the body. We will see a number of other examples as we move through class.
Immune Function
Antibodies are proteins that recognize antigens (foreign substances that generate antibody or inflammatory response) and bind to and inactivate them. Antibodies are important in our ability to ward off disease.
Other Functions
Proteins can also serve as neurotransmitters and can be used for energy by forming glucose through gluconeogenesis.
References & Links
31
Videos
Enzymes - http://www.youtube.com/watch?v=cbZsXjgPDLQ Hormones - http://www.youtube.com/watch?v=kIPYVV4aThM
Types of Amino Acids
There are 20 amino acids our body uses to synthesize proteins. These amino acids can be classified as essential, non-essential, or conditionally essential. The table below shows how the 20 amino acids are classified.
Table 2.251 Essential, conditionally essential, and nonessential amino acids1
Essential | Conditionally Essential | Non-essential |
Histidine | Arginine | Alanine |
Isoleucine | Cysteine | Asparagine |
Leucine | Glutamine | Aspartic Acid or Aspartate |
Lysine | Glycine | Glutamic Acid or Glutamate |
Methionine | Proline | Serine |
Phenylalanine | Tyrosine | |
Threonine | ||
Tryptophan | ||
Valine |
The body cannot synthesize nine amino acids. Thus, it is essential that these are consumed in the diet. As a result, these amino acids are known as essential amino acids, or indispensable amino acids. As an example of how amino acids were determined to be essential, Dr. William C. Rose at the University of Illinois discovered that threonine was essential by feeding different diets to graduate students at the university as described in the following link.
Required Web Link
Discovery of Threonine by William C. Rose
Non-essential, or dispensable, amino acids can be made in our body, so we do not need to consume them. Conditionally essential amino acids become essential for individuals in certain situations. An example of a condition when an amino acid becomes essential is the disease phenylketonuria (PKU). Individuals with PKU have a mutation in the enzyme phenylalanine hydroxylase, which normally adds an alcohol group (OH) to the amino acid phenylalanine to form tyrosine as shown below.
32
Figure 2.251 Phenylketonuria (PKU) results from a mutation in the enzyme phenylalanine hydroxylase2,3
Since tyrosine cannot be synthesized by people with PKU, it becomes essential for them. Thus, tyrosine is a conditionally essential amino acid. Individuals with PKU have to eat a very low protein diet and avoid the alternative sweetener aspartame, because it can be broken down to phenylalanine. If individuals with PKU consume too much phenylalanine, phenylalanine and its metabolites, can build up and cause brain damage and severe mental retardation. The drug Kuvan was approved for use with PKU patients in 2007 who have low phenylalanine hydroxylase activity levels. You can learn more about this drug using the link below.
Required Web Link
References & Links
Links
Discovery of Threonine by William C. Rose - http://www.jbc.org/content/277/37/e25.full Kuvan - http://www.kuvan.com/
33
Amino Acid Structures
It is a good idea to have a general idea of the structure of the different amino acids and to be able to recognize them as amino acids. You are not expected to memorize these structures.
Often, I’ll say the name of particular amino acids, and many students aren’t aware that it’s an amino acid. For example, around Thanksgiving, many of us have heard about tryptophan associated with turkey, but how many people know that tryptophan is actual a single amino acid?
Structurally, all amino acids have nearly the same base structure. They are all composed of an
-carbon, an amino group, a carboxyl group, and a side chain.
Figure 2.261 Basic structure for all amino acids1
Each amino acid differs only by its side chain, as show in Figure 2.262 (on the next page). Notice how the only difference between each amino acid is in its side chain (highlighted in pink.)
You may hear someone talk about the branched-chain amino acids (BCAAs), which are a common nutritional supplement. While their effect on athletic performance is in question, BCAAs provide several metabolic and physiologic roles2. Metabolically, BCAAs promote protein synthesis and turnover, signaling pathways, and metabolism of glucose. Additionally, the oxidation of BCAAs may increase fatty acid oxidation and play a role in obesity.
Physiologically, BCAAs take on roles in the immune system and in brain function3. Of the 20 amino acids found in the human body, only isoleucine, leucine, and valine are classified as BCAAs.
34
Figure 2.262 Amino acid structures for the 20 amino acids found in the human body1
References & Links
35
Protein Quality
Proteins can be classified as either complete or incomplete. Complete proteins provide adequate amounts of all nine essential amino acids. Animal proteins such as meat, fish, milk, and eggs are good examples of complete proteins. Incomplete proteins do not contain adequate amounts of one or more of the essential amino acids. For example, if a protein doesn't provide enough of the essential amino acid leucine it would be considered incomplete. Leucine would be referred to as the limiting amino acid, because there is not enough of it for the protein to be complete. Most plant foods are incomplete proteins, with a few exceptions such as soy. The table below shows the limiting amino acids in some plant foods.
Table 2.271 Limiting amino acids in some common plant foods1
Food | Limiting Amino Acid(s) |
Bean and Most Legumes | Methionine, Tryptophan |
Tree Nuts and Seeds | Methionine, Lysine |
Grains | Lysine |
Vegetables | Methionine, Lysine |
Complementary Proteins
Even though most plant foods do not contain complete proteins, it does not mean that they should be sworn off as protein sources. It is possible to pair foods containing incomplete proteins with different limiting amino acids to provide adequate amounts of the essential amino acids. These two proteins are called complementary proteins, because they supply the amino acid(s) missing in the other protein. A simple analogy would be that of a 4 piece puzzle. If one person has 2 pieces of a puzzle, and another person has 2 remaining pieces, neither of them have a complete puzzle. But when they are combined, the two individuals create a complete puzzle.
Figure 2.271 Complementary proteins are kind of like puzzle pieces
36
Two examples of complementary proteins are shown below.
Peanut Butter and Jelly Sandwich Red Beans and Rice
Figure 2.272 Two complementary protein examples2,3
It should be noted that complementary proteins do not need to be consumed at the same time or meal. It is currently recommended that essential amino acids be met on a daily basis, meaning that if a grain is consumed at one meal, a legume could be consumed at a later meal, and the proteins would still complement one another4.
Measures of Protein Quality
How do you know the quality of the protein in the foods you consume? The protein quality of most foods has been determined by one of the methods below.
Biological Value (BV) - (grams of nitrogen retained / grams of nitrogen absorbed) x 100
Protein Efficiency Ratio (PER) - (grams of weight gained / grams of protein consumed) This method is commonly performed in growing rats.
Chemical or Amino Acid Score (AAS) - (Test food limiting essential amino acid (mg/g protein) / needs of same essential amino acid (mg/g protein))
Protein Digestibility Corrected Amino Acid Score (PDCAAS) - (Amino Acid Score x Digestibility) This is the most widely used method and was preferred by the Food and Agriculture Organization and World Health Organization (WHO) until recently5,6.
37
The following table shows the protein quality measures for some common foods. Table 2.272 Measures of protein quality5
Protein | PER | Digestibility | AAS (%) | PDCAAS |
Egg | 3.8 | 98 | 121 | 100* |
Milk | 3.1 | 95 | 127 | 100* |
Beef | 2.9 | 98 | 94 | 92 |
Soy | 2.1 | 95 | 96 | 91 |
Wheat | 1.5 | 91 | 47 | 42 |
*PDCAAS scores are truncated (cut off) at 100. These egg and milk scores are actually 118 and 121 respectively.
The Food and Agricultural Organization (FAO) recently recommended that PDCAAS be replaced with a new measure of protein quality, the Digestible Indispensable Amino Acid Score (DIAAS). “DIAAS is defined as: DIAAS % = 100 x [(mg of digestible dietary indispensable amino acid in 1 g of the dietary protein) / (mg of the same dietary indispensable amino acid in 1g of the reference protein)].” Ideal digestibility should be utilized to determine the digestibility in DIAAS; ideally in humans, but if not possible in growing pigs or rats6.
The main differences between DIAAS and PDCAAS are:
How do I find out the protein quality of what I'm eating and identify complementary proteins?
Nutrition Data is a useful resource for determining protein quality and identifying complementary proteins. To use the site, go to www.nutritiondata.com, type in the name of the food you would like to know about in the search bar and hit ‘Enter’. When you have selected your food from the list of possibilities, you will be given information about this food.
Included in this information is the Protein Quality section. This will give you an amino acid score and a figure that illustrates which amino acid(s) is limiting. If your food is an incomplete protein, you can click "Find foods with a complementary profile". This will take you to a list of dietary
38
choices that will provide complementary proteins for your food. You can read more about this option in the link below.
Required Web Link
Nutrition Data: Protein Quality
References & Links
Links
NutritionData - http://www.nutritiondata.com/
NutritionData: Protein Quality - http://nutritiondata.self.com/help/analysis-help#protein-quality
Protein-Energy Malnutrition
Protein deficiency rarely occurs alone. Instead it is often coupled with insufficient energy intake. As a result, the condition is called protein-energy malnutrition (PEM). This condition is not common in the U.S., but is more prevalent in less developed countries. Kwashiorkor and marasmus are the two forms of protein energy malnutrition. They differ in the severity of energy deficiency as shown in the figure below.
39
Figure 2.281 The 2 types of protein-energy malnutrition
Kwashiorkor is a Ghanaian word that means "the disease that the first child gets when the new child comes1." The characteristic symptom of kwashiorkor is a swollen abdomen. Energy intake could be adequate, but protein consumption is too low.
Figure 2.282 A child suffering from kwashiorkor2
The video below does a nice job showing the symptoms of the condition.
Required Web Link
40
Marasmus means "to waste away" or "dying away", and thus occurs in individuals who have severely limited energy intakes.
Figure 2.283 Two individuals suffering from marasmus3
The video below shows individuals suffering from this condition.
Required Web Link
References & Links
Videos
Kwashiorkor - http://www.youtube.com/watch?v=eTU3iPWAWXg Marasmus - https://www.youtube.com/watch?v=LDCi3eda4WM
Lipids
Lipids, commonly referred to as fats, have a poor reputation among some people, in that "fat free" is often synonymous with healthy. We do need to consume certain fats and we should try to incorporate some fats into our diets for their health benefits. However, consumption of certain fats is also associated with greater risk of developing chronic disease(s). In this section, we will dive deeper into fats and why they do not need to be feared altogether.
41
Subsections:
How Does Fat Differ from Lipids?
The answer you receive from this question will depend on who you ask, so it is important to have an understanding of lipids and fats from a chemical and nutritional perspective.
To a chemist, lipids consist of:
These compounds are grouped together because of their structural and physical property similarities. For instance, all lipids have hydrophobic (water-fearing) properties. Chemists further separate lipids into fats and oils based on their physical properties at room temperature:
Fats are solid at room temperature
Oils are liquid at room temperature
From a nutritional perspective, the definition of lipids is the same. The definition of a fat differs, however, because nutrition-oriented people define fats based on their caloric contribution rather than whether they are solid at room temperature. Thus, from a nutrition perspective:
Fats are triglycerides, fatty acids, and phospholipids that provide 9 kcal/g.
The other difference is that from a caloric perspective, an oil is a fat. For example, let's consider olive oil. Clearly, it is an oil according to a chemist definition, but from a caloric standpoint it is a fat because it provides 9 kcal/g.
42
The following sections will discuss the different lipid classes introduced above in detail.
No References
Fatty acids are lipids themselves, and they are also components of triglycerides and phospholipids. Like carbohydrates, fatty acids are made up of carbon (C), hydrogen (H), and oxygen (O).
On one end of a fatty acid is a methyl group (CH3) that is known as the methyl or omega end. On the opposite end of a fatty acid is a carboxylic acid (COOH). This end is known as the acid or alpha end. The figure below shows the structure of fatty acids.
Figure 2.321 Structure of a saturated fatty acid
There are a number of fatty acids in nature that we consume that differ from one another in three ways:
Fatty acids differ in their carbon chain length (number of carbons in the fatty acid). Most fatty acids contain somewhere between 4-24 carbons, with even numbers (i.e. 8, 18) of carbons occurring more frequently than odd numbers (i.e. 9, 19). Fatty acids are classified as short-chain fatty acids, medium-chain fatty acids, and long-chain fatty acids based on their carbon chain length using the criteria shown in the table below.
43
Table 2.321 Fatty acid classification
Classification | # of carbons |
Short-Chain Fatty Acid | < 6 |
Medium-Chain Fatty Acid | 6-10 |
Long-Chain Fatty Acid | ≥12 |
Carbon chain length also impacts the physical properties of the fatty acid. As the number of carbons in a fatty acid chain increases, so does the melting point. Shorter chain fatty acids are more likely to be liquid, while longer chain fatty acids are more likely to be solid at room temperature (20-25oC, 68-77oF).
Saturation/Unsaturation
A saturated fatty acid is one that contains the maximum number of hydrogens possible, and no carbon-carbon double bonds. Carbon normally has four bonds to it. Thus, a saturated fatty acid has hydrogens at every position except carbon-carbon single bonds and carbon-oxygen bonds on the acid end.
Unsaturation means the fatty acid doesn't contain the maximum number of hydrogens on each of its carbons. Instead, unsaturated fatty acids contain a carbon-carbon double bond and only 1 hydrogen off each carbon. The simplest example of unsaturation is a monounsaturated fatty acid. Mono means one, so these are fatty acids with one degree of unsaturation, or one double bond.
Any fatty acid that has two or more double bonds is considered a polyunsaturated fatty acid. As you may remember from the polysaccharide section, poly means many. A simple example of a polyunsaturated fatty acid is linoleic acid (shown below).
44
Figure 2.322 Structure of saturated, monounsaturated, and polyunsaturated fatty acid2.
Double Bond Configuration (Shape)
Double bonds in unsaturated fatty acids are in one of two structural orientations: cis or trans. In a trans orientation, the hydrogens on the carbons involved in the double bond are opposite of one another. In the cis orientation, the hydrogens are on the same side of the bond. Steric hindrance in the cis orientation causes the chain to take on a more bent shape.
45
Figure 2.323 Cis and trans structural conformations of a monounsaturated fatty acid
Most natural unsaturated fatty acids are in the cis conformation. As can be seen in Figure 2.327, the cis fatty acids have a more of kinked shape, which means they do not pack together as well as the saturated or trans fatty acids. As a result, the melting point is much lower for cis fatty acids compared to trans and saturated fatty acids.
There are some naturally occurring trans fatty acids, such as conjugated linoleic acid (CLA), in dairy products. However, for the most part, trans fatty acids in our diets are not natural; instead, they have been produced synthetically. The primary source of trans fatty acids in our food supply is partially hydrogenated vegetable oil. The 'hydrogenated' means that the oil has gone through the process of hydrogenation. Hydrogenation, like the name implies, is the addition of hydrogen. If an unsaturated fatty acid is completely hydrogenated it would be converted to a saturated fatty acid as shown in Figure 3.324.
46
Figure 2.324 Fatty acid hydrogenation
However, complete hydrogenation isn't/wasn't always desirable, thus partially hydrogenated vegetable oil became widely used. To visualize the difference in the amount of hydrogenation consider the difference between tub margarine and stick margarine.
Stick margarine is more fully hydrogenated giving it a more solid texture. This is one of the two reasons to hydrogenate, to get a more solid texture. The second reason is that it makes it more shelf-stable, because the double bond(s) of unsaturated fatty acids are susceptible to oxidation, which causes them to become rancid.
Partial hydrogenation causes the conversion of cis to trans fatty acids along with the formation of some saturated fatty acids. Originally, it was thought that trans fatty acids would be a better alternative to saturated fat (think margarine vs. butter). However, it turns out that trans fat is actually worse than saturated fat in altering biomarkers associated with cardiovascular disease. Trans fat increases LDL and decreases HDL levels, while saturated fat increased LDL without altering HDL levels. But this does not mean that butter is a better choice than margarine as described in the first link. The FDA revoked Generally Recognized as Safe (GRAS) status of partially hydrogenated vegetable oil as described in the second link, and is requiring its use to be phased out by 2018. After that point, permission will need to be requested to use them in foods.
Required Web Links
Butter vs. Margarine: Which is better for my heart? FDA to Limit Trans Fats in Foods
47
References & Links
Links
Butter vs. Margarine: Which is better for my heart? - http://www.mayoclinic.org/butter-vs-margarine/expert- answers/FAQ-20058152
FDA to Limit Trans Fats in Foods - http://www.nbcnews.com/health/health-news/fda-limit-trans-fats-food- n376266
Fatty Acid Naming & Food Sources
We will look at two naming systems used for fatty acids:
Omega Nomenclature
For omega nomenclature, you need to know 3 things:
We will again consider the same fatty acid.
Figure 2.331 Omega Nomenclature
48
Instead of an omega prefix as seen in the figure, the prefix n- (i.e. n-9) is also commonly used. Therefore, the fatty acid in Figure 2.331 would be named 18:1 n-9.
If naming a saturated fatty acid, then the omega nomenclature is not added to the end of the name. If it is an 18-carbon saturated fatty acid, then it would be named 18:0.
Common Names
The common names of fatty acids are something that, for the most part, have to be learned/memorized. The common name of the fatty acid we have been naming in this section is oleic acid.
Figure 2.332 Oleic acid
However, it can also be called oleate. The only difference is that it has been ionized to form a salt (shown below; there is now a charge on the red oxygen atom). This is what the -ate ending indicates and the two names are used interchangeably.
49
Figure 2.333 Oleate
The table below gives the common names and food sources of some common fatty acids. Table 2.331 Common names of fatty acids2
Omega Name | Common Name |
4:0 | Butyric Acid |
12:0 | Lauric Acid |
14:0 | Myristic Acid |
16:0 | Palmitic acid |
18:0 | Stearic Acid |
20:0 | Arachidic Acid |
24:0 | Lignoceric Acid |
18:1 (n-9) | Oleic Acid |
18:2 (n-6) | Linoleic Acid |
18:3 (n-3) | Alpha-linolenic Acid |
20:4 (n-6) | Arachidonic Acid |
20:5 (n-3) | Eicosapentanoic Acid |
22:6 (n-3) | Docosahexanoic Acid |
The NutritionData link below can help you identify foods that are high in a specific fatty acid.
Required Web Link
50
Food Sources of Fatty Acids
After going through this wide array of fatty acids, you may be wondering where they are found in nature. The figure below shows the fatty acid composition of certain oils and oil-based foods. As you can see, most foods contain a mixture of fatty acids. Stick margarine is the only product in the figure that contains an appreciable amount of trans fatty acids. Corn, walnut, and soybean are rich sources of n-6 polyunsaturated fatty acids (a.k.a. omega-6 fatty acids), while flax seed is fairly unique among plants in that it is a good source of n-3 polyunsaturated fatty acids (a.k.a. omega-3 fatty acids). Canola and olive oil are rich sources of monounsaturated fatty acids. Lard, palm oil, butter and coconut oil all contain a significant amount of saturated fatty acids.
Figure 2.335 Fatty acid composition of foods and oils3
References & Links
Links
Nutrition Data: Fatty Acids - http://nutritiondata.self.com/topics/fatty-acids
51
Essential Fatty Acids & Eicosanoids
The two essential fatty acids are:
linoleic acid (omega-6 fatty acid)
These fatty acids are essential because we cannot synthesize them. This is because we do not have an enzyme capable of adding a double bond (desaturating) beyond the omega-9 carbon counting from the alpha end (the omega-6 and 3 positions). The structures of the two essential fatty acids are shown below.
Figure 2.341 Linoleic acid1
Figure 2.342 Alpha-linolenic acid2
However, we do possess enzymes that can take the essential fatty acids, elongate them (add two carbons to them), and then further desaturate them (add double bonds) to other omega-6 and omega-3 fatty acids. Thus, there are 2 families of fatty acids that the majority of polyunsaturated fatty acids fit into as shown below.
The same enzymes are used for both omega-6 and omega-3 fatty acids. However, we cannot convert omega-3 fatty acids to omega-6 fatty acids, or omega-6 fatty acids to omega-3 fatty acids. Among these families, the omega-3 fatty acid, eicosapentaenoic acid (EPA), and the omega-6 fatty acids, dihomo-gamma-linolenic acid (DGLA) and arachidonic acid (AA), are used to form compounds known as eicosanoids. These 20 carbon fatty acid derivatives are biologically active in the body (like hormones, but they act locally in the tissue they are produced).
52
There are four classes of eicosanoids:
The difference in the effects and outcomes of omega-6 and omega-3 fatty acid intake is primarily a result of the eicosanoids produced from them. Omega-6 fatty acid derived eicosanoids are more inflammatory than omega-3 fatty acid derived eicosanoids. As a result, omega-3 fatty acids are considered anti-inflammatory because replacing the more inflammatory omega-6 fatty acid derived eicosanoids with omega-3 fatty acid derived eicosanoids will decrease inflammation
You have probably heard that you should get more omega-3s in your diet, and in general polyunsaturated fatty acids are considered healthy. However, since omega-3 fatty acids are competing for the same enzymes as omega-6 fatty acids, and because the omega-6 fatty acids are more inflammatory, consuming too many omega-6s is probably more detrimental than helpful. As a result, many people talk about the omega-3:6 fatty acid ratio in peoples' diets. For most Americans, the ratio is believed to be too high, at almost 10-20 times more omega-6 fatty acids than omega-3 fatty acids10. The table below shows good food sources of some selected omega-3 and omega-6 fatty acids.
Table 2.341 Good food sources of selected omega-3 and omega-6 fatty acids
Fatty Acid | Good Food Sources |
Linoleic Acid (LA, n-6) | Safflower Oil, Corn Oil, Sunflower Oil |
Arachidonic Acid (AA, n-6) | Eggs, Meat |
Alpha-Linolenic Acid (ALA, n-3) | Walnuts, Flaxseed (linseed), Canola (rapeseed), and Soybean Oils |
Eicosapentaenoic Acid (EPA, n-3) | Fatty Fish & Fish Oils |
Docosahexanoic Acid (DHA, n-3) | Fatty Fish & Fish Oils |
53
Essential Fatty Acid Deficiency
Essential fatty acid deficiency is rare and unlikely to occur, but the symptoms include:
References & Links
Links
Fish Oil Claims Not Supported by Research - http://well.blogs.nytimes.com/2015/03/30/fish-oil-claims-not- supported-by-research/
Triglycerides
Triglycerides are the most common lipid in our bodies and in the foods we consume. Fatty acids are not typically found free in nature, instead they are found in triglycerides. Breaking down the name triglyceride tells a lot about their structure. "Tri" refers to the three fatty acids, "glyceride" refers to the glycerol backbone that the three fatty acids are bonded to. Thus, a monoglyceride contains one fatty acid, a diglyceride contains two fatty acids. Triglycerides perform the following functions in our bodies:
54
A triglyceride is formed by three fatty acids being bonded to glycerol as shown below.
Figure 2.351 Triglyceride formation
When a fatty acid is added to the glycerol backbone, this process is called esterification. This process is so named, because it forms an ester bond between each fatty acid and the glycerol. Three molecules of water are also formed during this process as shown below.
Figure 2.352 Esterification of three fatty acids to glycerol
A stereospecific numbering (sn) system is used to number the three fatty acids in a triglyceride sn-1, sn-2, and sn-3 respectively. A triglyceride can also be simply represented as a polar (hydrophilic) head, with 3 nonpolar (hydrophobic) tails, as shown in Figure 2.353.
55
Figure 2.353 Stereospecific numbering (sn) of triglycerides
The three fatty acids in a triglyceride can be the same or can each be a different fatty acid. A triglyceride containing different fatty acids is known as a mixed triglyceride. An example of a mixed triglyceride is shown below.
Figure 2.354 Structure of a mixed triglyceride
No References
56
Phospholipids
Phospholipids are similar in structure to triglycerides, with the only difference being a phosphate group and nitrogen-containing compound in the place of a fatty acid.
Figure 2.361 Structure of a phospholipid, R represents the different fatty acids, X represents the nitrogen-containing compound off of the phosphate group1
The best-known phospholipid is phosphatidylcholine (a.k.a. lecithin). As you can see in the structure below, it contains a choline off of the phosphate group.
Figure 2.362 Structure of phosphatidylcholine (lecithin)
However, you will not normally find phospholipids arranged like a triglyceride, with the 3 tails opposite of the glycerol head. This is because the phosphate/nitrogen tail of the phospholipid is polar. Thus, the structure will look like those in Figures 2.363 & 2.364.
57
Figure 2.363 Structure of phosphatidylcholine (lecithin)2
Figure 2.364 Structure of phosphatidylcholine (lecithin)3
Similar to triglycerides, phospholipids are also represented as a hydrophilic head with two hydrophobic tails as shown below.
Figure 2.365 Schematic of a phospholipid
Phospholipid Functions
Because its structure allows it to be at the interface of water-lipid environments, there are two main functions of phospholipids:
58
Number 1 in the figure below is a cell's lipid bilayer, while 2 is a micelle that is formed by phospholipids to assist in emulsification.
Figure 2.366, 1 - lipid bilayer, 2 - micelle4
Key Component of Cells' Lipid Bilayers
Phospholipids are an important component of the lipid bilayers of cells. A cross section of a lipid bilayer is shown below. The hydrophilic heads are on the outside and inside of the cell; the hydrophobic tails are in the interior of the cell membrane.
Figure 2.367 Phospholipids in a lipid bilayer. The blue represents the watery environment on both sides of the membrane, while the dark green represents the hydrophobic environment in between the membranes5
59
Emulsification
As emulsifiers, phospholipids help hydrophobic substances mix in a watery environment. It does this by forming a micelle as shown below. The hydrophobic substance is trapped on the interior of the micelle away from the aqueous environment.
Figure 2.368 Structure of a micelle6
As a result, it can take a hydrophobic liquid (oil) and allow it to mix with hydrophilic liquid (water).
In a practical sense, the micelle is an ideal transportable particle for our blood stream. Since our blood is an aqueous solution, transport of nonpolar (hydrophobic) substances, like fat, cholesterol and fat-soluble vitamins (like vitamin D), can be a problem. The solution: micelles can function like tiny delivery trucks, transporting nonpolar substances through our circulatory system to our cells as they are needed.
60
Figure 2.369 How an emulsion can allow the dispersion of a hydrophobic substance (II) into a hydrophilic environment (I) as shown in D7
Foods rich in phosphatidylcholine include: egg yolks, liver, soybeans, wheat germ, and peanuts8. Egg yolks serve as an emulsifier in a variety of recipes. However, your body can make all the phospholipids that it needs, so they do not need to be consumed (not essential).
References & Links
61
Sterols
The last category of lipids are the sterols. Their structure is quite different from the other lipids because sterols are made up of a number of carbon rings. The generic structure of a sterol is shown below.
Figure 2.371 Generic structure of a sterol
The primary sterol that we consume is cholesterol. The structure of cholesterol is shown below.
Figure 2.372 The carbon ring structure of cholesterol1
Cholesterol is frequently found in foods as a cholesterol ester, meaning that there is a fatty acid attached to it. The structure of a cholesterol ester is shown below.
Figure 2.373 Structure of a cholesterol ester
62
All sterols have a similar structure to cholesterol. Cholesterol is only found in foods of animal origin. If consumers were more knowledgeable, intentionally misleading practices, such as
labeling a banana “cholesterol free”, would not be as widespread as they currently are today.
Function
Although cholesterol has acquired the status of a nutritional "villain", it is a vital component of cell membranes, and is used to produce vitamin D, hormones, and bile acids. However, we do not need to consume any cholesterol from our diets (not essential) because our bodies have the ability to synthesize the required amounts. The figure below gives you an idea of the cholesterol content of a variety of foods.
Figure 2.374 The cholesterol content (mg) of foods4
There is neither bad nor good cholesterol, despite these descriptions being commonly used for LDL and HDL, respectively. Cholesterol is cholesterol. HDL and LDL contain cholesterol but are actually lipoproteins that will be described later in chapter 4.
References & Links
63
Chapter 3: Macronutrient Digestion
You probably do not think too much about what actually happens to the food you eat. This section will describe in depth how what you eat is digested. The desired end result for the learner will be an integrated understanding of the process. This will require higher levels of thinking, but will prove to be well worth it in the end.
Sections:
No References
Digestion is the process of breaking down food to be absorbed or excreted. There are two types of digestion in the body; mechanical and chemical. Mechanical digestion involves physically breaking food down into smaller pieces, usually through muscle contractions.
Chemical digestion uses enzymes or other chemicals to break of food into smaller nutrients. This generally involves the breaking of chemical bonds in the process.
Figure 3.11 A number of organs are involved in digestion, which collectively are referred to as the digestive system1.
Required Web Link
The gastrointestinal (GI or digestive) tract, the passageway through which our food travels, is a "tube within a tube." The trunk of our body is the outer tube and the GI tract is the interior tube, as shown below. Thus, even though the GI tract is within the body, the actual interior of the tract is technically outside of the body. This is because the contents have to be absorbed into the body. If it's not absorbed, it will be excreted and never enter the body itself. It’s as if you never consumed it.
Figure 3.12 The digestive tract, also known as the gastrointestinal tract, is a "tube within a tube"
The organs that form the gastrointestinal tract (e.g., mouth, esophagus, stomach, small intestine, large intestine (aka colon), rectum, and anus) come into direct contact with the food or digestive contents.
Figure 3.13 The gastrointestinal or digestive tract2
The journey through the gastrointestinal tract starts in the mouth and ends in the anus as shown below:
Mouth --> Esophagus --> Stomach --> Small Intestine --> Large Intestine --> Rectum --> Anus
In addition to the GI tract, there are a number of accessory organs (e.g. salivary glands, pancreas, gallbladder, and liver) that play an integral role in digestion. The accessory organs do not come directly in contact with food or digestive contents, but still play a crucial role in the digestive process.
Figure 3.14 Digestion accessory organs1
In addition to the digestive and accessory organs, there are a number of enzymes that are involved in digestion. We will go through each one in detail later, but this table should help give an overview of which enzymes are active at each location of the GI tract.
Location | Enzyme/Coenzyme |
Mouth | Salivary amylase Lingual lipase |
Stomach | Pepsin |
Pancreas Small Intestine | Pancreatic amylase Brush border disaccharidases Pancreatic lipase Phospholipase A2 Cholesterol esterase Proteases Brush border peptidases |
References & Links
Video
Enzymes and Digestion - http://www.youtube.com/watch?v=bNMsNHqxszc
Mouth to the Stomach
Digestion begins in the mouth, both mechanically and chemically. Mechanical digestion in the mouth consists of mastication, or the chewing and grinding of food into smaller pieces. The salivary glands release saliva, mucus, and three enzymes: salivary amylase, lingual lipase, and lysozyme.
Salivary amylase cleaves the glycosidic bonds in the starch molecules, amylose and amylopectin. Overall however, this enzyme accounts for a minor amount of carbohydrate digestion.
Lysozyme helps break down bacteria cell walls to prevent a possible infection. Another enzyme, lingual lipase, is also released in the mouth. Although it is released in the mouth, it is most active in the stomach where it preferentially cleaves short-chain fatty acids. Lingual lipase has a small role in digestion in adults, but may be important for infants to help break down triglycerides in breast milk2.
Swallowing (a.k.a Deglutition)
Now that the food has been thoroughly chewed and formed into a bolus (a small rounded mass of chewed food), it can proceed down the throat to the next stop in digestion. It will move down the pharynx where it reaches a "fork in the road", with the larynx as one road and the esophagus as the other. The esophagus road leads to the stomach; this is the direction that food should go (see figure 3.22). The other road, through the larynx, leads to the trachea and ultimately the lungs. This is definitely not where you want your food or drink going, as this is the pathway for the air you breathe.
Figure 3.22 Cross section of face. The epiglottis covers larynx to prevent food and drink from entering the lungs3
Fortunately, our body was designed in such a way that a small flap, called the epiglottis, covers the opening to the trachea during swallowing. It directs the food down the correct road as shown below.
Figure 3.23 Epiglottis is like a traffic cop guiding food down the correct digestion road.
Esophagus
Before being correctly guided into the esophagus, the bolus of food will travel through the upper esophageal sphincter. Sphincters are circular muscles that are found throughout the gastrointestinal tract that essentially serve as gates between the different sections. Once in the esophagus, wave-like muscular movements, known as peristalsis, occur, as shown in the animation and video in the links below. Peristalsis occurs throughout the digestive tract with the purpose of moving food along the tract.
Required Web Links Peristalsis Animation Video: Peristalsis (0:57)
At the end of the esophagus, the bolus will encounter the lower esophageal sphincter, also known as the cardiac sphincter due to its proximity to the heart. This sphincter keeps the harmful acids of the stomach out of the esophagus. However, in many people this sphincter is leaky, which allows stomach acid to reflux, or creep up, the esophagus. Stomach acid is very acidic (has a low pH). The ruler below will give you an idea of just how acidic the stomach is. Notice that the pH of gastric (term used to describe the stomach) fluid is lower (more acidic) than any of the listed items besides battery acid.
Figure 3.24 pH of some common items4
The leaking of the very acidic gastric contents results in a burning sensation commonly referred to as "heartburn." If this occurs more than twice per week and is severe, the person may have gastroesophageal reflux disease (GERD). The following videos explain more about these conditions.
Required Web Links Video: Acid Reflux (1:28) Video: GERD 101 (0.55)
Table 3.21 Review of Chemical Digestion in the Mouth
Macronutrient | Action |
Carbohydrates | Salivary amylase cleaves glycosidic bonds |
Lipids | Lingual lipase begins digestion of triglycerides |
Protein | None |
References & Links
Link
Peristalsis - http://en.wikipedia.org/wiki/File:Peristalsis.gif
Videos
Peristalsis Animation - http://www.youtube.com/watch?v=o18UycWRsaA Acid Reflux - https://www.youtube.com/watch?v=SW-QfyDSY5I
GERD 101 - http://www.youtube.com/watch?v=FqdOvZkrSYk&feature=rec-lis-watch-cur_emp- farside_rn
Stomach
After going through the lower esophageal sphincter, food enters the stomach. Our stomach is involved in both chemical and mechanical digestion. Mechanical digestion occurs as the stomach churns and grinds food into a semisolid substance called chyme (partially digested food).
There are four main regions in the stomach: the cardia, fundus, body, and pylorus (see Figure
3.31 below). The cardia (or cardiac region) is the point where the esophagus connects to the stomach and through which food passes into the stomach. Located inferior to the diaphragm, above and to the left of the cardia, is the dome-shaped fundus. Below the fundus is the body, the main part of the stomach. The funnel-shaped pylorus connects the stomach to the duodenum. The wider end of the funnel, the pyloric antrum, connects to the body of the stomach. The narrower end is called the pyloric canal, which connects to the duodenum. The smooth muscle pyloric sphincter is located at this latter point of connection and controls stomach emptying. In the absence of food, the stomach deflates inward, and its mucosa and submucosa fall into a large fold called a rugae6. These rugae increase the surface area inside the stomach, which aids the digestive process.
Figure 3.31 The stomach has four major regions: the cardia, fundus, body, and pylorus. The addition of an inner oblique smooth muscle layer gives the muscularis the ability to vigorously churn and mix food6.
The lining of the stomach is made up of four different layers of tissue. For the purposes of this discussion, we will focus on only the innermost layer. The mucosa is the innermost layer of the stomach (closest to stomach cavity) as shown in the figure below.
Figure 3.32 The anatomy of the stomach1
The mucosa is not a flat surface. Instead, its surface is lined by gastric pits, as shown in the figure 3.33 below.
Gastric pits are indentations in the stomach's surface that are lined by four different types of cells (see figure 3.34 for names and locations).
Figure 3.34 Blowup of mucosa to show the structure of gastric pits1
The following video is a nice introduction to gastric pits and talks about chief and parietal cells that are covered in more detail below.
Required Web Link
At the bottom of the gastric pit are the gastric enteroendocrine cells (G cells) that secrete the hormone gastrin. Gastrin stimulates the parietal and chief cells that are found above the G cells. The chief cells secrete the pepsinogen. Pepsinogen is the inactive precursor that must be altered to form the active enzyme, pepsin. The parietal cells secrete hydrochloric acid (HCl), which lowers the pH of the gastric juice (water + enzymes + acid). The HCl also inactivates salivary amylase and catalyzes the conversion of the inactive pepsinogen to its active form, known as pepsin. Finally, at the top of the pits are the neck cells (specialized goblet cells) that secrete mucus to prevent the gastric juice from digesting or damaging the stomach mucosa3. The table below summarizes the actions of the different cells in the gastric pits.
Table 3.41 Cells involved in the digestive processes in the stomach
Type of Cell | Secrete |
Neck (Goblet) | Mucus |
Chief | Pepsinogen |
Parietal | HCl |
G | Gastrin |
The figure below shows the action of all these different secretions in the stomach.
Figure 3.35 The action of gastric secretions in the stomach
To reiterate, the figure above illustrates that the neck cells of the gastric pits secrete mucus to protect the mucosa of the stomach from essentially digesting itself. Gastrin from the G cells stimulates the parietal and chief cells to secrete HCl and enzymes, respectively.
The HCl in the stomach denatures salivary amylase and other proteins by breaking down the structure and, thus, the function of it. HCl also converts pepsinogen to the active enzyme pepsin. Pepsin is a protease, meaning that it cleaves the peptide bonds in proteins. It breaks down the proteins in food into individual peptides (shorter segments of amino acids).
The chyme will then leave the stomach in small amounts and enter the small intestine via the pyloric sphincter (shown below). Full emptying of the stomach takes about 2-4 hours.
Figure 3.36 Cross section of the stomach showing the pyloric sphincter5
Table 3.32 Summary of chemical digestion in the stomach
Chemical or Enzyme | Action |
Gastrin | Stimulates chief cells to release pepsinogen Stimulates parietal cells to release HCl |
HCl | Denatures salivary amylase Denatures proteins Facilitates the conversion of pepsinogen to pepsin |
Pepsin | Cleaves proteins to peptides |
References & Links
Video
Gastric Pits - http://www.youtube.com/watch?v=6hquzCXYlNg
Small Intestine
The small intestine is the primary site of digestion. It is divided into three sections: the duodenum, jejunum, and ileum (shown below). After leaving the stomach, the first part of the small intestine that chyme will encounter is the duodenum.
Figure 3.41 Three sections of the small intestine1
The small intestine consists of many layers, which can be seen in the cross section in Figure 3.42 below.
Figure 3.42 Cross section of the small intestine2
Examining these layers more closely, we are going to focus on the lining of the small intestine, known as the epithelium (see Figure 3.42 above), which comes into contact with the chyme and is responsible for absorption. The lumen is the name of the cavity that is considered “outside
the body” that chyme moves through.
The organization of the small intestine is in such a way that it contains circular folds and finger- like projections known as villi. The folds and villi are shown in the next few figures.
Figure 3.43 Folds in the small intestine2
Figure 3.44 Villi in the small intestine3
Figure 3.45 Villi line the surface of the small intestine2,4
If we were to zoom in even closer, we would be able to see that enterocytes (small intestine absorptive cells; a.k.a brush border cells) line villi as shown below. This layer is referred to as the mucosa, and is composed primarily of simple columnar epithelium.
Figure 3.46 Enterocytes line villi4
The side, or membrane, of the enterocyte that faces the lumen is not smooth either. It is lined with microvilli, and is known as the brush border membrane, as shown below.
Figure 3.47 Enterocyte, or small intestinal absorptive cell is lined with microvilli. This lined surface is referred to as the brush border membrane.
Together these features (folds + villi + microvilli) increase the surface area ~600 times versus if it was a smooth tube5. (Note: the symbol ~ is used in place of the word “approximately.” You will see it used other places in this text as well.) More surface area leads to more contact between the chyme and the enterocytes, and thus, increased absorption.
Finally, the surface of the cells on the microvilli are covered with proteins, which helps to catch a molecule-thin layer of water within itself. This layer, called the "unstirred water layer," has a
number of functions in absorption of nutrients, and will have a direct impact on fat absorption as we will see later6.
Figure 3.48 Unstirred water layer
Now that you have learned about the anatomy of the small intestine, the following subsections go through the different digestive processes that occur there.
Subsections:
References & Links
Digestive Hormones, Accessory Organs & Secretions
Before we go into the digestive details of the small intestine, it is important that you have a basic understanding of the anatomy and physiology of the following digestion accessory organs: pancreas, liver, and gallbladder. Digestion accessory organs assist in digestion, but are not part of the gastrointestinal tract. How are these organs involved?
Upon entering the duodenum, the chyme causes the release of two hormones from the small intestine: secretin and cholecystokinin (CCK) in response to acid and fat, respectively. These
hormones have multiple effects on different tissues. In the pancreas, secretin stimulates the secretion of bicarbonate (HCO3), while CCK stimulates the secretion of digestive enzymes. The bicarbonate and digestive enzymes released together are collectively known as pancreatic juice, which travels to the small intestine, as shown below.
Figure 3.411 The hormones secretin and CCK stimulate the pancreas to secrete pancreatic juice1
In addition, CCK also stimulates the contraction of the gallbladder causing the secretion of stored bile into the duodenum.
Pancreas
The pancreas is found behind the stomach and just above the transverse colon (part of the large intestine discussed later in this chapter). It is a tadpole-shaped organ consisting of a head, body, and tail. It is a unique organ containing both endocrine and exocrine portions. The smaller, endocrine (hormone-producing) portions contain alpha, beta, delta, and PP cells that secrete the hormones glucagon, insulin, somatostatin, and pancreatic polypeptide respectively. These cells are clustered in groups known as pancreatic islets (traditionally referred to as the Islets of Langerhans). However, the vast majority of the pancreas is made up of grape-like clusters of exocrine cells known as acini (singular = acinus). The cells composing each acinus are known as acinar cells. These acinar cells are responsible for producing enzyme-rich pancreatic juice. Pancreatic juice is released into small ducts that continually merge to form a large main pancreatic duct which delivers pancreatic juice from the pancreas to the duodenum, merging with the common bile duct (from the liver & gallbladder) along the way. The release of pancreatic juice, and bile, is controlled by the hepatopancreatic sphincter. The following video does a nice job of showing and explaining the function of the different pancreatic cells.
Figure 3.412 The pancreas has a head, a body, and a tail. It delivers pancreatic juice to the duodenum through the pancreatic duct5.
Required Web Link
Video: The Pancreas (First 53 seconds)
In addition to pancreatic hormones and enzymes, the pancreas releases bicarbonate. Bicarbonate is a base (high pH) meaning that it can help neutralize an acid (such as gastric juice.) You can find sodium bicarbonate (NaHCO3, baking soda) on the ruler below to get an idea of its pH.
Figure 3.413 pH of some common items2
The main digestive enzymes in pancreatic juice are listed in the table below. Their function will be discussed further in later subsections.
Table 3.411 Enzymes in pancreatic juice
Enzyme |
Pancreatic amylase |
Proteases |
Pancreatic Lipase |
Phospholipase A2 |
Cholesterol Esterase |
Liver
The liver is the largest internal, and the most metabolically active, organ in the body. The figure below shows the liver and the other accessory organs position relative to the stomach.
Figure 3.414 Location of digestion accessory organs relative to the stomach3
The liver is made up two major types of cells. The primary liver cells are hepatocytes, which carry out most of the liver’s functions. Hepatic is another term for liver. For example, if you are going to refer to liver concentrations of a certain nutrient, these are often reported as hepatic concentrations. The other major cell type is the hepatic stellate (also known as Ito) cells. These are fat storing cells in the liver.
The liver's major role in digestion is to produce bile. This is a greenish-yellow fluid that is composed primarily of bile acids, but also contains cholesterol, phospholipids, and the pigments bilirubin and biliverdin. Bile acids are synthesized from cholesterol. The two primary bile acids are chenodeoxycholic acid and cholic acid. In the same way that fatty acids are found in the form of salts, these bile acids can also be found as salts. Because of this, these bile salts are often seen in texts with an (-ate) ending (chenodeoxycholate and cholate) indicating they are in the salt form.
Bile acids, much like phospholipids, have both hydrophobic and hydrophilic portions. This makes them excellent emulsifiers that are instrumental in fat digestion. Bile is then transported to the gallbladder.
Gallbladder
The gallbladder is a small, sac-like organ found just off the liver (see figure 3.413 above). Its primary function is to store and concentrate bile made by the liver. The bile is then transported to the duodenum through the common bile duct.
Why do we need bile?
Bile is important because fat is hydrophobic, but the environment in the lumen of the small intestine is watery. In addition, there is an unstirred water layer that fat must cross to reach the enterocytes in order to be absorbed.
Figure 3.415 Fat is not happy alone in the watery environment of the small intestine.
Triglycerides naturally form large triglyceride droplets to keep the interaction with the watery environment to a minimum. Picture the large droplets of cooking oil that form when you add it to water. This is inefficient for digestion, because enzymes cannot access the interior of the droplet. Bile acts as an emulsifier, or detergent. It, along with phospholipids, breaks the large triglyceride droplets into smaller triglyceride droplets that increase the surface area accessible for triglyceride digestive enzymes, as shown below.
Figure 3.416 Bile acids and phospholipids facilitate the production of smaller triglyceride droplets.
Secretin and CCK also control the production and secretion of bile. Secretin stimulates the flow of bile from the liver to the gallbladder. CCK stimulates the gallbladder to contract, causing bile to be secreted into the duodenum, as shown in Figure 3.417.
Figure 3.417 Secretion stimulates bile flow from liver; CCK stimulates the gallbladder to contract3
References & Links
Video
The Pancreas - http://www.youtube.com/watch?v=j5WF8wUFNkI
Carbohydrate Digestion in the Small Intestine
The small intestine is the primary site of carbohydrate digestion. Pancreatic amylase is the primary carbohydrate digesting enzyme. Pancreatic amylase, like salivary amylase, cleaves the glycosidic bonds of carbohydrates, reducing them to simpler carbohydrates, such as glucose, maltose, maltotriose, and α-dextrin (an oligosaccharide containing 1 or more glycosidic bonds which pancreatic amylase unable to cleave1).
The pancreatic amylase products, along with the disaccharides sucrose and lactose, then move to the surface of the enterocyte.
Here, the brush border enzyme α-dextrinase starts working on α-dextrin, breaking off one glucose unit at a time. Three other brush border enzymes hydrolyze sucrose, lactose, and maltose into monosaccharides. Sucrase splits sucrose into one molecule of fructose and one molecule of glucose; maltase breaks down maltose into two glucose molecules; and lactase breaks down lactose into one molecule of glucose and one molecule of galactose2. Insufficient lactase can lead to lactose intolerance (discussed in a later chapter.) The products from these brush border enzymes are the single monosaccharides glucose, fructose, and galactose that are ready for absorption into the enterocyte1.
Figure 3.423 Disaccharidases on the outside of the enterocyte.
Figure 3.424 Carbohydrates are broken down into their monomers in a series of steps2.
References & Links
Protein Digestion in the Small Intestine
The small intestine is the major site of protein digestion by proteases (enzymes that cleave proteins). The pancreas secretes a number of proteases into the duodenum where they must be activated before they can cleave peptide bonds1. This activation occurs through an activation cascade. A cascade is a series of reactions in which one step activates the next in a sequence that results in an amplification of the response. An example of a cascade is shown below.
Figure 3.431 An example of a cascade, with one event leading to many more events
In the above example, A activates B, B activates C, D, and E, C activates F and G, D activates H and I, and E activates K and L. Cascades also help to serve as control points for certain process. In the protease cascade, the activation of B is really important because it starts the cascade.
The protease activation scheme starts with the enzyme enteropeptidase (secreted from the intestinal brush border) that converts trypsinogen (released by the pancreas) to trypsin. Trypsin can activate all the proteases (including itself) as shown in the 2 figures below.
Figure 3.432 Protease activation cascade
Figure 3.433 The protease activation cascade
The products of the action of the activated proteases on proteins are dipeptides, tripeptides, and individual amino acids, as shown below.
Figure 3.434 Products of pancreatic proteases
At the brush border, much like disaccharidases, there are peptidases that cleave some peptides down to amino acids. Not all peptides are cleaved to individual amino acid, because small
peptides can be taken up into the enterocyte, thus, the peptides do not need to be completely broken down to individual amino acids. Thus, the end products of protein digestion are primarily dipeptides and tripeptides, along with individual amino acids1.
Figure 3.435 Peptidases are produced by the brush border to cleave some peptides into amino acids
References & Links
1. Gropper SS, Smith JL, Groff JL. (2008) Advanced Nutrition and Human Metabolism. Belmont, CA: Wadsworth Publishing.
Lipid Digestion in the Small Intestine
The small intestine is the major site for lipid digestion. There are specific enzymes for the digestion of triglycerides, phospholipids, and the removal of esters from cholesterol. We will look at each in this section. Refer back to sections 2.35, 2.36, and 2.36 for a review of these structures.
Triglycerides
The pancreas secretes pancreatic lipase into the duodenum as part of pancreatic juice. This major triglyceride digestion enzyme preferentially cleaves two fatty acids from triglycerides. This cleavage results in the formation of a monoglyceride and two free fatty acids as shown in Figures 3.441 & 3.442.
Figure 3.441 Pancreatic lipase cleaves the sn-1 and sn-3 fatty acids of triglycerides
Figure 3.442 The products of pancreatic lipase are a 2-monoglyceride and two free fatty acids
Phospholipids
The enzyme phospholipase A2 cleaves the fatty acid of lecithin, producing lysolecithin and a free fatty acid. This is depicted in Figures 3.444 & 3.445.
Figure 3.444 Phospholipase A2 cleaves the C-2 fatty acid of lecithin
Figure 3.445 Products of phospholipase A2 cleavage
Cholesterol Esters
The fatty acid in cholesterol esters is cleaved by the enzyme, cholesterol esterase, producing cholesterol and a free fatty acid.
Figure 3.446 Cholesterol esterase cleaves fatty acids off of cholesterol
Figure 3.447 Products of cholesterol esterase
Formation of Mixed Micelles
If nothing else happened at this point, the monoglycerides and fatty acids produced by pancreatic lipase would form micelles. The hydrophilic heads would be outward and the fatty acids would be buried on the interior. These micelles are not sufficiently water-soluble to cross the unstirred water layer to get to the brush border of enterocytes. Thus, mixed micelles are formed containing cholesterol, bile acids, and lysolecithin in addition to the monoglycerides and fatty acids, as illustrated below1.
Figure 3.448 Normal (left) and mixed (right) micelles
Mixed micelles are more water-soluble, allowing them to cross the unstirred water layer to the brush border of enterocytes for absorption.
Figure 3.449 Mixed micelles can cross the unstirred water layer for absorption into the enterocytes
After digestion of carbohydrates, proteins, and fats is complete, the products below are ready for uptake into the enterocyte. This will be discussed in the next chapter.
Figure 3.55 Macronutrient digestion products ready for uptake into the enterocyte
References & Links
1. Gropper SS, Smith JL, Groff JL. (2008) Advanced nutrition and human metabolism. Belmont, CA: Wadsworth Publishing.
3.6 The Large Intestine
We have now reached a fork in the digestive road. We could follow the uptake of the digested compounds into the enterocyte or we could finish following what has escaped digestion and is going to continue into the large intestine. Obviously from the title of this section we are going to do the latter. As we learned previously, fiber is a crude term for what has survived digestion and has reached the large intestine.
Figure 3.61 The fork in the road between finishing digestion in the colon and absorption into the enterocyte
The ileocecal valve is the sphincter between the ileum (hence ileo- in ileocecal valve), and the large intestine. This name should make more sense as we go through the anatomy of the large intestine.
Figure 3.62 The ileocecal valve1
The large intestine consists of the colon, the rectum, and the anus. The colon can be further divided into the cecum (hence the -cecal in ileocecal valve), ascending colon, transverse colon, descending colon, and sigmoid colon as shown below.
Figure 3.63 Anatomy of the large intestine and rectum2
The large intestine is responsible for absorbing the remaining water and electrolytes (sodium, potassium, and chloride) in chyme. By removing water, the unabsorbed chyme is converted into a more solid form (feces) which is then excreted via defecation. The large intestine contains large amounts of microorganisms like those shown in the figure below.
Figure 3.64 Magnified image of bacteria3
The large intestine can also be referred to as the gut. There are a large number of microorganisms found throughout the gastrointestinal tract that collectively are referred to by a variety of names: flora, microflora, biota, or microbiota. Technically, microbiota is the preferred term because flora means "pertaining to plants". There are 10 times more microorganisms in the gastrointestinal tract than cells in the whole human body4. As can be seen in the figure below, the density of microorganisms increases as you move down the digestive tract.
Figure 3.65 Relative amounts of bacteria in selected locations of the GI tract. cfu/ml = colony forming unit, a measure of the number of live microorganisms in 1 mL of digestive sample5,6
As described in the fiber sections, there are two different fates for fiber once it reaches the large intestine. The fermentable, viscous fiber is fermented by bacteria. Fermentation is the metabolism of compounds by the microorganisms in the gut. An example of fermentation is the utilization of the oligosaccharides raffinose and stachyose by microorganisms that results in the production of gas, which can lead to flatulence. Additionally, some bile acids are fermented by microorganisms to form secondary bile acids that can be reabsorbed. These secondary bile acids represent approximately 20% of the total bile acids in our body. Fermentable fibers can also be used to form short-chain fatty acids that can then be absorbed and used by the body.
Conversely, the non-fermentable, non-viscous fiber is not really altered and will be a component of feces, that is then excreted through the rectum and anus via defecation. This process involves both an internal and external sphincter that are shown in figure 3.63 above.
References & Links
3.61 Probiotics & Prebiotics
Recently there has been increased attention given to the potential of a person's microbiota to impact health. This is because there are beneficial and non-beneficial bacteria inhabiting our gastrointestinal tracts. Thus, theoretically, if you can increase the beneficial, or decrease the non-beneficial bacteria, there may be improved health outcomes. In response to this, probiotics and prebiotics have been identified/developed. A probiotic is a live microorganism that is consumed, and colonizes in the body as shown in Figure 3.611.
Figure 3.611 Probiotics the consumption of the bacteria itself
A prebiotic is a non-digestible food component that selectively stimulates the growth of beneficial intestinal bacteria. An example of a prebiotic is inulin (this is not the same as, or related to, the hormone insulin that you may be familiar with), which is shown in the figure below.
Figure 3.612 Inulin, an indigestible food component that is a commonly used prebiotic The net result is the same for both prebiotics and probiotics, an improvement in the beneficial/non-beneficial bacteria ratio.
Figure 3.613 An effective prebiotic or probiotic should result in an increase in the beneficial bacteria
The following video does a nice job of explaining and illustrating how probiotics work. The NCCAM website is a good source of information if you have further questions on the topic.
Required Web Links Video: Probiotics (3:40) NCCAM: Probiotics
Some common examples of probiotic foods are sauerkraut, kimchi, kefir, and yogurts containing live cultures such as DanActive® and Activia®.
Required Web Links
It should be notes that the claims companies have made about their probiotic products have come under scrutiny. Dannon settled with the US Federal Trade Commission to drop claims that its probiotic products will help prevent colds or alleviate digestive problems, as seen in the top link below. General Mills also settled a lawsuit that accused them of a falsely advertising the digestive benefits of Yo-Plus, a product it no longer sells, as seen in the second link.
Required Web Link
New Campaign Markets Activia to Wider Audience General Mills Settles Yo-Plus Lawsuit
Some examples of prebiotics include the previously mentioned inulin, fructose-containing oligosaccharides and polysaccharides, and resistant starch. These are found in a number of foods including onions, leaks, sprouted whole grains, seeds, and berries.3
Resistant starch is so named because it is a starch that is resistant to digestion. As a result, it arrives in the colon to be fermented.
References & Links
Links
NCCAM: Probiotics - http://nccam.nih.gov/health/probiotics/ DanActive® - http://www.danactive.com/
Activia® - http://www.activia.us.com/
Danimals® - http://www.danimals.com/New Campaign Markets Activia to Wider Audience - http://www.nytimes.com/2014/01/06/business/media/new-campaign-markets-activia-to- wider-audience.html?_r=0
General Mills Settles Yo-Plus Lawsuit - http://www.foodbusinessnews.net/articles/news_home/Site_News/2013/02/General_Mills_se ttles_Yo-Plus.aspx?ID={40F62478-1AA4-49DF-9330-E41E19E946D0}&cck=1
Video
Probiotics - http://www.youtube.com/watch?v=2k8Puxz54FQ&NR=1
Chapter 4: Macronutrient Uptake, Absorption & Transport
The term absorption can have a number of different meanings. Not everything that is taken up into the enterocyte from the lumen of the GI tract will be absorbed, so the term uptake refers to compounds being transported into the enterocyte. Absorption means that a compound is transported from the enterocyte into the bloodstream for circulation throughout the body.
Under most circumstances, compounds that are taken up into the enterocytes will then be absorbed into the bloodstream. After this chapter, hopefully this distinction between these terms will be clear. After later micronutrient chapters, hopefully you will understand the reason for emphasizing this distinction.
Sections:
4.7 Glycemic Response, Insulin & Glucagon
Crypts of Lieberkuhn & Enterocyte Maturation
There are some additional anatomical and physiological features of the small intestine that are important to understand before defining uptake and absorption processes. Crypts of Lieberkuhn are pits located between the villi as pointed out by the green arrow in the figure below.
Figure 4.11 A crypt of Lieberkuhn is the pit between the villi in the small intestine as pointed out by the green arrow1
The crypts of Lieberkuhn (often referred to simply as crypts) are similar to the gastric pits in the stomach. The crypts contain stem cells at their bases that can produce a number of different cell types, including enterocytes2. From these stem cells, immature enterocyte cells are formed. As they mature, the enterocytes rise, or migrate up, the villi. Thus, the tips of villi are where the mature, fully functioning enterocytes are located, as represented by the purple cells in the figure below3.
Figure 4.12 Crypts are represented by green arrows, while fully mature enterocytes are represented by the purple cells at the top of the villi
This maturation and migration is a continuous process. The life cycle of an enterocyte is 72 hours once it enters the villus from the crypt2. At the top, enterocytes are sloughed off and, unless they are digested (they contain proteins and lipids) and components are taken up by enterocytes still on villi, they will be excreted in feces as depicted in the figure below.
Figure 4.13 Enterocytes sloughed off the villus. Unless these cells are digested and their components are taken up by other enterocytes on the villus, they will be excreted in feces.
Thus, we define absorption as reaching the bloodstream, because some compounds taken up into enterocytes will not always make it into the bloodstream. So remember, uptake is moving from the GI tract into the enterocyte, and absorption is moving from the enterocyte into the bloodstream.
References & Links
Uptake Lineup & Cell Membranes
Having completed digestion in the small intestine, a number of compounds are ready for uptake into the enterocyte. The figure below shows the macronutrient uptake lineup, or what is ready to be taken up into the enterocyte.
Figure 4.21 The macronutrient uptake lineup
From lipids, we have the lysolecithin (from phospholipid), 2-monoglyceride (from triglycerides), fatty acids, and cholesterol. From protein, there are small peptides (di- and tripeptides) and amino acids. From carbohydrates, only the monosaccharides glucose, galactose, and fructose will be taken up. The other macronutrient, water, has not been discussed so far because it does not undergo digestion.
In order to be taken up by the enterocytes, these compounds must now cross the cell (plasma) membrane, which is a phospholipid bilayer. In the cell membrane, the hydrophilic heads of the phospholipids point into the lumen of the GI tract, as well as towards the interior of the cell, while the hydrophobic tails are on the interior of the plasma membrane. This is depicted in the diagram below.
Figure 4.22 Plasma membrane of a cell
In addition to phospholipids, the cell membrane also contains proteins, cholesterol, and carbohydrates in addition to the phospholipids. Membrane proteins, such as channels, pumps, pores, and carriers are important for the transport of some compounds across the cell membrane. Figure 4.23 and two videos below do a nice job of illustrating the components of the cell membrane.
Figure 4.23 Cell membrane1
Required Web Links
Video: Voyage Inside the Cell: Membrane (1:23)
References & Links
1. http://en.wikipedia.org/wiki/File:Cell_membrane_detailed_diagram_4.svg
Videos
Cell Membrane - http://www.youtube.com/watch?v=owEgqrq51zY
Voyage Inside the Cell: Membrane - http://www.youtube.com/watch?v=GW0lqf4Fqpg
Transport Mechanisms Used for Uptake and Absorption
There are a number of different transport mechanisms utilized by your body for the uptake of nutrients into cells, and absorption into the bloodstream. These mechanisms can be classified as being either passive transport or active transport. The difference between the two types of transport is whether energy is required, and whether they move with or against a concentration gradient. Passive transport does not require energy and moves with a concentration gradient (high to low concentration). Active transport requires energy to move against the concentration gradient (low to high concentration).
A concentration gradient is a result of an unequal distribution of solutes within a solution. A solute is what is dissolved in a solvent in a solution. The more solute a region has, the higher the its concentration, while the less solute a region has, the lower the its concentration. Moving with the gradient is moving from a region of higher concentration to an area of lower concentration. Moving against the gradient is moving from an area of lower concentration to an area of higher concentration.
Figure 4.31 Movement with and against a concentration gradient.
Because our cells are surrounded by fluids containing varying amounts of solute, our body cells can experience concentration gradients across the plasma membrane. Hypertonic refers to a situation when the cell is surrounded by a solution that contains more solute than inside the cell. Hypotonic refers to a situation when the cell is surrounded by a solution containing less solutes than inside the cell. Isotonic refers to a situation when the cell is surrounded by a solution containing the same number of solutes that inside the cell. Figure 4.32 demonstrates these well.
Figure 4.32 Tonicity across the plasma membrane of cells.
The energy for active transport is provided by adenosine triphosphate (ATP), which is the energy currency in the body. Tri- means three, thus ATP is adenosine (composed of an adenine and a ribose) with three phosphate groups bonded to it, as shown below.
Figure 4.33 Structure of adenosine triphosphate (ATP)1
Phosphorylation is the formation of a phosphate bond. Dephosphorylation is the removal of a phosphate bond. Phosphorylation is an anabolic process that requires energy.
Dephosphorylation is a catabolic process that releases energy. Thus, energy is required to add phosphates to ATP, while energy is released through removing phosphates from ATP. Figure
Figure 4.34 The ATP Cycle demonstrating the processes of phosphorylation and dephosphorylation.
Subsections:
References & Links
Passive Transport Mechanisms
There are three forms of passive transport involved in uptake and absorption of nutrients in the body:
Simple Diffusion
Simple diffusion is the movement of solutes from an area of higher concentration to an area of lower concentration (with the concentration gradient) without the help of a protein, as shown
in Figure 4.311.
Figure 4.311 Simple diffusion
Osmosis
Osmosis is similar to simple diffusion, but water moves instead of solutes. In osmosis water molecules move from an area of lower solute concentration to an area of higher solute concentration as shown below. The effect of this movement is to dilute the area of higher concentration.
Figure 4.312 Osmosis
The following videos do a nice job of illustrating osmosis.
Required Web Links
Video: Osmosis in the Kitchen (0:58)
Another example illustrating osmosis is the red blood cells in different solutions shown below.
Figure 4.313 Effect of salt solution concentration on red blood cells1
We will consider the simple example of salt as the solute. If the solution is hypertonic, that means that there is a greater concentration of salt outside (extracellular) the red blood cells than within them (intracellular). Water will then move out of the red blood cells to the area of higher salt concentration, resulting in the shriveled red blood cells depicted. Isotonic means that there is no difference between concentrations. There is an equal exchange of water between intracellular and extracellular fluids. Thus, the cells are normal, functioning red blood cells. A hypotonic solution contains a lower extracellular concentration of salt than the red blood cell intracellular fluid. As a result, water enters the red blood cells, possibly causing them to burst.
Facilitated Diffusion
The last form of passive transport is similar to diffusion in that it also moves with the concentration gradient (higher concentration to lower concentration). While it requires no energy, it does require a carrier protein to transport the solute across the membrane. Figure
4.314 and Required Video Link do a nice job of illustrating facilitated diffusion.
Figure 4.314 Facilitated diffusion examples2
Required Web Link
Video: Facilitated Diffusion (0:27)
References & Links
1. http://en.wikipedia.org/wiki/File:Osmotic_pressure_on_blood_cells_diagram.svg 2.https://en.wikipedia.org/wiki/Facilitated_diffusion#/media/File:Scheme_facilitated_diffusion
_in_cell_membrane-en.svg
Videos
Osmosis - http://www.youtube.com/watch?v=sdiJtDRJQEc
Osmosis in the Kitchen - http://www.youtube.com/watch?v=H6N1IiJTmnc&NR=1&feature=fvwp
Facilitated Diffusion - http://www.youtube.com/watch?v=s0p1ztrbXPY
Active Transport Mechanisms
There are two forms of active transport:
Active Carrier Transport
Active carrier transport (sometimes referred to as secondary active transport) is similar to facilitated diffusion in that it utilizes a protein carrier. However, energy is also required to move compounds against their concentration gradient (lower to higher concentration). Figure 4.321 and video do a nice job of illustrating active carrier transport.
Figure 4.321 Sodium-potassium ATPase (aka sodium-potassium pump) an example of active carrier transport1
Required Web Link
Video: Active Transport (0:21)
Endocytosis
Endocytosis is the engulfing of particles, or fluids, to be taken up into the cell. If a particle is endocytosed, this process is referred to as phagocytosis. If a fluid is endocytosed, this process is referred to as pinocytosis. Whenever a receptor located on the membrane is used to assist in engulfing an extracellular component, it is known as receptor mediated endocytosis. These processes are shown in Figure 4.322.
Figure 4.322 Different types of endocytosis2
The following video does a really nice job of showing how endocytosis occurs.
Required Web Link
References & Links
Videos
Active Transport - http://www.youtube.com/watch?v=STzOiRqzzL4 Endocytosis - http://www.youtube.com/watch?v=4gLtk8Yc1Zc
Carbohydrate Uptake, Absorption, Transport & Liver Uptake
Monosaccharides (glucose, galactose, and fructose) are taken up into the enterocyte by two processes. Glucose and galactose are taken up by the sodium-glucose cotransporter 1 (SGLT1, active carrier transport). The cotransporter part of the name of this transporter means that it also transports sodium along with glucose or galactose. Fructose is taken up by facilitated diffusion through glucose transporter 5 (GLUT5). There are 12 glucose transporters that are named GLUT 1-12, and all use facilitated diffusion to transport various monosaccharides.
The different GLUTs have different functions and are expressed at high levels in different tissues. Thus, the intestine might be high in GLUT5, but not in GLUT12.
Once inside the enterocyte, all three monosaccharides are then transported out of the enterocyte and into capillaries or lacteals (absorption) through GLUT2 as shown in Figure 4.411.
Figure 4.41 Carbohydrate uptake and absorption
The capillaries and lacteals are located within each villus as shown below. Capillaries are the smallest blood vessels in the body, while lacteals are also small vessels but are part of the lymphatic system, as will be described further in a later subsection.
Figure 4.42 Anatomy of a villus2
The following video does a nice job of illustrating capillaries and lacteal and provides some basic detail on uptake into enterocytes and absorption into capillaries/lacteals.
Required Web Link
Video: Absorption in the Small Intestine
The capillaries in the small intestine join with the portal vein (a.k.a. hepatic portal vein), which transports monosaccharides directly to the liver. The figure below shows the portal vein and all the smaller vessels from the stomach, small intestine, and large intestine that feed into it.
Figure 4.43 The portal vein transports monosaccharides and amino acids to the liver3
In the liver, galactose and fructose are completely taken up by the hepatocytes, while only 30- 40% of glucose is taken up (more on this shortly.) The monosaccharides are phosphorylated by their respective kinase enzymes forming galactose-1-phosphate, fructose-1-phosphate, and glucose-6-phosphate as shown in Figure 4.44.
Figure 4.44 Hepatic monosaccharide uptake
Galactose-1-phosphate, fructose-1-phosphate, and glucose-6-phosphate are important for energy (ATP) production by cells as they can all enter glycolysis directly, or after undergoing conversion to another molecule. This will be covered in greater detail in Chapter 6.
References & Links
Video
Absorption in the Small Intestine - http://www.youtube.com/watch?v=P1sDOJM65Bc
Glycemic Response, Insulin, & Glucagon
If only 30-40% of glucose is being taken up by the liver, then what happens to the rest? How the body handles the rise in blood glucose after a meal is referred to as the glycemic response. The pancreas senses the blood glucose levels and responds appropriately. After a meal, the pancreatic beta-cells sense that glucose levels are high and secrete the hormone insulin, as shown in Figure 4.511.
Figure 4.51 Pancreatic beta-cells sense high blood glucose and secrete insulin
Thus, as can be seen in the following figure, blood insulin levels peak and drop with blood glucose levels over the course of a day.
Figure 4.52 Representative figure of blood glucose and insulin levels during a 24-hour period2
Blood glucose and insulin levels rise following carbohydrate consumption, and they drop after tissues have taken up the glucose from the blood (described below). Higher than normal blood sugar levels are referred to as hyperglycemia, while lower than normal blood sugar levels are known as hypoglycemia.
Insulin travels through the bloodstream to the muscle and adipose cells. There, insulin binds to the insulin receptor located within the cell membrane of the muscle and adipose cells. This causes GLUT4 transporters that are in vesicles inside the cell to move to the cell surface as shown below.
Figure 4.53 Response of muscle and adipose cells to insulin; 1) binding of insulin to its receptor,
The movement of the GLUT4 to the cell surface allows glucose to enter muscle cells and adipocytes (fat cells). The glucose is then phosphorylated to glucose-6-phosphate by hexokinase (different enzyme but same function as glucokinase in liver) to maintain gradient.
Figure 4.54 Response of muscle and adipose cells to insulin part 2; hexokinase phosphorylates glucose to glucose-6-phosphate
Glucagon is a hormone that has the opposite action of insulin. Glucagon is secreted from the
alpha-cells of the pancreas when they sense that blood glucose levels are low, as shown below.
Figure 4.55 Glucagon secretion from pancreatic alpha-cells in response to low blood glucose levels.
Glucagon binds to the glucagon receptors located in the cell membrane of hepatocytes, which causes the breakdown of the glycogen stored in the hepatocytes to glucose (glycogenolysis) as illustrated below.
Figure 4.56 Glucagon binding to its receptor leads to the breakdown of glycogen to glucose.
This glucose is then released into circulation which causes blood glucose levels to rise as shown below.
Figure 4.57 Glucagon leads to the release of glucose from the liver. Subsections:
References & Links
Diabetes
Diabetes is a condition of chronically high blood sugar levels. The prevalence of diabetes in the US has been rapidly increasing; the link below provides some statistics about prevalence.
Required Web Link
There are 2 forms of diabetes: Type 1 and Type 2.
In Type 1 diabetes, not enough insulin is produced, as shown in the figure below.
Figure 4.512 Type 1 diabetes
Without insulin, GLUT4 does not move to the surface of muscle and adipose cells, meaning glucose will not be taken up into these cells. This results in an increase in the amount of glucose remaining in circulation (i.e. increased blood sugar.)
Type 1 diabetes was previously known as juvenile-onset, or insulin-dependent diabetes and is estimated to account for 5-10% of diabetes cases1. Type 1 diabetics receive insulin through injections or pumps to manage their blood sugar.
In Type 2 diabetes, the body produces enough insulin, but the person's body is resistant to it. In Type 2 diabetics the binding of insulin to its receptor does not cause GLUT4 to move to the surface of the muscle and adipose cells as it normally should, thus no glucose will be taken up by these cells.
Figure 4.513 Type 2 diabetes
Type 2 diabetes accounts for 90-95% of diabetes cases, and was once known as non-insulin- dependent diabetes or adult-onset diabetes1. However, with the increasing rates of obesity, many younger people are being diagnosed with Type 2, making the adult-onset distinction no longer appropriate. Some people with Type 2 diabetes can control their condition with a diet and exercise regimen. This regimen improves their insulin sensitivity, or their response to the body’s own insulin. Others with Type 2 diabetes must receive insulin. These individuals are producing enough insulin, but are so resistant to it that more is needed for glucose to be taken up by their muscle and adipose cells.
The video below illustrates Type 2 diabetes.
Required Web Link
Video: Understanding Type 2 Diabetes (3:45)
References & Links
1. http://diabetes.niddk.nih.gov/dm/pubs/statistics/#what
Link
Diabetes Statistics - http://www.diabetes.org/diabetes-basics/statistics/
Video
Understanding Type 2 Diabetes - https://www.youtube.com/watch?v=JAjZv41iUJU
Glycemic Index
Research has indicated that hyperglycemia is associated with chronic diseases and obesity. As a result, measures of the glycemic response to food consumption have been developed so that people can choose foods with a smaller glycemic response. The first measure developed for this purpose was the glycemic index. The glycemic index is the relative change in blood glucose after consumption of 50 g of carbohydrate in a test food compared to 50 g of carbohydrates of a reference food (white bread or glucose). Thus, high glycemic index foods will produce a greater rise in blood glucose concentrations compared to low glycemic index foods, as shown in Figure 4.521.
Figure 4.521 Blood glucose response to a high glycemic index (GI) food compared to a low glycemic index food1
As a general guideline, a glycemic index that is 70 or greater is high, 56-69 is medium, and 55 and below is low. A stop light graphical presentation has been designed to emphasize the consumption of the low glycemic index foods while cautioning against the consumption of too many high glycemic index foods2.
Figure 4.522 Food glycemic index classifications2
The main problem with the glycemic index is that it does not take into account serving sizes. Let's take popcorn (glycemic index 89-127) as an example. A “serving size” of popcorn is 20 g, 11 g of which is carbohydrate3. This is equal to approximately 2.5 cups of popcorn4. Thus, a person would have to consume over 11 cups of popcorn to consume 50 g of carbohydrate needed for the glycemic index measurement. Another example is watermelon, which has a
glycemic index of 103, with a 120 g serving containing only 6 g of carbohydrates3. To consume the 50 g needed for glycemic index measurement, a person would need to consume over 1000 g (1 kg or 2.2 lbs.) of watermelon. Assuming this is all watermelon flesh (no rind), this would be over 6.5 cups of watermelon4.
The website glycemicindex.com (link provided below) contains a database you can search to see the glycemic index and glycemic load (covered in the next section) of various foods. The database also contains detail on how the measurement was done, and more information on the product itself. The top link below will take you to this website. The second link is to another database that contains the same information that might be easier for some people to use.
However, please note that in the second link the glycemic loads are calculated using 100 g serving sizes for all foods. This might not be the actual serving size for all foods, which is what is typically used, so it is important to keep this in mind.
Required Web Links
Glycemic Index & Glycemic Load of Foods
References & Links
Links
Glycemicindex.com - http://www.glycemicindex.com/
Glycemic Index & Glycemic Load of Foods - http://dietgrail.com/gid/
Glycemic Load
To incorporate serving size into the calculation, another measure known as the glycemic load
has been developed. It is calculated as shown below:
Thus, for most people, the glycemic load is a more meaningful measure of the glycemic impact of different foods. Considering the two previous examples from the glycemic index section, their glycemic loads would be:
Popcorn:
Glycemic load = (89-127 X 11 g)/100 = 9.79-13.97
Watermelon:
Glycemic load = (103 X 6 g)/100 = 6.18
As a general guideline for glycemic loads of foods: 20 or above is high, 11-19 is medium, and 10 or below is low1,2.
Figure 4.531 Food glycemic load classifications1,2
Putting it all together, popcorn and watermelon have high glycemic indexes, but medium and low glycemic loads, respectively.
You can also use the top two links below to find the glycemic loads of foods. However, please note that in the second link the glycemic loads are calculated using 100g serving sizes for all foods. This might not be the actual serving size for all foods, which is what is typically used, so it is important to keep this in mind. The third link is to the NutritionData estimated glycemic load tool that is pretty good at estimating the glycemic loads of foods, even if actual glycemic indexes have not been measured.
Required Web Links
Glycemic Index & Glycemic Load of Foods Estimated Glycemic Load
References & Links
Links
Glycemicindex.com - http://www.glycemicindex.com/
Glycemic Index & Glycemic Load of Foods - http://dietgrail.com/gid/
Estimated Glycemic Load - http://www.nutritiondata.com/help/estimated-glycemic-load
Protein Uptake, Absorption, Transport & Liver Uptake
There are a number of similarities between carbohydrate and protein uptake, absorption, transport, and uptake by the liver. Hopefully after this section you will understand these similarities.
Over 60% of all amino acids are taken up into the enterocyte as di- and tripeptides through the PepT1 transporter (active carrier transport). Individual amino acids are taken up through a variety of amino acid transporters. Once inside the enterocyte, peptidases cleave the peptides to individual amino acids. These cleaved amino acids, along with those that were taken up as individual amino acids, are moved into the capillary by another variety of amino acid transporters (some are the same as on the brush border, some are different).
Figure 4.61 Protein uptake and absorption
The capillary inside a villus is shown below.
Figure 4.62 Anatomy of a villus1
Like monosaccharides, amino acids are transported directly to the liver through the portal vein.
Figure 4.63 The portal vein transports monosaccharides and amino acids to the liver2
Amino acids are taken up into the hepatocyte through a variety of amino acid transporters. The amino acids can then be used to either make proteins, or are broken down to produce glucose, as will be described in Chapter 6.
Figure 4.64 Hepatic amino acid uptake
References & Links
Videos
Absorption in the Small Intestine - http://www.youtube.com/watch?v=P1sDOJM65Bc
Lipid Uptake, Absorption & Transport
Once mixed micelles reach the brush border of the enterocyte, two different lipid uptake mechanisms are believed to occur, but lipid uptake is not completely understood. One mechanism is that individual components of micelles may diffuse across the enterocyte. Otherwise, it is believed that some components may be taken up through unresolved transporters. For example, cholesterol transporters have been identified, but their overall mechanism of absorption is not well understood. The individual compounds are taken up as shown below.
Figure 4.71 Uptake of mixed micelle components into the enterocyte
Once inside the enterocyte, there are different fates for fatty acids, depending on their length. Short- and medium-chain fatty acids move through the enterocyte by simple diffusion and enter circulation through the capillaries; they are transported by the protein albumin. They will be carried to the liver by the portal vein, like monosaccharides and amino acids. Long-chain fatty acids, 2-monoglyceride, lysolecithin, and cholesterol will be re-esterified forming triglycerides, phosphatidylcholine, and cholesterol esters, respectively. These re-esterified lipids are then packaged into chylomicrons, which are lipoproteins, that are described in further detail in the next section. These chylomicrons are too large to fit through the pores in the capillaries, but they can fit through the larger fenestrations (openings) in the lacteal.
Figure 4.72 Fates of lipids in the enterocyte
Lacteals (shown below) are small vessels that feed into the lymphatic system. Thus, the chylomicrons enter the lacteals and enter into lymphatic circulation.
Figure 4.73 Anatomy of a villus, with the lacteal shown in blue1
The lymphatic system is a system similar to the circulatory system in that it contains vessels that transport fluid. However, instead of blood, the lymphatic system contains a clear fluid known as lymph. There are a number of lymph nodes (small glands) within the lymphatic system that play a key role in the body's immune system. The figure below shows the lymphatic system.
Figure 4.74 The lymphatic system2
The following videos describe and illustrate how the lymphatic system and lymph functions.
Required Web Links
Video: Lymphatic System (0:49) Video: Lymph Movement (0:44)
The lymphatic system enters general circulation through the thoracic duct that enters the left subclavian vein as shown below. In this case that means that it is not directed to the liver like other components that have been absorbed.
Figure 4.75 The thoracic duct is where the lymphatic system enters circulation. The animation below is an overview of lipid digestion, uptake, and initial transport.
Required Web Link
Animation: Lipid Digestion, Uptake, and Transport
Subsection:
References & Links
Link
http://www.wiley.com/college/grosvenor/0470197587/animations/Animation_Lipid_Digestion
_and_Absorption/Energy/media/content/dig/anima/dig5a/frameset.htm
Videos
Lymphatic system - http://www.youtube.com/watch?v=qTXTDqvPnRk Lymph Movement - https://www.youtube.com/watch?v=ZdYxx4CHb-A
4.71 Lipoproteins
Lipoproteins, as the name suggests, are complexes of lipids and protein. The proteins within a lipoprotein are called apolipoproteins (a.k.a. apoproteins). There are a number of different apolipoproteins that are abbreviated apo-, then an identifying letter (i.e. Apo A) as shown in the chylomicron below.
Figure 4.711 Chylomicron structure1
The following video does a nice job of illustrating the different lipoprotein components.
Required Web Link
There are a number of lipoproteins in the body. They differ by the apolipoproteins they contain,
size (diameter), density, and composition. Table 4.711 below shows the difference in density and diameter of different lipoproteins. Notice that as diameter decreases, density increases.
Table 4.711 The density and diameter of different lipoproteins2
Lipoprotein | Density (g/dL) | Diameter (nm) |
Chylomicrons | 0.95 | 75-1200 |
VLDL (very low-density lipoproteins) | 0.95-1.006 | 30-80 |
IDL (intermediate-density lipoproteins) | 1.006-1.019 | 25-35 |
LDL (low-density lipoproteins) | 1.019-1.063 | 18-25 |
HDL (high-density lipoproteins) | 1.063-1.21 | 5-12 |
This inverse relationship is a result of the larger lipoproteins being composed of a higher percentage of triglyceride and a lower percentage of protein as shown below.
Figure 4.712 Composition of lipoproteins3
Protein is denser than triglyceride (this is why muscle weighs more than fat). Thus, the higher the protein/lower triglyceride composition, the higher the density of the lipoprotein. Many of the lipoproteins are named based on their densities (i.e. very low-density lipoproteins).
As described in the last subsection, the lipoproteins released from the small intestine are chylomicrons. The video below does a nice job of showing, describing, and illustrating how chylomicrons are constructed and function.
Required Web Link
The endothelial cells that line blood vessels, especially in the muscle and adipose tissue, contain the enzyme lipoprotein lipase (LPL). LPL cleaves the fatty acids from lipoprotein triglycerides so that the fatty acids can be taken up into tissues. Figure 4.713 illustrates how endothelial cells are in contact with the blood that flows through the lumen of blood vessels.
Figure 4.713 Lining of a blood vessel. The lumen is where the blood would be flowing, thus endothelial cells are those that are in contact with blood4
LPL cleaves fatty acids from the triglycerides in the chylomicron, decreasing the amount of triglyceride in the lipoprotein. This lipoprotein with less triglycerides becomes what is known as a chylomicron remnant, as shown in Figure 4.714.
Figure 4.714 The cleavage of triglycerides by LPL from a chylomicron leads to the formation of a chylomicron remnant.
Now in the form of a chylomicron remnant, the digested lipid components originally packaged into the chylomicron are directed to the liver where the chylomicron remnant is pulled into the hepatocytes. This process of clearing chylomicrons from the blood takes 2-10 hours after a
meal2. This is why people must fast 12 hours before having their blood lipids (triglycerides, HDL, LDL, etc.) measured. This fast allows all the chylomicrons and chylomicron remnants to be cleared before blood is taken. However, whether patients should be asked to fast has been questioned as described in the link below.
Required Web Link
Should you fast before a cholesterol test?
After the chylomicron remnant has entered the hepatocytes, it is broken down to its individual components (triglycerides, cholesterol, protein etc.). In the liver, VLDL are produced, similar to how chylomicrons are produced in the small intestine. The individual components are packaged into VLDL and secreted into circulation as shown below.
Figure 4.715 Chylomicron remnants are taken up by the liver. The liver secretes VLDL that contain cholesterol (C)
Like it does to chylomicrons, LPL cleaves fatty acids from triglycerides in VLDL, forming the smaller IDL (aka VLDL remnant). Further action of LPL on IDL results in the formation of LDL. The C in Figures 4.715 and 4.716 represents cholesterol, which is not increasing; rather, since triglyceride is being removed, it constitutes a greater percentage of particle mass of lipoproteins. As a result, LDL is composed mostly of cholesterol, as depicted in Figure 4.716.
Figure 4.716 Formation of IDL and LDL from VLDL
LDL contains a specific apolipoprotein (Apo B100) that binds to LDL receptors on the surface of target tissues. The LDL are then endocytosed into the target tissue and broken down to cholesterol and amino acids.
HDL are made up of mostly protein and are derived from the liver and intestine. HDL participates in reverse cholesterol transport, which is the transport of cholesterol back to the liver. HDL picks up cholesterol from tissues/blood vessels and returns it to the liver itself or transfers it to other lipoproteins returning to the liver.
Figure 4.717 HDL is involved in reverse cholesterol transport
The animation under the transport button in the following link does a really nice job of going through the process of lipoprotein transport.
Required Web Link
You are probably familiar with HDL and LDL being referred to as "good cholesterol" and "bad cholesterol," respectively. This is an oversimplification to help the public interpret their blood lipid values, because cholesterol is cholesterol; it's not good or bad. LDL and HDL are lipoproteins, and as a result you can't consume good or bad cholesterol, you consume cholesterol. A more appropriate descriptor for these lipoproteins would be HDL "good cholesterol transporter" and LDL "bad cholesterol transporter."
What's so bad about LDL?
LDL enters the endothelium where it is oxidized. This oxidized LDL is engulfed by white blood cells (macrophages), leading to the formation of what are known as foam cells. The foam cells eventually accumulate so much LDL that they die and accumulate, forming a fatty streak. From there, the fatty streak, which is the beginning stages of a lesion, can continue to grow until it blocks the artery. This can result in a myocardial infarction (heart attack) or a stroke. HDL is good in that it scavenges cholesterol from other lipoproteins or cells and returns it to the liver. The figure below shows the formation of the fatty streak and how this can progress to a point where it greatly alters blood flow.
Figure 4.718 The formation of a lesion in an artery5
The video below does an excellent job of illustrating this process. However, there are two caveats to point out. First, it incorrectly refers to cholesterol (LDL-C etc.), and second, it is clearly made by a drug company, so keep these factors in mind. The second link below is the American Heart Association’s simple animation of how atherosclerosis develops.
Required Web Links
Video: Atherosclerosis (5:36) Cholesterol and CAD
Despite what you learned above about HDL, a recent study questions its importance in preventing cardiovascular disease. It found that people who have genetic variations that lead to higher HDL levels were not at decreased risk of developing cardiovascular disease. You can read more about this interesting finding in the first link below. In addition, another recent study is questioning whether saturated fat is associated with an increased risk of cardiovascular disease.
Required Web Links
Doubt Cast on the ‘Good’ in ‘Good Cholesterol’
Study Questions Fat and Heart Disease Link
The following video gives a general overview of macronutrient digestion, uptake, and absorption.
Required Web Link
References & Links
Links
Ask Well: Should you fast before a cholesterol test - http://well.blogs.nytimes.com/2016/05/24/ask-well-should-you-fast-before-a-cholesterol-test/ Lipoprotein Animation - http://www.wiley.com/legacy/college/boyer/0470003790/animations/cholesterol/cholesterol. swf
Cholesterol and CAD - http://watchlearnlive.heart.org/CVML_Player.php?moduleSelect=chlcad Doubt Cast on the ‘Good’ in ‘Good Cholesterol’ - http://www.nytimes.com/2012/05/17/health/research/hdl-good-cholesterol-found-not-to-cut- heart-risk.html
Study Questions Fat and Heart Disease Link - http://well.blogs.nytimes.com/2014/03/17/study- questions-fat-and-heart-disease-link/
Videos
Lipoproteins - https://www.youtube.com/watch?v=x-4ZQaiZry8 Chylomicrons - http://www.youtube.com/watch?v=hRx_i9npTDU LDL Receptor - http://www.youtube.com/watch?v=XPguYN7dcbE
Atherosclerosis - http://www.youtube.com/watch?v=fLonh7ZesKs&feature=rec-HM-r2 Small Intestine - http://www.youtube.com/watch?v=P1sDOJM65Bc
Chapter 5: Common Digestive Problems
When nutrients and energy are in short supply, cells, tissues, organs, and organ systems do not function properly. As a result, unbalanced diets can cause illness and disease. Conversely, certain illnesses and diseases can cause an inadequate uptake and absorption of nutrients, which in turn, simulates the health consequences of an unbalanced diet. Overeating high-fat foods and nutrient-poor foods can lead to obesity and exacerbate the symptoms of gastroesophageal reflux disease (GERD), gallstones, and irritable bowel syndrome (IBS). Many diseases and illnesses, such as celiac disease, interfere with the body getting its nutritional requirements. A host of other conditions and illnesses, such as peptic ulcers, Crohn’s disease, and ulcerative colitis, can also impair the process of digestion and/or negatively affect nutrient balance and decrease overall health. In this chapter, we will explore a variety of these digestive disorders.
Sections:
Gastroesophageal Reflux Disease
Gastroesophageal reflux disease (GERD) is a persistent form of acid reflux that occurs more than twice per week. Acid reflux occurs when the lower gastroesophageal sphincter (LES) to prevent the acidic contents of the stomach from leaking backward into the esophagus thus causing irritation.
Image Source: http://ddc.musc.edu/public/diseases/esophagus/gerd.html
Figure 5.11 The painful symptoms of GERD are caused by the leakage of acidic stomach contents into the esophagus.1
It is estimated that GERD affects 25 to 35 percent of the US population. An analysis of several studies published in the August 2005 issue of Annals of Internal Medicine concludes that GERD is much more prevalent in people who are obese2. While the links between obesity and GERD are not completely understood, the links likely include: a) excess body fat putting pressure on the stomach, b) overeating leading to high pressure inside the stomach, and/or c) increased consumption of fatty foods triggering GERD symptoms.
There are other causative factors of GERD as well. Sometimes the peristaltic contractions of the esophagus are sluggish and can compromise the clearance of acidic contents. In addition, some people with GERD are sensitive to particular foods—chocolate, garlic, spicy foods, fried foods, and tomato-based foods—which worsen symptoms. Drinks containing alcohol or caffeine may also worsen GERD symptoms.
GERD is diagnosed most often by a history of recurring symptoms. The most common symptom of GERD is heartburn but people with GERD may also experience regurgitation (flow of the
stomach’s acidic contents into the mouth), frequent coughing, nausea, wheezing, and trouble swallowing. A more proper diagnosis can be made when a doctor inserts a small device into the lower esophagus that measures the acidity of the contents during one’s daily activities.
Sometimes a doctor may use an endoscope, which is a long tube with a camera at the end, to view the tissue in the esophagus. About 50% of people with GERD have inflamed tissues in the
esophagus. Recurrent tissue damage can cause Barrett’s esophagus3. Barrett’s esophagus occurs in 5 to 15 percent of patients diagnosed with GERD and in some of these individuals, the condition may develop into cancer of the esophagus, a highly lethal cancer.
Normal Esophagus
Barrett’s Esophagus
Image Source: http://www.refluxcentar.com/en/oboljenja/barett-ov-jednjak/
Figure 5.12 Barrett’s esophagus occurs when the linings of the esophagus transform to tissue
types that are more consistent with the linings of the stomach or intestine.3
Approximately 35% of children born in the United States have GERD. In babies, the symptoms are more difficult to distinguish from what babies do normally. The symptoms are spitting up more than normal, incessant crying, refusal to eat, burping, and coughing. Most babies outgrow GERD before their first birthday but a small percentage do not.
The first approach to GERD treatment is dietary and lifestyle modifications. Suggestions are to reduce weight if you are overweight or obese, avoid foods that worsen GERD symptoms, eat smaller meals, stop smoking, and remain upright for at least three hours after a meal. There is some evidence that sleeping on a bed with the head raised at least six inches helps lessen the symptoms of GERD. People with GERD may not take in the nutrients they need because of the pain and discomfort associated with eating. As a result, GERD can cause an unbalanced diet and its symptoms can lead to a worsening of nutrient inadequacy, a vicious cycle that further compromises health. Many medications are available to treat GERD, including antacids (Maalox or Mylanta), histamine2 (H2) blockers (Tagamet, Zantac, Axid, and Pepcid), and proton-pump inhibitors (Prilosec, Prevacid, Nexium, and Aciphex. Evidence from several scientific studies indicates that medications used to treat GERD may accentuate certain nutrient deficiencies, namely zinc and magnesium4. When these treatment approaches do not work surgery is an
option. The most common surgical treatment involves reinforcing the lower esophageal sphincter, which serves as the barrier between the stomach and esophagus.
The following videos do a nice job of describing the causes, symptoms, and treatments of GERD.
Required Web Links
Video: Understanding GERD (3:04) Video: Gastric Reflux (GERD) (3:10)
References & Links
Videos
Understanding GERD - https://youtu.be/o8iShP84HP4
Gastric Reflux (GERD) - http://www.alilamedicalmedia.com/-/galleries/all-animations/digestive- system-videos/-/medias/d5d1ce1f-8214-4840-96dc-3f8a3c6b2491-gastric-reflux-gerd-narrated- animation
Peptic Ulcers
A peptic ulcer (stomach or duodenal) is a break in the inner lining of the esophagus, stomach, or duodenum. A peptic ulcer of the stomach is called a gastric ulcer, or duodenal ulcer when located in the duodenum, and esophageal ulcer when in the esophagus. Peptic ulcers occur when the lining of these organs is corroded by the acidic digestive (peptic) juices of the stomach. A peptic ulcer differs from an erosion because it extends deeper into the lining of the esophagus, stomach, or duodenum and incites more of an inflammatory reaction from the tissues that are involved. Chronic cases of peptic ulcers are referred to as peptic ulcer disease1.
Figure 5.21 A peptic ulcer in the duodenum1
Required Web Links
Video: Endoscopy of Two Giant Gastric Ulcers (0:27)
Peptic ulcer disease is common, affecting millions of Americans yearly. Moreover, peptic ulcers are a recurrent problem; even healed ulcers can recur unless treatment is directed at preventing their recurrence. The medical cost of treating peptic ulcer and its complications runs into billions of dollars annually. Recent medical advances have increased our understanding of ulcer formation. Improved and expanded treatment options now are available.
Symptoms of duodenal or stomach ulcer disease vary. Many people with ulcers experience minimal indigestion, abdominal discomfort that occurs after meals, or no discomfort at all. Some complain of upper abdominal burning or hunger pain one to three hours after meals or in the middle of the night. These symptoms are often promptly relieved by food or antacids that neutralize stomach acid. The pain of ulcer disease correlates poorly with the presence or severity of active ulceration. Some individuals have persistent pain even after an ulcer is almost completely healed by medication. Others experience no pain at all. Ulcers often come and go spontaneously without the individual ever knowing that they are present unless a serious complication (like bleeding or perforation) occurs2.
For many years, excess acid was believed to be the only cause of ulcer disease. Accordingly, the emphasis of treatment was on neutralizing and inhibiting the secretion of stomach acid. While
acid is still considered necessary for the formation of ulcers and its suppression is still the primary treatment, the two most important initiating causes of ulcers are infection of the stomach by a bacterium named Helicobacter pyloricus (H. pylori) and chronic use of nonsteroidal anti-inflammatory medications or NSAIDs, including aspirin. Cigarette smoking also is an important cause of ulcers as well as failure of ulcer treatment2.
Image Source: http://www.helico.com/images/o_helicobacter-pylori.png
Figure 5.22 Spiral-shaped H. pylori is the only bacteria known to colonize the human stomach3.
Required Web Links
Video: Tests for H. pylori (2:05)
Infection with H. pylori is very common, affecting more than a billion people worldwide. It is estimated that half of the United States population older than age 60 has been infected with H. pylori. Infection usually persists for many years, leading to ulcer disease in 10% to 15% of those infected. In the past, H. pylori was found in more than 80% of patients with gastric and duodenal ulcers. Diagnosis and treatment of this infection, the prevalence of infection with H. pylori, and the proportion of ulcers caused by the bacterium has decreased as the causes of peptic ulcers has been identified. It is estimated that currently only 20% of ulcers are associated with the bacterium. While the mechanism by which H. pylori causes ulcers is complex, elimination of the bacterium by antibiotics has clearly been shown to heal ulcers and prevent their recurrence3.
NSAIDs are medications used for the treatment of arthritis and other painful inflammatory conditions in the body1. Aspirin, ibuprofen (Advil, Motrin), naproxen (Aleve, Naprosyn), and etodolac (Lodine) are a few examples of this class of medications. NSAIDs cause ulcers by interfering with the production of prostaglandins in the stomach.
Cigarette smoking has been shown to not only cause ulcers, but it also increases the risk of complications from ulcers such as ulcer bleeding, stomach obstruction, and perforation.
Cigarette smoking is also a leading cause of failure of treatment for ulcers.
Contrary to popular belief, alcohol, coffee, colas, spicy foods, and caffeine have no proven role in ulcer formation. Similarly, there is no conclusive evidence to suggest that life stresses or personality types contribute to ulcer disease.
The goal of ulcer treatment is to relieve pain, heal the ulcer, and prevent complications. The first step in treatment involves the reduction of risk factors (NSAIDs and cigarettes). The next step is medications.
Antacids neutralize existing acid in the stomach. Histamine antagonists (H2 blockers) are drugs designed to block the action of histamine on gastric cells and reduce the production of acid.
While H2 blockers are effective in ulcer healing, they have a limited role in eradicating H. pylori without antibiotics. Therefore, ulcers frequently return when H2 blockers are stopped. Proton- pump inhibitors are more potent than H2 blockers in suppressing acid secretion. The different proton-pump inhibitors are very similar in action and there is no evidence that one is more effective than the other in healing ulcers. While proton-pump inhibitors are comparable to H2 blockers in effectiveness in treating gastric and duodenal ulcers, they are superior to H2 blockers in treating esophageal ulcers2.
References & Links
Videos
Gastric Ulcers - http://www.youtube.com/watch?v=98JaiKH2q3E Endoscopy of Two Giant Gastric Ulcers - http://www.youtube.com/watch?v=ncHcpzCnjGQ&feature=related Tests for H. pylori - https://youtu.be/9O98pscV9gQ
Gallstones
It is estimated that up to 1 million Americans are hospitalized annually as a result of gallstones, making it the most common of all digestive diseases1. Gallstones are formed when bile hardens in the gallbladder. 80% of gallstones are a result of cholesterol precipitation, while 20% are the
result of bile pigment precipitation2. The cause of gallstones is unknown2. The way in which gallstones are formed is shown in the following video.
Required Web Link
The following figure shows a severe case of gallstones.
Figure 5.31 Gallstones within a dissected gallbladder3
Many people do not experience symptoms from gallstones. They are usually discovered during examination for another health condition. However, some people experience an "attack" or pain that results from blockage of the bile ducts.
Prevention of gallstones is accomplished by maintaining a healthy weight and eating a diet high in fiber and low in simple carbohydrates. If there are no symptoms, treatment is usually not needed. In those who are having gallbladder attacks, surgery to remove the gallbladder, called a cholecystectomy, is typically recommended since the gallbladder is not considered an essential organ. After surgery, bile then flows directly from the liver into the small intestine. In those who are unable to have surgery, medication to try to dissolve the stones or shock wave lithotripsy may be tried3.
In the developed world, 10–15% of adults have gallstones. Rates in many parts of Africa, however, are as low as 3%. Gallbladder and biliary related diseases occurred in about 104 million people (1.6%) in 2013 and they resulted in 106,000 deaths. Women more commonly have stones than men and they occur more commonly after the age of 40. Certain ethnic groups have gallstones more often than others. For example, 48% of American Indians have gallstones. Once the gallbladder is removed, outcomes are generally good3.
References & Links
Video
Gallstones - http://www.youtube.com/watch?v=1q3NxfwSENM&feature=rec-HM-fresh+div
Irritable Bowel Syndrome
Irritable bowel syndrome (IBS) is characterized by muscle spasms in the colon that result in abdominal pain, bloating, constipation, and/or diarrhea1. Interestingly, IBS produces no permanent structural damage to the large intestine as often happens to patients who have Crohn’s disease or other inflammatory bowel diseases. It is estimated that one in five Americans displays symptoms of IBS. The disorder is more prevalent in women than in men. Two primary factors that contribute to IBS are an unbalanced diet and stress.2
Symptoms of IBS significantly decrease a person’s quality of life, as they are present for at least twelve consecutive or nonconsecutive weeks in a year. Large meals and foods high in fat and added sugars, or those that contain wheat, rye, barley, peppermint, and chocolate intensify or bring about symptoms of IBS. Additionally, beverages containing caffeine or alcohol may worsen IBS. Stress and depression compound the severity and frequency of IBS symptoms.3
There is no specific test to diagnose IBS, but other conditions that have similar symptoms (such as celiac disease and peptic ulcers) must be ruled out. This involves stool tests, blood tests, and having a colonoscopy (which involves the insertion of a flexible tube with a tiny camera on the end through the anus so the doctor can see the colon tissues).3
There is no cure for IBS. As with GERD, the first treatment approaches for IBS are diet and lifestyle modifications. People with IBS are often told to keep a daily food journal to help identify and eliminate foods that cause the most problems. Other recommendations are to eat slower, add more fiber to the diet, drink more water, and to exercise. There are some medications (many of which can be purchased over-the-counter) to treat IBS and the resulting diarrhea or constipation. Sometimes antidepressants and drugs to relax the colon are prescribed.3
Required Web Link
Video: Irritable Bowel Syndrome (IBS) (4:16)
References & Links
Video
Irritable Bowel Syndrome - https://youtu.be/9f5wxYW0Z3k
Inflammatory Bowel Disease
Inflammatory bowel disease (IBD) refers to a number of inflammatory conditions in the intestine. The two most common are Crohn's disease and ulcerative colitis. These two conditions differ mainly in the areas of the intestine that are affected. Crohn's disease can occur anywhere throughout the GI tract, but most commonly occurs in the last part of the ileum.
Crohn's disease may also involve all layers of the intestine1. Ulcerative colitis are ulcers, or sores, in the lining of the colon and/or rectum2. It is estimated that up to 1 million people have IBD in the United States. Half of these individuals have Crohn's disease, and the other half have ulcerative colitis3.
Table 5.51 Differences between Crohn’s disease and Ulcerative colitis.4
Figure 5.51 Illustration of the differences between Crohn’s disease and ulcerative colitis.5
The exact causes of these two diseases is not known. One hypothesized cause for Crohn's disease is an overactive immune system that results in the chronic inflammation and collateral damage to the cells of the intestine, resulting in formation of lesions. The following videos do a nice job of illustrating the possible causes of Crohn’s disease and ulcerative colitis.
Required Web Link
Video: Pathology of Crohn’s disease (6:37) Video: Ulcerative Colitis (4:48)
Crohn's disease and ulcerative colitis present symptoms similar to other gastrointestinal diseases, such as irritable bowel syndrome and GERD.4 However, there are areas where the symptoms of the two do not overlap. Table 5.52 lists the typical symptoms of each.
Figure 5.52 Comparison of the symptoms of Crohn’s disease and ulcerative colitis.4
References & Links
Video
Pathology of Crohn’s disease - https://youtu.be/thzOJV-CHRo Ulcerative Colitis - https://youtu.be/dYQrqeTxC9g
Celiac Disease & Gluten
1 out of every 133 people in the United States has celiac disease1. People with celiac disease cannot consume the protein gluten because it causes their body to generate an autoimmune response (immune cells attack the body's own cells) that causes damage to the villi in the intestine, as shown in Figure 5.61.
Figure 5.61 Different stages of celiac disease2
This damage to the villi impairs the absorption of macronutrients and micronutrients from food.
There are a variety of symptoms for celiac disease that vary depending on age and from person to person. For a listing of all symptoms, see the first link below. The second link describes the difficulty in diagnosing this disease, which is reinforced by the third video link.
Required Web Link
What are the symptoms of celiac disease?
Celiac Disease, a Common, but Elusive, Diagnosis Video: Celiac's Disease (2:00)
The symptoms can appear in infancy or much later in life, even by age seventy. Celiac disease is not always diagnosed because the symptoms may be mild. A large number of people have what is referred to as “silent” or “latent” celiac disease. Figure 5.63 demonstrates how silent and latent conditions underlie the asymptomatic nature of the condition.3
Figure 5.63 Celiac Iceberg demonstrating the silent and latent phases that may exist prior to the development of symptoms.3
Villi destruction is what causes many of the symptoms of celiac disease. The destruction of the absorptive surface of the small intestine also results in the malabsorption of nutrients, so that while people with this disease may eat enough, nutrients do not make it to the bloodstream because absorption is reduced. The effects of nutrient malabsorption are most apparent in children and the elderly as they are especially susceptible to nutrient deficiencies. Over time, these nutrient deficiencies can cause health problems. Poor absorption of iron and folic acid can cause anemia, which is a decrease in red blood cells. Anemia impairs oxygen transport to all cells in the body. Calcium and vitamin D deficiencies can lead to osteoporosis, a disease in which bones become brittle.3
What is gluten?
Gluten is a protein that is bound to starch in the endosperm of grains such as:
Figure 5.62 Parts of a wheat granule4
Gluten-free diets have been increasing in popularity even for people who don’t have celiac disease. The thinking among those consuming these diets is that they might be gluten-sensitive, meaning that they experience adverse effects from consuming it. However, as the following videos describes, there is not much evidence to support people being gluten-sensitive.
Required Web Link
Video: Is Gluten-Sensitivity Real? (3:11)
Celiac disease is most common in people of European descent and is rare in people of African American, Japanese, and Chinese descent. It is much more prevalent in women and in people with Type 1 diabetes, autoimmune thyroid disease, and Down and Turner syndromes.
Symptoms can range from mild to severe and can include pale, fatty, loose stools, gastrointestinal upset, abdominal pain, weight loss and, in children, a failure to grow and thrive.3
References & Links
Links
What are the symptoms of celiac disease? - http://digestive.niddk.nih.gov/ddiseases/pubs/celiac/#symptoms Celiac Disease, a Common, but Elusive, Diagnosis -
http://well.blogs.nytimes.com/2014/09/29/celiac-disease-diagnosis-gluten/
Videos
Celiac's Disease - http://www.nbcnews.com/nightly-news/video/celiac-disease-affecting- millions-of-americans-often-goes-undiagnosed-692131907739
Is Gluten-Sensitivity Real? - https://www.youtube.com/watch?v=EXON21V0v4o
Diverticulosis and Diverticulitis
Approximately 10% of people under 40, and 50% of people over 60 years old have a condition known as diverticulosis1. In this condition, diverticula (plural, diverticulum singular), or out- pouches, are formed at weak points in the large intestine, primarily in the lowest section of the sigmoid colon, as nicely shown in the figure below and in the video in the web link below.
Figure 5.71 Diverticula on the large intestine1
Required Web Link
It is believed that diverticula are formed as a result of a low-fiber diet because people may strain more during bowel movements. Most people with diverticulosis do not know that they have the condition. However, if the pouches become inflamed, then the condition is known as diverticulitis. Approximately 10 to 25 percent of people who have diverticulosis go on to develop diverticulitis.2 Symptoms include lower abdominal pain, nausea, and alternating between constipation and diarrhea.
The chances of developing diverticulosis and hence diverticulitis can be reduced with fiber intake because of what the breakdown products of the fiber do for the colon. The bacterial breakdown of fiber in the large intestine releases short-chain fatty acids. These molecules have been found to nourish colonic cells, inhibit colonic inflammation, and stimulate the immune system (thereby providing protection of the colon from harmful substances). Additionally, the bacterial indigestible fiber, mostly insoluble, increases stool bulk and softness increasing transit time in the large intestine and facilitating feces elimination. One uncomfortable side effect of consuming foods high in fiber is increased gas production since the byproducts of bacterial digestion of fiber are gases.
Several studies have found a link between high dietary-fiber intake and a decreased risk for colon cancer. However, an analysis of several studies published in the Journal of the American Medical Association in 2005 did not find that dietary-fiber intake was associated with a reduction in colon cancer risk3. There is some evidence that specific fiber types (such as inulin) may protect against colon cancer, but more studies are needed to conclusively determine how certain fiber types (and at what dose) inhibit colon cancer development.
The treatment the doctor prescribes will depend on how severe the condition is. Most cases of diverticulitis — about 75 percent of them — are uncomplicated. This means they have no other problems besides the actual inflammation or possible infection from the diverticulitis itself.
With uncomplicated diverticulitis, the doctor will likely suggest lots of rest and fluids during recovery from symptoms. They will also want to conduct follow-up assessments within a few days. In the meantime, the doctor may prescribe or recommend treatments such as medication, a liquid diet, or a low-fiber diet4.
References & Links
Video
http://www.youtube.com/watch?v=Mwa1qu9W2mM
Hemorrhoids
Hemorrhoids are swollen or inflamed veins of the anus or lower rectum. An internal hemorrhoid occurs within the anus, while an external hemorrhoid occurs in the skin surrounding the anus. Symptoms of hemorrhoids include bleeding, pain during bowel movements, and/or itching1. It is estimated that “about 75% of people will have hemorrhoids at some point in their lives”2.
Figure 5.81 Hemorrhoids3
The first 55 seconds of the following video does a nice job of illustrating what hemorrhoids are and how they develop.
Required Web Link
The anus and lower rectum experience high pressure during bowel movements. Thus, hemorrhoids are believed to be caused by straining during bowel movements. To prevent this condition from occurring, it is recommended that people consume a high-fiber diet, drink plenty of water, and exercise to produce regular, large, soft stools. In addition, people should "go" at first urge and not wait until it is more than an urge2.
References & Links
Video
Hemorrhoids - http://www.youtube.com/watch?v=C8vZoIhQCwU
Chapter 6: Macronutrient & Alcohol Metabolism
Now that we have digested, taken up, absorbed, and transported the macronutrients, the next step is to learn how these macronutrients are metabolized. Alcohol is also included at the end of this chapter, even though it is not a macronutrient.
Sections:
6.1 Metabolism Basics
Metabolism consists of all the chemical processes that occur in living cells. These processes/reactions can generally be classified as either anabolic or catabolic. Anabolic means to build, catabolic means to breakdown. If you have trouble remembering the difference between the two, remember that anabolic steroids are what are used to build enormous muscle mass.
Figure 6.11 One of these two is taking anabolic steroids, which one would be your guess?
An anabolic reaction/pathway requires energy to build something. A catabolic reaction/pathway generates energy by breaking down something. This is shown in the example below of glucose and glycogen. The same is true for other macronutrients.
Figure 6.12 The breakdown of glycogen to glucose is catabolic. The glucose can then be used to produce energy. The synthesis of glycogen from glucose is anabolic and requires energy.
Anabolic and catabolic can also be used to describe conditions in the body. For instance, after a meal there is often a positive energy balance, or there is more energy and macronutrients than the body needs at that time. Thus, some energy needs to be stored and the macronutrients will be used for synthesis, such as amino acids being used for protein synthesis. However, after a fast, or a prolonged period without energy intake, the body is in negative energy balance and is considered catabolic. In this condition, macronutrients will be mobilized from their stores to be used to generate energy. For example, if prolonged enough, protein can be broken down, then the released amino acids can be broken down to be used as an energy source.
A number of the metabolic reactions either oxidize or reduce compounds. A compound that is being oxidized loses at least one electron, while a compound that is reduced gains at least one electron. To remember the difference, a mnemonic device such as OIL (oxidation is lost), RIG (reduction is gained) is helpful. Oxidation reactions and reduction reactions are “coupled” reactions, one cannot exist without the other. For example, a reduction reaction requires an electron. Where does that electron come from? It comes from an oxidation reaction. Scientists commonly refer to oxidation reactions and reduction reactions as oxidation-reduction reactions, or as redox reactions. Oxidation-reduction reactions are illustrated in the figure below.
Figure 6.13 The purple compound is being oxidized, the orange compound is being reduced1 Another way to remember oxidation versus reduction is LEO goes GER (like a lion)
Lose Elections = Oxidation
Gain Elections = Reduction (YES, gaining electrons is considered reduction)
Iron is a good example we can use to illustrate oxidation-reduction reactions. Iron commonly exists in two states (Fe3+ or Fe2+). It is constantly oxidized/reduced back and forth between the two states. The oxidation/reduction of iron is shown below.
Fe3+ loses an e- → Fe2+ (Oxidation) Fe2+ gains an e- → Fe3+ (Reduction)
Interestingly, the oxidation states of iron (mentioned above) are critical to our ability to use the iron present in our diet. Fe2+ (also known as ferrous iron) is easily absorbed in the small intestine. Fe3+ (also known as ferric iron) is not so easily absorbed. Gastric acid (produced by the stomach) and vitamin C promote the conversion of Fe3+ to Fe2+ so we can maximize iron absorption in the small intestine.
However, some oxidation reduction reactions are not as easy to recognize. There are some simple rules to help you recognize less-obvious oxidation/reduction reactions that are based upon the gain or loss of oxygen or hydrogen. These are as follows:
Oxidation: gains oxygen or loses hydrogen Reduction: loses oxygen or gains hydrogen
Remembering how this applies to hydrogen will be very helpful later in this chapter.
References
1. http://en.wikipedia.org/wiki/Image:Gulf_Offshore_Platform.jpg
6.11 Cofactors
A number of enzymes require cofactors to function. Cofactors can be either organic or inorganic molecules that are required by enzymes to function. Many organic cofactors are vitamins or molecules derived from vitamins. Most inorganic cofactors are minerals. Cofactors can be oxidized or reduced for the enzymes to catalyze the reactions.
Two common cofactors that are derived from the B vitamins, niacin and riboflavin, are NAD
(nicotinamide adenine dinucleotide) and FAD (flavin adenine dinucleotide), respectively.
Both of these cofactors can be reduced (remember that reduction is a process by which electrons, as part of H in this case, are gained); NAD is reduced to form NADH, while FAD is reduced to form FADH2 as shown in the 2 figures below.
Figure 6.111 The reduction of NAD (left) to form NADH (right)3
Figure 6.112 The reduction of FAD (left) to FADH2 (right) 4
NADH and FADH2 are molecules that are critical to our cells’ ability to process the energized electrons obtained through the catabolism (digestion) of food molecules, like glucose. The energized electrons, which are highly reactive and potentially destructive, are temporarily managed by NADH and FADH2 until they can be processed by the Electron Transport Chain step of Cellular Respiration (see Section 6.26 below).
An example of a mineral that serves as a cofactor is Fe2+ for proline and lysyl hydroxylases. Proline and lysine are two amino acids that must be hydroxylated (the addition of an OH group) in order to be used as building blocks for collagen, perhaps the most important structural protein in the body. We will discuss later in detail why vitamin C (ascorbic acid) is needed to reduce iron to Fe2+ so that it can serve as a cofactor for proline and lysyl hydroxylases.
Figure 6.115 Iron (Fe2+) is a cofactor for proline and lysyl hydroxylases
References & Links
Monosaccharide Metabolism
Galactose and fructose metabolism is a logical place to begin looking at carbohydrate metabolism, before shifting focus to the cell’s preferred monosaccharide, glucose. Once absorbed in the small intestine (Chapter 4), these monosaccharides are transported to the liver via the hepatic portal system. The figure below shows that galactose and fructose are phosphorylated (have a phosphate added to them) in the liver (a hepatocyte is a liver cell).
Figure 6.211 Uptake of monosaccharides into the hepatocyte
Galactose
As shown above, galactose is phosphorylated in the cells of the liver, resulting in a molecule called galactose-1-phosphate. Galactose -1-phosphate is converted to glucose-1-phosphate, before finally being converted to glucose-6-phosphate1. As shown below, glucose 6-phosphate can then be used in either glycolysis (the breakdown of glucose for energy) or glycogenesis (the production of glycogen for storage), depending on the person's current energy state.
Figure 6.212 Conversion of galactose-1-phosphate to glucose-6-phosphate
Fructose
Unlike galactose, fructose cannot be used to form glucose 6-phosphate. Instead, fructose-1- phosphate is cleaved in the liver to form glyceraldehyde 3-phosphate, an intermediate in the process of glycolysis (see Section 6.23 below).
The Importance of Glucose-6-Phosphate
Within hepatocytes or myocytes (muscle cells), glucose-6-phosphate can be used either for glycogenesis (glycogen synthesis) or glycolysis (breakdown of glucose for energy production). If the person is in an anabolic state (e.g. after a meal), they will use glucose-6-phosphate for storage. If they are in a catabolic state (e.g. fasted), they will use it for energy production.
Figure 6.214 The "fork in the road" for glucose-6-phosphate
References & Links
1. Gropper SS, Smith JL, Groff JL. (2008) Advanced Nutrition and Human Metabolism. Belmont, CA: Wadsworth Publishing.
Glycogenesis & Glycogenolysis
As discussed earlier, glycogen is the stored form of glucose in humans. If a person is in an anabolic state, such as after consuming a meal, most glucose-6-phosphate within the myocytes (muscle cells) or hepatocytes (liver cells) is going to be stored as glycogen.
Glycogen is mainly stored in the liver and the muscle. It makes up ~6% of the weight of the liver, but only ~1% of muscle weight. However, since we have far more muscle mass in our body, there is 3-4 times more glycogen stored in muscle than in the liver2. This is of great practical importance since glycogen is an importance source of energy for muscle contraction. We have limited glycogen storage capacity in the liver. Thus, after a high-carbohydrate meal, our glycogen stores will reach capacity fairly quickly. After glycogen stores are filled, glucose will have to be metabolized in different ways for it to be stored in a different form, often as fat.
Glycogenesis
The synthesis of glycogen from glucose is a process known as glycogenesis. You will remember that glucose can be converted to glucose-6-phosphate (see Figure 6.211). If glucose storage (as glycogen) is required at any given time, the glucose-6-phosphate is converted to glucose-1- phosphate and then converted to glycogen (Figure 6.222).
Figure 6.222 Glycogenesis
Glycogenolysis
The process of liberating glucose from glycogen is known as glycogenolysis. This process is essentially the opposite of glycogenesis. Glycogen is hydrolyzed and the individual glucose molecules are phosphorylated (converted into glucose-6-phosphate) through the action of an
enzyme called glycogen phosphorylase as shown below3.
Figure 6.223 Glycogenolysis
References & Links
Glycolysis
If a person is in a catabolic state (in need of energy) such as during fasting, most glucose-6- phosphate will be used for glycolysis.
Figure 6.231 The "fork in the road" for glucose-6-phosphate
Glycolysis is the breaking down of one glucose molecule (6 carbons) into two pyruvate molecules (3 carbons). During the process, a net of two ATPs and two NADHs are also produced. The Figure 6.232 below shows the steps of glycolysis. Do not get overwhelmed, you will not have to learn every step. We will break it down into smaller sections and highlight the important intermediates, but I do want you to see how glucoses progresses through the various intermediate molecules before becoming pyruvate.
Figure 6.232 Glycolysis1
The following animation, using ball-and-stick models, allows you to control the 3 steps of glycolysis.
Required Web Links
3 steps of Glycolysis
Figure 6.233 Glycolysis step 1, energy investment1
Figure 6.234 Glycolysis step 2, glucose split1
Figure 6.235 Glycolysis step 3, energy harvesting1
Thus, from a molecule of glucose, the harvesting step produces a total of four ATPs and two NADHs. Remember that in Step 1 we had to “invest” two molecules of ATP to get the process started. Therefore, the net output from one molecule of glucose is two ATPs and two NADHs. You will remember that NADH is a molecule that is used to manage energized electrons. In this case, the splitting of the glucose molecule releases two energized electrons, which are then managed by two NADH molecules. These energized electrons will ultimately be processed by the Electron Transport Chain to generate ATP in the process of Cellular Respiration.
The figure below shows the stages of glycolysis, as well as the transition reaction, citric acid cycle, and electron transport chain that are utilized by cells to produce energy. They are also the focus of the next 3 sections. Again, you’re not going to have to memorize each step. This is just to give you an overview of the entire process.
Figure 6.236 Glycolysis, transition reaction, citric acid cycle, and the electron transport chain2
References & Links
Links
Glycolysis Animation - http://www.science.smith.edu/departments/Biology/Bio231/glycolysis.html
Transition Reaction
If a person is in a catabolic state, or needs energy, how the pyruvate molecules produced in glycolysis will be used depends on whether adequate oxygen levels are present. If oxygen levels are adequate (aerobic conditions), pyruvate moves from the cytoplasm, into the mitochondria, and then undergoes the transition reaction. If oxygen levels are not adequate (anaerobic conditions), pyruvate will remain in the cytoplasm to be used to produce lactate. We are going to focus on the aerobic pathway for now. We will address what happens under anaerobic conditions in the anaerobic respiration section.
Figure 6.241 Pyruvate fork in the road. What happens depends on whether it is aerobic or anaerobic respiration1
The transition reaction (sometimes called the transition step) is the transition between glycolysis and the citric acid cycle. It also represents a transition in location from the cytoplasm to the mitochondrion. The transition reaction converts pyruvate molecule (3 carbons) into acetyl CoA molecules (2 carbons), producing carbon dioxide (CO2) and NADH as shown below. The figure below shows the transition reaction with CoA and NAD entering, and acetyl-CoA, CO2, and NADH being produced.
Figure 6.242 Transition reaction2
The acetyl is combined with coenzyme A (CoA) to form acetyl-CoA. The structure of CoA is shown below. You can think of coenzyme A as an acetyl manager…a molecule that will deliver the 2-carbon acetyl group into the citric acid cycle (see Section 6.25).
In summary, the transition reaction converts each 3-carbon pyruvate into a 2-carbon acetyl group, which is then managed by coenzyme A. The transition reaction also generates CO2 (a waste product), and NADH (a reduced molecule, contains energized electrons that will be processed by electron transport chain to make ATP).
References & Links
The Citric Acid Cycle
Acetyl-CoA is a central point in metabolism, meaning there are a number of ways that it can be used. We're going to continue to consider its use in an aerobic, catabolic state (need energy). Under these conditions, acetyl-CoA will enter the citric acid cycle (a.k.a. Krebs Cycle, TCA Cycle). The following figure shows the citric acid cycle. In the top left you will notice the acetyl-CoA we just produced.
Figure 6.251 The citric acid cycle1
The citric acid cycle begins by acetyl-CoA (2 carbons) combining with oxaloacetate (4 carbons) to form citrate (a.k.a. citric acid, 6 carbons). Coenzyme A is removed as part of this reaction leaving a single acetyl group to continue through the cycle. A series of transformations occur as the acetyl group is processed, creating a series of intermediates known as keto acids, until oxaloacetate if eventually reformed. During these intermediate steps, the acetyl group that was created during the formation of citrate is broken down and NADH, FADH2, CO2, and ATP are produced.
In summary, the Citric Acid Cycle processes each 2-carbon acetyl group from the transition reaction. The acetyl group is delivered by coenzyme A, and is progressively broken down, resulting in the production of carbon dioxide (a waste product), ATP, and NADH and FADH2 (reduced molecules that contain energized electrons that will be processed by the Electron Transport Chain to make ATP).
The first video and the animation do a good job of explaining and illustrating how the cycle works. The second video is an entertaining rap about the cycle.
Required Web Links
Video: Citric acid cycle (0:44) Citric acid cycle animation
Video: TCA (Kreb's) Cycle Rap (3:01)
Through glycolysis, the transition reaction, and the citric acid cycle, multiple NADH and FADH2 molecules are produced. Under aerobic conditions, these molecules will enter the electron transport chain to be used to generate energy through oxidative phosphorylation as described in the next section.
References & Links
Link
Citric Acid Cycle Animation - http://www.wiley.com/college/boyer/0470003790/animations/tca/tca.htm
Video
Citric acid cycle - http://www.youtube.com/watch?v=hw5nWB0xN0Y
TCA (Kreb's) Cycle Rap - http://www.youtube.com/watch?v=aMBIs_Iw0kE
Electron Transport Chain
The electron transport chain is located on the inner membrane of the mitochondria, as shown below.
Figure 6.261 The pathways involved in aerobic respiration1
The electron transport chain contains a number of electron carriers. These carriers take the electrons from NADH and FADH2, pass them down the chain of complexes and electron carriers, and ultimately produce ATP. More specifically, the electron transport chain takes the energy from the electrons on NADH and FADH2 to pump protons (H+) into the intermembrane space.
This creates a proton gradient between the intermembrane space (high) and the matrix (low) of the mitochondria. The protons will then move back out through the enzyme ATP synthase from high to low concentration. This is similar to how a person rides up a motorized ski-lift (the proton pump) only to use gravity (high to low concentration) to come back down the hill. ATP synthase uses the energy of the moving protons to synthesize ATP (think of a hydroelectric dam using moving water to generate electricity.) Oxygen is required for this process because it serves as the final electron acceptor, forming water. Collectively this process is known as
oxidative phosphorylation. The following figure and animation do a nice job of illustrating how the electron transport chain functions.
Figure 6.262 Location of the electron transport chain in the mitochondria2
Required Web Link
The electron transport chain generates 3 ATP for each NADH processed and 2 ATP for each FADH2 processed. We can assess each of the catabolic steps of aerobic cellular respiration (steps that actually deconstruct the molecule of glucose) in terms of the number of NADH and FADH2 molecules produced. For one molecule of glucose, the preceding pathways produce:
Glycolysis: 2 NADH Transition Reaction: 2 NADH
Citric Acid Cycle: 6 NADH, 2 FADH2 Total 10 NADH, 2 FADH2
Note: some textbooks will use 2.5/1.5 ATP for NADH/FADH2 instead of the 3/2 we are using here. This is due to the fact that the actual total varies from organism to organism, and even
from one round to the next within the same organism. For simplicity’s sake, we will stick with 3/2 here.
In the following section (Section 6.27), we will compute exactly how many ATP can be generated from the aerobic breakdown of a single molecule of glucose.
The first video does a nice job of illustrating and reviewing the electron transport chain. The second video is a great rap video explaining the steps of glucose oxidation.
Required Web Links
Video: Electron Transport (1:43)
Video: Oxidate it or Love it/Electron to the Next One (3:23)
References & Links
Link
ETC Animation - http://www.science.smith.edu/departments/Biology/Bio231/etc.html
Videos
Electron Transport Chain - http://www.youtube.com/watch?v=1engJR_XWVU&feature=related Oxidate it or Love it/Electron to the Next One - http://www.youtube.com/watch?v=VCpNk92uswY&feature=response_watch
Aerobic Glucose Metabolism Totals
The table below shows the ATP generated from one molecule of glucose in the different metabolic pathways. As you look at Table 6.271 below, be sure to recognize that the ATP produced through Electron Transport is generated through the processing of the NADH and FADH2 summarized in the previous section.
Notice that the vast majority of ATP is generated by the electron transport chain. Remember that this is an aerobic process and oxygen is the final electron acceptor. Oxygen is the key to the rich energy return of 38 ATP per molecule of glucose. If there were no oxygen, there would be no final electron acceptor. If there were no final electron acceptor, there would be no electron transport chain. If there were no electron transport chain, it would not be possible to process NADH and FADH2. In the next section, we will see what happens if there is a limited supply of oxygen in our cells.
Table. 6.271 ATP generated from one molecule of glucose.
Metabolic Pathway | ATP Generated |
Glycolysis | 2 |
Transition Reaction | 0 |
Citric Acid Cycle | 2 |
Electron Transport Chain | 30 (from 10 NADH) 4 (from 2 FADH2) |
Total | 38 |
No References
Conditions without oxygen are referred to as anaerobic. In this case, the pyruvate will be converted to lactate in the cytoplasm of the cell as shown below.
Figure 6.281 Pyruvate fork in the road, what happens depends on whether it is aerobic or anaerobic respiration1
What happens if oxygen isn't available to serve as the final electron acceptor? As shown in the following video, the ETC becomes backed up with electrons and can't accept any more from NADH and FADH2.
Web Link
Video: What happens when you run out of oxygen? (0:37)
This leads to a problem in glycolysis because NAD are limited and it is needed to accept electrons, as shown below. Without the electron transport chain functioning, once all NAD molecules have been reduced to NADH, glycolysis cannot continue to produce ATP from glucose.
Figure 6.282 Why NAD needs to be regenerated under anaerobic conditions2
Thus, there is a workaround to regenerate NAD by converting pyruvate (pyruvic acid) to lactate (lactic acid) as shown below.
Figure 6.283. The conversion of pyruvic acid to lactic acid regenerates NAD3,4
However, anaerobic respiration only produces 2 ATP from one molecule of glucose, compared to the 38 ATP from one molecule of glucose we saw with aerobic respiration. The biggest producers of lactate are muscle cells under oxygen stress (lacking adequate oxygen). During periods of intense activity, we might not be able to supply our muscle cells with sufficient oxygen to support the aerobic breakdown of glucose. At that point, our muscle cells are forced
to breakdown glucose in the absence of oxygen (which is essentially a process of glycolysis), which results in a limited amount of ATP and lactate (lactic acid). The lactate is generated because the conversion of pyruvate to lactate allows us to recycle NAD. The lactate produced, while technically a waste product, is still a metabolically valuable commodity. Through what is known as the Cori cycle, lactate produced in the muscle can be sent to the liver. In the liver, through a process known as gluconeogenesis, glucose can be regenerated and sent back to the muscle to be used again for anaerobic respiration forming a cycle as shown below.
Figure 6.284 The Cori cycle5
It is worth noting that the Cori cycle also functions during times of limited glucose (like fasting) to spare glucose by not completely oxidizing it.
References & Links
_en_(edit).svg
Video
What happens when your run out of oxygen? - http://www.youtube.com/watch?v=StXlo1W3Gvg
6.3 Lipid Metabolism Pathways
Five lipid metabolic pathways/processes will be covered in the following subsections:
-Breakdown of triglycerides to glycerol and free fatty acids.
-Breakdown of fatty acids to acetyl-CoA
-Synthesis of fatty acids from acetyl-CoA and esterification into triglycerides
-Synthesis of ketone bodies from acetyl-CoA
6.31 Lipolysis (Triglyceride Breakdown)
Lipolysis is the cleavage of triglycerides to glycerol and fatty acids, as shown below.
Figure 6.311 Lipolysis
There are two primary lipolysis enzymes:
Despite performing the same function, the enzymes are primarily active for seemingly opposite reasons. In the anabolic state, LPL on the lining of blood vessels cleaves lipoprotein triglycerides into fatty acids so that they can be taken up into adipocytes (fat cells) for storage as triglycerides, or myocytes (muscle cells) where they are primarily used for energy production.
This action of LPL on lipoproteins is shown in Figures 6.312 & 6.313.
Figure 6.312 Lipoprotein lipase cleaves fatty acids from the chylomicron, forming a chylomicron remnant.
Figure 6.313 Lipoprotein lipase cleaves triglycerides from VLDL and IDL, forming subsequent lipoproteins (IDL and LDL) that contain less triglyceride
HSL is an important enzyme in adipose tissue, which is a major storage site of triglycerides in the body. HSL activity is increased by glucagon and epinephrine ("fight or flight" hormone), and decreased by insulin. Thus, during hypoglycemia (such as during a fast; a catabolic state), or a "fight or flight" response, triglycerides in the adipocytes (fat cells) are cleaved, releasing fatty acids into circulation that then bind with the transport protein albumin that carry them to muscle cells for use as an energy source. Thus, HSL is important for mobilizing fatty acids so they can be used to produce energy. The figure below shows how fatty acids can be taken up and used by tissues such as the muscle for energy production1.
Figure 6.314 Hormone-sensitive lipase
We are not going to focus on glycerol (the other product of triglyceride breakdown), but it does have two metabolic fates.
Figure 6.315 Metabolic fates of glycerol
References & Links
1. Byrd-Bredbenner C, Moe G, Beshgetoor D, Berning J. (2009) Wardlaw's Perspectives in Nutrition. New York, NY: McGraw-Hill.
De novo Lipogenesis (Fatty Acid Synthesis)
De novo in Latin means "from the beginning." Thus, de novo lipogenesis is the synthesis of fatty acids, beginning with acetyl-CoA. You will remember that acetyl-CoA is the product of the transition reaction that is the starting point of the citric acid cycle. We had mentioned earlier
(in Section 6.25) that “Acetyl-CoA is a central point in metabolism.” Acetyl-CoA moves out of the mitochondria, where it is subsequently combined with additional acetyl-CoA molecules to form palmitate, a 16-carbon fatty acid1. The palmitate produced can be used as a component in the production of triglycerides (fat) for storage.
Figure 6.331 Fatty acid synthesis2
References
Ketone Body Synthesis
In cases where there is not enough glucose available for the brain (very low carbohydrate diets, starvation), the liver can use acetyl-CoA to synthesize ketone bodies (ketogenesis). The
structures of the three ketone bodies; acetone, acetoacetic acid, and beta-hydroxybutyric acid, are shown below.
Figure 6.341 The three ketone bodies, from top to bottom (acetone, acetoacetic acid, and beta- hydroxybutyric acid1)
After they are synthesized in the liver, ketone bodies are released into circulation where they can travel to the brain. The brain converts the ketone bodies to acetyl-CoA that can then enter the citric acid cycle for ATP production, as shown below.
Figure 6.342 The production, release, use, or exhalation of ketone bodies2
If there are high levels of ketones secreted, it results in a condition known as ketosis or ketoacidosis. The high level of ketones in the blood decreases the blood’s pH, meaning it becomes more acidic. It is debatable whether mild ketoacidosis (as seen with ketogenic and
Atkin’s diets) is harmful, but severe ketoacidosis can be lethal. One symptom of this condition is fruity or sweet-smelling breath, which is due to increased acetone exhalation.
References & Links
Cholesterol Synthesis
Acetyl-CoA is also used to synthesize cholesterol. As shown below, there are a large number of reactions and enzymes involved in cholesterol synthesis. You will not have to memorize all these steps, but it does illustrate the complexity of this process.
Figure 6.351 Cholesterol synthesis pathway1
Simplifying this, acetyl-CoA is converted to acetoacetyl-CoA (4 carbons) before forming 3- hydroxy-3-methylglutaryl-CoA (HMG-CoA). HMG-CoA is converted to mevalonate by the enzyme HMG-CoA reductase. This enzyme is important because it is the rate-limiting enzyme in cholesterol synthesis.
Figure 6.352 Cholesterol synthesis simplified2
A rate-limiting enzyme is like a bottleneck in a highway, as shown below, that determines the flow of traffic past it. Traffic is limited in how fast it can flow due to the emergency vehicle (rate-limiting enzyme) slowing it down.
Figure 6.353 Bottleneck in traffic3
Rate-limiting enzymes limit the rate at which a metabolic pathway proceeds. The pharmaceutical industry has taken advantage of this knowledge to lower people's LDL (“bad” cholesterol) levels with drugs known as statins. These drugs inhibit HMG-CoA reductase and thus decrease cholesterol synthesis. Less cholesterol leads to lower LDL levels, and hopefully a lower risk of cardiovascular disease.
The brand names of some common statins approved for use in the US include: Lipitor
Lescol Crestor Zocor Livalo
The body synthesizes approximately 1 gram of cholesterol a day, whereas it is recommended that we consume less than 0.3 gram a day. A number of tissues synthesize cholesterol, with the liver accounting for ~20% of synthesis. The intestine is believed to be the most active among the other tissues that are responsible for the other 80% of cholesterol synthesis5.
References & Links
6.4 Protein Metabolism
Section 2.22 described how proteins are synthesized. Thus, this section will focus on how proteins and amino acids are broken down. There are four protein metabolic pathways that will be covered in this section:
Transamination – transfer of an amino group from one amino acid to another
Deamination – removal of an amino group, normally from an amino acid. Gluconeogenesis – synthesis of glucose from a non-carbohydrate source. Protein Turnover/Degradation – liberation of amino acids from proteins.
Subsections:
Transamination, Deamination & Ammonia Removal as Urea
Amino acids are important metabolic resources for our cells. The first step in making an amino acid useful is deamination, the removal of its amino group (-NH2). Once the amino group has been removed, what remains is a 2-carbon keto acid with a side chain. The keto acid is the valuable component of the amino acid in that it can be used as a foundation for the construction of a new amino acid (transamination below), it can be used as the foundation for the construction of ketone bodies (ketogenesis below), and it can be used as a starting point for the construction of glucose (gluconeogenesis below). As we shall see below, not all amino acids are the same in terms of what can be done with them after an event of deamination. We will also determine that deamination has a possible negative consequence (hyperammonemia).
Transamination
Transamination is the transfer of an amino group from an amino acid to a keto acid (amino acid without an amino group), thus creating a new amino acid and keto acid as shown below.
Figure 6.411 Generic transamination reaction where the top keto acid is converted to an amino acid, while the bottom amino acid is converted to a keto acid1
Keto acids and/or carbon skeletons are what remains after amino acids have had their nitrogen group removed by deamination or transamination. Transamination is used to synthesize nonessential amino acids.
Deamination
Deamination is the removal of the amino group as ammonia (NH3), as shown below.
Figure 6.412 Deamination of cytosine to uracil (nucleotides, not amino acids)2
The potential problem with deamination is that too much ammonia is toxic, causing a condition known as hyperammonemia. The symptoms of this condition are shown in the following figure.
Figure 6.413 Symptoms of Hyperammonemia3
Our body has a method to safely package ammonia in a less toxic form to be excreted. This safer compound is urea, which is produced by the liver using 2 molecules of ammonia (NH3) and 1 molecule of carbon dioxide (CO2). Most urea is then secreted from the liver and incorporated into urine in the kidney to be excreted from the body, as shown in Figure 6.414.
Figure 6.414 Production of urea helps to safely remove ammonia from the body4-6
References
Gluconeogenesis
Gluconeogenesis is the synthesis of glucose from non-carbohydrate sources. Certain amino acids can be used for this process, which is the reason that this section is included here instead of the carbohydrate metabolism section. Gluconeogenesis is glycolysis in reverse with an oxaloacetate workaround, as shown below. Remember oxaloacetate is also an intermediate in the citric acid cycle.
Figure 6.421 Gluconeogenesis is glycolysis in reverse with an oxaloacetate workaround1
Not all amino acids can be used for gluconeogenesis. The ones that can be used are termed glucogenic, and can be converted to either pyruvate or a citric acid cycle intermediate. Other amino acids can only be converted to either acetyl-CoA or acetoacetyl-CoA, which cannot be used for gluconeogenesis. However, acetyl-CoA or acetoacetyl-CoA can be used for ketogenesis to synthesize the ketone bodies, acetone and acetoacetate. Thus, these amino acids are instead termed ketogenic.
In addition to ketogenic amino acids, fatty acids also cannot be used to synthesize glucose. The transition reaction is a one-way reaction, meaning that acetyl-CoA cannot be converted back to pyruvate. As a result, fatty acids can't be used to synthesize glucose, because their oxidation produces acetyl-CoA. This acetyl-CoA enters the citric acid cycle and the carbons from it will eventually be completely oxidized and given off as CO2. It is important to remember that while the fatty acids from a triglyceride cannot be used to generate glucose, that the glycerol portion of the triglyceride (Figure 6.315).
References
Protein Turnover/Degradation
Proteins serve a number of functions in the body, but what happens they have completed their lifespan? They are recycled.
Figure 6.431 Recycling symbol1
Proteins are broken down to amino acids that can be used to synthesize new proteins. Two of the main systems of protein degradation are:
Ubiquitin-Proteasome Degradation
Proteins that are damaged or abnormal are tagged with the protein ubiquitin. There are multiple protein subunits involved in the process (E1-E3), but the net result is the production of a protein (substrate) with a ubiquitin tail, as shown below.
Figure 6.432 Ubiquitination of a protein (substrate)2
This protein then moves to the proteasome for degradation. Think of the proteasome like a garbage disposal. The ubiquitinated "trash" protein is inserted into the garbage disposal where it is broken down into its component parts (primarily amino acids). The following video illustrates this process nicely.
Web Link
Video: Proteasome Degradation (0:44)
Lysosome Degradation
The lysosomes are organelles that are found in cells. They contain a number of proteases (enzymes that breakdown proteins) that degrade proteins, similar to how proteins are digested in our own GI tracts.
References & Links
Video
Proteasome Degradation - https://www.youtube.com/watch?v=w2Qd6v-4IIc
6.5 Alcohol Metabolism
The other energy source is alcohol. The alcohol we consume contains two carbons and is known as ethanol.
Figure 6.51 Structure of ethanol1
Ethanol is passively absorbed by simple diffusion into the enterocytes. Ethanol metabolism occurs primarily in the liver, but 10-30% is estimated to occur in the stomach2. For the average person, the liver can metabolize the amount of ethanol in one drink (1/2 ounce) per hour3.
There are three ways that alcohol is metabolized in the body.
Figure 6.52 Ethanol Metabolism1,5
At high intakes, or with repeated exposure, there is increased synthesis of MEOS enzymes resulting in more efficient metabolism, also known as increased tolerance. However, ADH levels do not increase based on alcohol exposure. MEOS also metabolizes a variety of other compounds (drugs, fatty acids, steroids), and alcohol competes with these compounds for the enzyme's action. This can cause the metabolism of drugs to slow and potentially reach harmful levels in the body3.
It should be noted that females have lower stomach ADH activity and body H2O concentrations. As a result, a larger proportion of ethanol reaches circulation, thus, in general, females have a lower tolerance for alcohol. Additionally, approximately 36% of East Asians (Japanese, Chinese, and Koreans) have an inherited deficiency in the enzyme ALDH (aldehyde dehydrogenase). This leads to buildup of acetaldehyde and undesirable symptoms such as: flushing, dizziness, nausea, and headaches2. The following short video explains what happens when the MEOS system gets involved in alcohol metabolism.
Required Web Link
References & Links
Video
MEOS Overflow Pathway - http://nutrition.jbpub.com/resources/animations.cfm?id=20&debug=0
Chapter 7: Integration of Macronutrient & Alcohol Metabolism
Understanding the different metabolic pathways is an important step. However, an integrated understanding of the interconnectedness and tissue specificity of metabolism is where this knowledge really becomes powerful. To this end, we will first cover how the different pathways feed into one another and then talk about the metabolic capabilities of the different tissues in the body. We will then discuss what happens metabolically during different conditions or when consuming certain diets.
Sections:
7.4 Metabolic Conditions
Integration of Macronutrient and Alcohol Metabolic Pathways
If you were to draw all the macronutrient and alcohol metabolic pathways covered in chapter 6, hopefully it would look something like the figure below. Again, don’t be overwhelmed by its complexity. If you take some time to look through it, you will see many things we discussed in Chapter 6, including how acetyl-CoA is right in the center of it all. Also remember that the Krebs Cycle is another term for the Citric Acid Cycle.
In this figure:
Carbohydrate pathways are orange Triglyceride/fatty acid pathways are purple Protein/amino acid pathways are green Non-classified pathways are gray
Figure 7.11 Integrated macronutrient and alcohol metabolism1
To simplify, we are going to remove the glycerol and cholesterol pathways so that we can focus on integrating the other pathways in macronutrient and alcohol metabolism.
Figure 7.12 Removal of glycerol and cholesterol pathways1
Thus, we are left with the following simplified figure:
Figure 7.13 Simplified integrated macronutrient and alcohol metabolism1
You might remember in the last chapter (specifically, Section 6.25), we mentioned that “acetyl- CoA is a central point in metabolism.” This statement is critical to our understanding of metabolism illustrated in the last few figures. Notice that acetyl-CoA is the central metabolite metabolism that connects the many different pathways. For example, carbohydrates (orange pathway) can be broken down to acetyl-CoA that can then be used to synthesize fats and ultimately triglycerides (purple pathway).
References & Links
1. http://en.wikipedia.org/wiki/File:CellRespiration.svg
Liver Macronutrient and Alcohol Metabolism
The liver is the organ that has the greatest macronutrient metabolic capability; there are a number of metabolic functions that only the liver performs. However, there are two major macronutrient metabolic processes, lactate synthesis and ketone body breakdown, that the liver will not normally perform, in the Figure 7.21.
Figure 7.21 Ketone body breakdown and lactate synthesis are major macronutrient metabolic pathways that the liver does not normally perform1
But aside from those two pathways, the liver performs all the other metabolic pathways that you have learned about that are listed and shown in Figure 7.22:
Figure 7.22 Metabolic capability of the liver1
The liver is the ONLY tissue that performs the following functions:
The liver is also the PRIMARY, but not exclusive site, of the following functions:
Glucose-6-phosphatase is important because it removes the phosphate from glucose-6- phosphate so that glucose can be released into circulation. Kidneys can perform gluconeogenesis, and has glucose-6-phosphatase. However, it is estimated that 90% of glucose
formed from gluconeogenesis is produced by the liver; the remaining 10% is produced by the kidney(s). It is also important to note that the muscle does not have this enzyme, so it cannot release glucose into circulation2.
References & Links
Extrahepatic Macronutrient Metabolism
Because the liver is so important in metabolism, the term extrahepatic has been defined to mean "located or occurring outside of the liver1". We are next going to consider extrahepatic tissue metabolism.
Figure 7.31 The liver "is kind of a big deal2"
To start considering the metabolic capabilities of the extrahepatic tissues, we start by removing the following pathways that only or mostly occur in the liver:
These metabolic processes are crossed off in the Figure 7.32.
Figure 7.32 Removing the pathways that only or mostly occur in the liver3
We are left with metabolic capabilities that are listed and shown below.
Figure 7.33 The metabolic capability of the extrahepatic tissues3
We will use this figure as the base for metabolic capabilities of the different extrahepatic tissues to compare what pathways other tissues can perform versus all the pathways performed by extrahepatic tissues.
In an effort to keep this simple, we are going to focus on four extrahepatic tissues in the following subsections:
References & Links
Muscle Macronutrient Metabolism
Compared to extrahepatic tissues as a whole, in muscle tissue the following pathways are not performed or are not important:
These pathways are crossed out in the figure below.
Figure 7.311 The metabolic pathways that are not performed or important in muscle tissue, compared to extrahepatic tissues as a whole1
Removing those pathways, the following metabolic pathways make up muscle metabolic capability:
Figure 7.312 Muscle metabolic capability1
Muscle is a major extrahepatic metabolic tissue. It is the only extrahepatic tissue with significant glycogen stores. However, unlike the liver, muscle tissue cannot secrete glucose after it is taken up (there is no glucose-6-phosphatase in muscle cells). Thus, you can think of muscle tissue as being selfish with glucose. It either uses it for itself initially or stores it for its later use.
References & Links
1. http://en.wikipedia.org/wiki/File:CellRespiration.svg
Adipose Macronutrient Metabolism
It probably does not surprise you that the major function of adipose tissue is to store energy as triglycerides. Compared to extrahepatic tissues as a whole, in adipose tissue the following pathways are not performed or are not important:
These pathways are crossed out in the figure below.
Figure 7.321 The metabolic pathways that are not performed or important in adipose tissue, compared to extrahepatic tissues as a whole are crossed out1
Removing those pathways, we are left with metabolic capabilities listed below and depicted in Figure 7.322:
Figure 7.322 Adipose metabolic capability
Fatty acid synthesis only occurs in adipose tissue and the liver. In adipose tissue, fatty acids are synthesized and most will be esterified into triglycerides to be stored. In the liver, some fatty acids will be esterified into triglycerides to be stored, but most triglycerides will be incorporated into VLDL so that they can be used or stored by other tissues.
References & Links
1. http://en.wikipedia.org/wiki/File:CellRespiration.svg
Brain Macronutrient Metabolism
Fatty acid breakdown does not occur to any great extent in the brain because of the limited activity of one of the enzymes in this pathway1. Compared to the extrahepatic tissues as a whole, in the brain the following pathways are not performed or are not important:
These pathways are crossed out in Figure 7.331.
Figure 7.331 The metabolic pathways that are not performed or important in the brain compared to extrahepatic tissues as a whole are crossed out2
Fatty acid breakdown does not occur to any great extent in the brain because low activity of an enzyme in the beta-oxidation pathway limits the activity of this pathway2.
By removing those pathways the only pathways left in the brain are:
Figure 7.332 Brain metabolic capability1
Thus, due to its limited metabolic capabilities, the brain needs to receive either glucose or ketone bodies to use as an energy source.
References & Links
Red Blood Cell Macronutrient Metabolism
Red blood cells are the most limited of the extrahepatic tissues because they do not contain a nucleus or other cell organelles, most notably mitochondria.
Figure 7.341 Red blood cells do not contain mitochondria1
As a result, compared to the extrahepatic tissues, in red blood cells the following pathways are not performed or are not important:
These pathways are crossed off in Figure 7.342.
Figure 7.342 The metabolic pathways that are not performed or important in the red blood cells, compared to extrahepatic tissues as a whole are crossed off2
If all those pathways are removed, only glycolysis is left, where pyruvate is ultimately, converted to lactate.
Figure 7.343 Red blood cell metabolic capability
Thus, red blood cells are one-trick ponies, only being able to perform glycolysis and produce lactate.
Figure 7.344 Red blood cells are one-trick ponies
References & Links
Metabolic Conditions
You have learned about the pathways and the tissue metabolic capabilities, so now we’re going to apply that knowledge to three conditions: fasting, the Atkins diet, and the Ornish/Pritikin diet, as ways to illustrate how you can use this knowledge.
In fasting, we’re going to be considering what is happening metabolically during a prolonged period without food. This is a catabolic condition. The Atkins diet is a carbohydrate-restricted diet, so we are going to consider what happens metabolically when someone is eating a diet that essentially only contains protein and fat over an extended period of time. This is an anabolic condition. Finally, the Ornish/Pritikin diet is a very low-fat diet, so we’re going to consider what happens metabolically when someone is eating a diet that is essentially only carbohydrates and protein over an extended period of time. This is also an anabolic condition. For each of these conditions, we’re going to consider what is happening in the liver, muscle, adipose, and brain.
Now that you have an understanding of the glycemic response (Chapter 4) and macronutrient metabolism (Chapter 6), you should be able to understand the broader effects of insulin and glucagon that are summarized in the following tables. Knowing what hormone is elevated in the different conditions helps you to understand the metabolism that occurs in different conditions.
Table 7.41 Insulin’s effects on targets in tissues1,2
Effect | Tissue | Target |
↑ Glucose Uptake | Muscle, Adipose | ↑ GLUT4 |
↑ Glucose Uptake | Liver | ↑ Glucokinase |
↑ Glycogen Synthesis | Liver, Muscle | ↑ Glycogen Synthase |
↓ Glycogen Breakdown | Liver, Muscle | ↓ Glycogen Phosphorylase |
↑ Glycolysis, ↑ Transition Reaction | Liver, Muscle | ↑ Phosphofructokinase-1 ↑ Pyruvate Dehydrogenase Complex |
↑ Fatty Acid Synthesis | Liver | ↑ Fatty Acid Synthase |
↑ Triglyceride Synthesis | Adipose | ↑ Lipoprotein Lipase |
Table 7.42 Glucagon’s effects on targets in tissues2
Effect | Tissue | Target |
↑ Glycogen Breakdown | Liver | ↑ Glycogen Phosphorylase |
↓ Glycogen Synthesis | Liver | ↓ Glycogen Synthase |
↑ Gluconeogenesis | Liver | Multiple Enzymes |
↓ Glycolysis | Liver | ↓ Phosphofructokinase-1 |
↑ Ketone Body Synthesis | Liver | ↑ Acetyl-CoA Carboxylase |
↑ Triglyceride Breakdown | Adipose | ↑ Hormone-Sensitive Lipase |
Subsections:
References & Links
Fasting
In this condition a person has been fasting for an extended period of time (18 hours or longer). As a result, the person is in a catabolic state with low blood glucose levels, which leads the pancreas to secrete glucagon.
The liver will break down glycogen to secrete glucose for other tissues to use until its stores are exhausted. Amino acids and lactate from muscle will be used for gluconeogenesis to synthesize glucose that will also be secreted. Glycolysis will not be occurring to any great extent in an effort to spare glucose for use by other tissues. From the breakdown of amino acids, there will be an increase in the synthesis and secretion of urea from the liver to safely rid the body of ammonia from the amino acids. Fatty acids that are received from adipose tissue will be broken down to acetyl-CoA and used to synthesize ketone bodies that are secreted for use by tissues, such as the brain, that cannot directly use fatty acids as a fuel.
Muscle tissue will break down glycogen to glucose until glycogen stores are exhausted, and receive glucose from the liver that enters glycolysis, forming pyruvate. Glucose will be used for anaerobic (lactate) and aerobic (pyruvate) respiration. Pyruvate will enter the transition reaction to form acetyl-CoA. The acetyl-CoA will then enter the citric acid cycle, and NADH and FADH2 produced will enter the electron transport chain to generate ATP. Once there isn’t enough glucose for the muscle to use, fatty acids taken up from adipose tissue, and from the breakdown of muscle triglyceride stores, will be broken down to create acetyl-CoA. The acetyl- CoA will then enter the citric acid cycle, and NADH and FADH2 produced will enter the electron transport chain to generate ATP. Amino acids from protein breakdown and lactate (Cori Cycle) will be secreted to be used by the liver for gluconeogenesis.
The adipose tissue will break down triglycerides to fatty acids and release these for use by the muscle and the liver. It will not be taking up anything.
No References
In this condition, assume a person just started into Phase I of the Atkins Diet and he/she has just consumed a meal of all protein and fat with no carbohydrates of any kind. As a result, this person is in an anabolic state, but blood glucose levels are low, meaning the pancreas will secrete glucagon.
Liver glycogen stores will be broken down to secrete glucose for other tissues. Glycolysis will not be occurring to any great extent, in order to spare glucose for other tissues. Using amino acids from digestion and lactate from muscle, gluconeogenesis will synthesize glucose that will also be secreted. From the breakdown of amino acids, there will be an increase in the synthesis and secretion of urea from the liver to safely rid the body of ammonia from the amino acids.
Amino acids will also be used for protein synthesis. Some triglycerides from chylomicron remnants taken up will be broken down to fatty acids. These will then be broken down to acetyl-CoA and used to synthesize ketone bodies that are secreted for tissues, such as the brain, that cannot directly use fatty acids as a fuel. Other triglycerides will be packaged into VLDL and secreted from the liver.
Muscle tissue is going to break down glycogen to glucose, and receive glucose from the liver that enters glycolysis, forming pyruvate. Glucose will be used for anaerobic (lactate) and aerobic (pyruvate) respiration. After glycogen is used up, most glucose will be used for anaerobic respiration to spare glucose. In aerobic respiration, pyruvate will enter the transition reaction to form acetyl-CoA. The acetyl-CoA will then enter the citric acid cycle, and NADH and FADH2 produced will enter the electron transport chain to generate ATP. Once there is not enough glucose for the muscle to use, fatty acids from multiple sources will be broken down to acetyl-CoA. The acetyl-CoA will then enter the citric acid cycle, and NADH and FADH2 produced will enter the electron transport chain to generate ATP. Amino acids taken up will be used for protein synthesis, and lactate will be secreted for the liver to use for gluconeogenesis (Cori cycle).
In adipose tissue, fatty acids are also going to be taken up. These fatty acids will be used to synthesize triglycerides for storage. With glucagon levels high in this condition, hormone- sensitive lipase (HSL) would be active. However, since this is an anabolic state, the net effect would be uptake of fatty acids after cleavage by lipoprotein lipase (LPL). The adipose tissue won’t be secreting anything under this condition.
No References
In this condition, assume a person is on the Ornish/Pritikin Diet and just consumed a meal containing carbohydrates, with minimal but adequate amount of protein, and no fat. As a result, this person is in an anabolic state with high blood glucose levels, meaning the pancreas will secrete insulin.
The liver will take up glucose and synthesize glycogen until its stores are filled. After these stores are full, glucose can be broken down through glycolysis to pyruvate, then form acetyl- CoA in the transition reaction. Because we are in the fed or anabolic state, acetyl-CoA will be used for fatty acid synthesis, and the fatty acids will be used for triglyceride synthesis. However, evidence suggests that this de novo lipogenesis pathway does not occur to any great extent in humans1. These triglycerides will be packaged into VLDL and secreted from the liver. Amino acids will also be taken up and used for protein synthesis as needed. Because there is plenty of glucose, gluconeogenesis and ketone body synthesis will not be operating to any great extent.
Muscle tissue will take up glucose and synthesize glycogen until those stores are filled. Some glucose will go through glycolysis to produce pyruvate, then form acetyl-CoA in the transition reaction. The acetyl-CoA will enter the citric acid cycle, and NADH and FADH2 produced will enter the electron transport chain to generate ATP. Fatty acids that are cleaved from VLDL, IDL, and LDL are also going to be taken up. These fatty acids will be used to synthesize triglycerides for storage. Whatever amino acids are taken up will be used for protein synthesis. The muscle will not be secreting anything in this condition.
The adipose tissue is going to take up glucose that will enter glycolysis, where pyruvate will be produced, then acetyl-CoA will be produced in the transition reaction. Because we are in the fed or anabolic state, the acetyl-CoA will be used for fatty acid synthesis, and the fatty acids will be used for triglyceride synthesis. However, evidence suggests that de novo lipogenesis does not occur to any great extent in humans1. Fatty acids that are going to be taken up and primarily used to synthesize triglycerides for storage. The adipose tissue won’t be secreting anything under this condition.
The brain will have plenty of glucose available for its use, so it is not going to have to use ketone bodies like it would during fasting and during prolonged Atkins diet consumption.
References & Links
Chapter 8: Micronutrients Overview & Dietary Reference Intakes (DRIs)
Micronutrients consist of vitamins and minerals. In this chapter, an overview of vitamins and minerals will be presented followed by a description of the dietary reference intakes (DRIs), which are used as benchmarks of micronutrient intake.
Sections:
Vitamins
The name vitamin comes from Casimir Funk, who in 1912 thought vital amines (NH3) were responsible for preventing what we know now are vitamin deficiencies. He coined the term vitamines to describe these compounds. Eventually it was discovered that these compounds were not amines and the 'e' was dropped to form vitamins1.
Vitamins are classified as either fat-soluble or water-soluble. The fat-soluble vitamins are:
The water-soluble vitamins are vitamin C and the B vitamins, which are shown in Table 8.11. Table 8.11 The B vitamins and their common names
Vitamin | Common Name |
B1 | Thiamin |
B2 | Riboflavin |
B3 | Niacin |
B5 | Pantothenic Acid |
B6* | Pyridoxine |
B7 | Biotin |
B9 | Folate |
B12* | Cobalamin |
*Normally used instead of common names
Before they even knew that vitamins existed, a scientist named E.V. McCollum recognized that a deficiency in what he called ‘fat-soluble factor A’ resulted in severe ophthalmia (inflammation of the eye) 1. In addition, a deficiency in ‘water-soluble factor B’ resulted in beriberi (a deficiency discussed more later)1.
Figure 8.11 Factor A deficiency led to ophthalmia, factor B deficiency led to beriberi
Factor A is what we now know as vitamin A. However, researchers soon realized that factor B actually consisted of two factors that they termed B1 and B2. Then they realized that there are multiple components in B2, and they began identifying the wide array of B vitamins that we know today1.
You might be thinking “but the numbers on the B vitamins still do not add up." You are right, vitamins B4, B8, B10, and B11 were discovered and then removed leaving us with the B vitamins shown in Table 8.11.
Relative to other scientific milestones, the discovery of vitamins is a fairly recent occurrence, as shown in Table 8.12.
Table 8.12 Vitamin, year proposed, isolated, structure determined, and synthesis achieved up to 19441
Vitamin | Year Proposed | Isolated | Structure Determined | Synthesis Achieved |
Thiamin | 1901 | 1926 | 1936 | 1936 |
Vitamin C | 1907 | 1926 | 1932 | 1933 |
Vitamin A | 1915 | 1939 | 1942 | - |
Vitamin D | 1919 | 1931 | 1932 | 1932 |
Vitamin E | 1922 | 1936 | 1938 | 1938 |
Niacin | 1926 | 1937 | 1937 | 1867* |
Biotin | 1926 | 1939 | 1942 | 1943 |
Vitamin K | 1929 | 1939 | 1942 | 1943 |
Pantothenic Acid | 1931 | 1939 | 1939 | 1940 |
Folate | 1931 | 1939 | - | - |
Riboflavin | 1933 | 1933 | 1934 | 1935 |
Vitamin B6 | 1934 | 1936 | 1938 | 1939 |
* Was established long before it was known to be a vitamin
A number of B vitamins serve as cofactors/coenzymes. The following table lists the cofactors/coenzymes formed from B vitamins that will be discussed in more detail in the following subsections.
Table 8.13 Cofactors/coenzymes formed from B vitamins
Vitamin | Cofactors/Coenzymes |
Thiamin | Thiamin Pyrophosphate (TPP) |
Riboflavin | Flavin Adenine Dinucleotide (FAD), Flavin Mononucleotide (FMN) |
Niacin | Nicotine Adenine Dinucleotide (NAD), Nicotine Adenine Dinucleotide Phosphate (NADP) |
Pantothenic Acid | Coenzyme A |
Vitamin B6 | Pyridoxal Phosphate (PLP) |
Biotin | - |
Folate | Tetrahydrofolate (THF) |
Vitamin B12 | Adenosylcobalamin, Methylcobalamin |
References & Links
1. Carpenter K. (2003) A short history of nutritional science: Part 3 (1912-1944). J Nutr 133(10): 3023-3032
Minerals
Minerals are elements that are essential for body functions that can't be synthesized in the body. Some people refer to them as elements instead of minerals, and the names can be used interchangeably. However, in the nutrition community, they are more commonly referred to as minerals. Minerals can be divided up into three different categories:
There is not an exact, agreed upon definition for how the different categories are defined, but in general they are defined by the amount required and found in the body such that:
Macrominerals > Trace Minerals > Ultratrace Minerals Table 8.21 Alphabetical listing of the 20 minerals and their chemical symbols
Macrominerals | Trace Minerals | Ultratrace Minerals |
Calcium (Ca) | Chromium (Cr) | Arsenic (As) |
Chloride (Cl)a | Copper (Cu) | Boron (B) |
Magnesium (Mg) | Fluoride (F) | Nickel (Ni) |
Phosphorus (P)b | Iodine (I) | Silicon (Si) |
Potassium (K) | Iron (Fe) | Vanadium (V) |
Sodium (Na) | Manganese (Mn) | |
Molybdenum (Mo) | ||
Selenium (Se) | ||
Zinc (Zn) |
a Chlorine ion, Cl-
b Phosphate in body, PO4
Table 8.22 shows the estimated amount of the macrominerals, trace minerals, and ultratrace minerals found in the body.
Table 8.22 Amount of different minerals found in the body1
Macrominerals | Trace Minerals | Ultratrace Minerals | |||
Calcium | 1200 g | Iron | 4 g | Silicon | 1 g |
Phosphorus | 780 g | Fluoride | 3-6 g | Boron | 17 mg |
Potassium | 110-140 g | Zinc | 2.3 g | Nickel | 15 mg |
Sodium | 100 g | Copper | 70 mg | Arsenic | 7 mg |
Chloride | 95 g | Selenium | 14 mg | Vanadium | 0.1 mg |
Magnesium | 25 g | Manganese | 12 mg | ||
Iodine | 10-20 mg | ||||
Molybdenum | 5 mg | ||||
Chromium | 1-2 mg | ||||
Minerals are elements. The figure below shows the distribution of minerals in the periodic table, which you should be familiar with from your chemistry education.
References & Links
1. Emsley, John. Nature’s building blocks: An A-Z guide to the elements. 2001. Oxford, Oxford University Press.
Vitamins & Minerals Functional Categories
There are two common ways to teach about vitamins and minerals in nutrition classes. The traditional way is to start with fat-soluble vitamins and go down through the vitamins alphabetically (i.e. vitamin A, vitamin D, vitamin E, vitamin K). However, this method leads students to learn about vitamins and minerals more individually instead of how they work together. For instance, it makes sense to cover calcium with vitamin D, and iron with copper and zinc. We are going to cover vitamins and minerals based on their function rather than covering them by whether they are a water-soluble vitamin or trace mineral. The hope is that you will gain a more integrative understanding of vitamins and minerals from this approach.
Here are the different functional categories that we are going to cover. Notice that some micronutrients fit into more than one functional category. Each vitamin and mineral will be covered only in one section, with some mention of its overlap in other section(s) in certain cases.
Table 8.31 Overview of Vitamins and Minerals
Antioxidants | Macronutrient Metabolism | 1-Carbon Metabolism | Blood | Bones & Teeth | Electrolytes |
Vitamin E | Thiamin | Folate | Vitamin K | Vitamin D | Sodium |
Vitamin C | Riboflavin | Vitamin B12 | Iron | Calcium | Potassium |
Selenium | Niacin | Vitamin B6 | Vitamin B6 | Vitamin K | Chloride |
Iron | Pantothenic Acid | Folate | Phosphorus | Phosphorus | |
Copper | Vitamin B6 | Vitamin B12 | Magnesium | Magnesium | |
Zinc | Biotin | Copper | Fluoride | ||
Manganese | Vitamin B12 | Calcium | Vitamin A | ||
Riboflavin | Vitamin C | Iron | |||
Iodine | Copper | ||||
Manganese | Zinc | ||||
Magnesium |
No References
Dietary Reference Intakes (DRIs) are more than numbers in the table, even though that is often how many people view them. The link below takes you to the tables that many people commonly associate with the DRIs. These tables have been updated to include the new RDAs for vitamin D and calcium.
Web Link
Most of you are probably familiar with Dietary Guidelines. DRIs and Dietary Guidelines provide different information for different audiences.
Dietary Guidelines provide qualitative advice to the public about diet and chronic disease prevention and maintaining health.
DRIs provide quantitative advice to professionals about amounts of nutrients or food components to be of benefit.
DRIs are a collective term to refer to these components:
*A number of people refer to the UL as simply the “upper limit”, leaving off “tolerable”.
Estimated Energy Requirement (EER) is the estimated number of calories needed to maintain caloric balance. Using weight as a reference, this means you are taking in no more calories, and also no fewer calories, than are needed to maintain that exact weight. To gain weight, you’d
need to consume more than your EER, and to lose weight you’d need to consume less than your EER. Unlike some of the other DRIs, EER is individual-specific and is based on calculations that take into account multiple variables, including an individual's energy intake, energy expenditure, age, sex, weight, height, and physical activity level3.
The Recommended Dietary Allowance (RDA) is the measure that professionals use to assess the quality of people's diets. It is the requirement estimated to meet the needs of 97.5% of the population. However, the RDA is calculated using the EAR (Estimated Average Requirement).
Therefore, the EAR needs to be set before an RDA can be set. An Estimated Average Requirement (EAR) is the estimated requirement for 50% of the population (hence the “Average” in its name), as shown in the figure below. On the left vertical axis is the risk of
inadequacy, and on the bottom of the figure is the observed level of intake that increases from left to right. We will talk about the right axis label in a later figure. Notice that for the EAR, the risk for inadequacy is 0.5 (50%) whereas the RDA the risk of inadequacy is 0.025 (2.5%).
Figure 8.41 The EAR meets the needs of 50% of the population, RDA meets the needs of 97.5% of the population.
For nutrients lacking the research evidence needed to set an EAR, an AI is set instead. An Adequate Intake (AI) is a level that appears to be adequate in a defined population or subgroup. As you can see, the EAR is adequate for 50% of the population and is lower than the RDA. The RDA is adequate for 97.5% of the population, and higher than the EAR. The AI level of intake is believed to be between the EAR/RDA and the UL (Tolerable Upper Intake Level), but since it is not research-based, it is not exactly known where this level falls as shown below.
Figure 8.44 The AI compared to the other DRI components, the question mark and dotted line are meant to indicate that it is not known exactly where the AI would fall relative to an RDA if one was set.
The last of the DRIs is the Tolerable Upper Intake Level (UL). This is the highest level of daily nutrient intake that is unlikely to pose risk of adverse health effects to almost all individuals in
the population. To set this, the committee first sets a No Observed Adverse Effect Level (NOAEL) and/or the lowest observed adverse effect level (LOAEL). The UL is then set lower (as shown below) based on a number of uncertainty/safety factors, such as natural constituents, substances intentionally and directly added (i.e. food additives), substances indirectly added (i.e. pesticides), and contaminants such as naturally occurring chemicals, industrial products & by-products, and biological agents.2 The right vertical axis is used to represent the risk of an adverse event. Notice the NOAEL at the point where no adverse effects have been reported. The LOAEL is somewhere above the NOAEL. The UL is set at a level where it is believed that people will not experience the selected adverse effect.
Figure 8.45 Setting of the UL
How are Americans doing in meeting the DRIs? Figure 8.46 shows the percentage of Americans that are not meeting the EAR for some of the earlier micronutrients that had DRIs set. Keep in mind that the EAR is lower than the RDA.
Figure 8.46 Percent of Americans with usual intakes below the EAR1
Figure 8.47 Percent of Americans with usual intakes exceeding the AI1
As you can see, a large percentage of Americans don't meet the EAR for vitamin E, magnesium, vitamin A, and vitamin C. Also, keep in mind that this also does not include micronutrients that have AI instead of EARs and RDAs.
References & Links
Link
DRI Tables - https://fnic.nal.usda.gov/sites/fnic.nal.usda.gov/files/uploads/recommended_intakes_individu als.pdf
Chapter 9: Antioxidant Micronutrients
This chapter will describe what antioxidants are and then discuss the three major antioxidant micronutrients: vitamin E, vitamin C and selenium.
Antioxidants
The antioxidant vitamins and minerals include the following:
In this section, we are going to cover vitamin E, vitamin C, and selenium in detail because being an antioxidant is their primary function.
Subsections:
Free Radicals & Oxidative Stress
Before you can understand what an antioxidant is, it is important to have an understanding of oxidants. As you have learned already, oxidation is the loss of an electron as shown in Figure 9.111.
Figure 9.111 The purple compound is oxidized; the orange compound is reduced1
Some important terms to understand:
Free Radical - a molecule with an unpaired electron in its outer orbital.
The following example shows normal oxygen losing an electron from its outer orbital and thus, becoming an oxygen free radical.
Figure 9.112 Normal oxygen is converted to an oxygen free radical by losing one electron in its outer orbital, leaving one unpaired electron.
Free radicals are highly reactive because they actively seek an electron to stabilize (pair with) the unpaired electron within the molecule.
Reactive Oxygen Species (ROS) - an oxygen-containing, free radical species. Some of the most common ROS are (● symbolizes radical):
2
2
2
Oxidative Stress - the imbalance between the production of ROS/free radicals and the body’s
ability to quench them.
Free radicals can be generated by a variety of sources that can be classified as endogenous (within the body) and exogenous sources (outside the body). The link below is a figure that shows how ROS can be generated from each of these sources.
The Required Web Link below does a good job explaining what oxidative stress is, how free radicals can be formed, how they are neutralized by antioxidants, where we get antioxidants.
Required Web Link
What is Oxidative Stress, Free Radicals & Antioxidants
Figure 9.113 shows that inflammation caused by hitting your thumb with a hammer, exposure to UV light, radiation, smoking, and air pollution are all sources of free radicals.
Figure 9.113 Some sources of free radicals
So, we have these free radicals searching for an electron, what's the big deal? The problem arises if the free radicals oxidize LDLs, proteins, or DNA as shown below.
Figure 9.114 Free radicals can attack LDLs, proteins, and DNA2,3
Oxidized LDL is more likely to contribute to atherosclerosis (hardening of the arteries) than normal LDL. Protein oxidation is believed to be involved in the development of cataracts. Cataracts are the clouding of the lens of the eye. If nucleotides within DNA are oxidized, it can result in a mutation. A mutation is a change in the nucleotide or base pair sequence of DNA. Mutations are a common occurrence in cancer.
References & Links
1. http://en.wikipedia.org/wiki/Image:Gulf_Offshore_Platform.jpg
Links
What is Oxidative Stress, Free Radicals & Antioxidants - https://www.youtube.com/watch?v=9OgCjhAFCC0
Cataract Vision Simulator - https://www.aao.org/eye-health/diseases/cataracts-vision- simulator
What is an Antioxidant?
We are now ready to move on to antioxidants, which as their name indicates, combat free radicals, ROS, and oxidative stress. As a humorous introduction, the link below is to a cartoon that shows Auntie Oxidant kicking free radicals out of the bloodstream.
Required Web Link
Unfortunately, it's not quite that simple. You have probably heard the saying "take one for the team." Instead of taking one for the team, antioxidants "give one for the team." The ‘giving’ in this example is the donation of an electron from itself to a free radical, in order to regenerate a stable compound, as shown in Figure 9.121.
Figure 9.121 Regeneration of normal oxygen from oxygen free radical by the donation of an electron from an antioxidant
Donating an electron is how vitamins (A, C & E) act as antioxidants. Minerals, on the other hand, are not antioxidants themselves. Instead, they are cofactors for antioxidant enzymes.
These antioxidant enzymes include:
The actions of some of these enzymes is shown in Figure 9.122.
Figure 9.122 Antioxidant enzymes that use minerals as cofactors
Antioxidants are thought to work in concert with one another, forming what is known as the
antioxidant network. For example, vitamin E, vitamin C, and selenium often work together to process a single ROS as shown in Figure 9.123. (You do not have to memorize the intermediates right now, but as you get through the various subsections, they should start to make sense) Notice how the Vitamin E Cycle processes the ROS (reaction on the bottom left,) and then works with the Vitamin C Cycle, and finally the Selenium Cycle to eliminate the intermediate chemicals.
Figure 9.123 An example of an antioxidant network2
References & Links
Link
Auntie Oxidant - http://www.ibiblio.org/Dave/Dr-Fun/df200005/df20000523.jpg
Meaningful Antioxidant(s)
There is a lot of confusion among the public on antioxidants. For the most part, this is for a good reason. Many food companies put antioxidant numbers on the packages that sound good to consumers, who often have no idea how to interpret them. Thus, it is increasingly important to have an understanding of what a meaningful antioxidant actually is.
A meaningful antioxidant has two characteristics (these are based on the assumption that the compound is an antioxidant):
What do these mean? Let's consider the example of lycopene and vitamin E (alpha-tocopherol), which are both fat-soluble antioxidants. In a lab setting (in vitro), lycopene has been shown to be 10x more effective in quenching singlet oxygen than alpha-tocopherol1. However, when you look at the concentrations found in the body, there is far more alpha-tocopherol than lycopene as shown below:
Thus, despite the fact that lycopene is a better antioxidant in vitro, alpha-tocopherol is likely the more meaningful antioxidant in the body as evidenced by the fact that its concentration so much higher in the various tissues (locations of need.) In addition, if lycopene and alpha- tocopherol had similar antioxidant functions, lycopene’s potential antioxidant action is redundant to alpha-tocopherol’s antioxidant function and thus, is less likely to be a meaningful antioxidant.
References & Links
1. Erdman, J.W., Ford, N.A., Lindshield, B.L. Are the health attributes of lycopene related to its antioxidant function? Arch Biochem Biophys, 483: 229-235, 2009.
Too Much of a Good Thing? Antioxidants as Pro-oxidants
A clinical trial once found that high-dose beta-carotene supplementation increased lung cancer risk in smokers2. This is an example of findings that support that high doses of antioxidants may be “too much of a good thing”, causing more harm than benefit. The parabolic, or U-shaped figure, below displays how the level of nutrient concentration or intake (horizontal axis) relates to an antioxidant measure (vertical axis). The lowest level of antioxidant intake or tissue concentration results in nutrient deficiency if the antioxidant is essential (vitamins and minerals). Intake levels above deficient, but less than optimal, are referred to as low suboptimal. Suboptimal means the levels are not optimal. Thus, low suboptimal and high suboptimal sandwich optimal. The high suboptimal level is between optimal and where the nutrient becomes toxic.
Figure 9.142 How the levels of nutrient concentration or intake alters antioxidant measures in the body. Adapted from reference 1
Another example of this phenomenon can be seen when we look at DNA damage in the prostate gland of dogs as it relates to toenail selenium concentration measurements, which are a good indicator of long-term selenium status1. Researchers found that when they plotted prostate DNA damage (antioxidant measure) against toenail selenium status (nutrient concentration or intake) that it resulted in a U-shaped curve like the one shown above1. Thus, it is good to have antioxidants in your diet, but too much can be counterproductive.
References & Links
Vitamin E
There are 8 different forms of vitamin E: 4 tocopherols and 4 tocotrienols. The difference between tocopherols and tocotrienols is that the former have a saturated tail, while the latter have an unsaturated tail. Within tocopherols and tocotrienols, the difference between the different forms is the position of the methyl groups on the ring. The 4 different forms within the tocopherol and tocotrienols are designated by the Greek letters: alpha, beta, gamma, and delta. The difference in these structures is shown in the figures below. Notice the subtle differences down the left-hand side of the various structures.
Figure 9.21 Structures of the different forms of vitamin E
For reasons that will be covered in a later subsection, the primary form of vitamin E found in the body is alpha-tocopherol (the form discussed in Section 9.13.) The major, and possibly only, function of vitamin E is as an antioxidant. When it serves as an antioxidant it forms an alpha- tocopherol radical, as shown in Figure 9.23.
Figure 9.23 Conversion of alpha-tocopherol to alpha-tocopherol radical2
Alpha-tocopherol is believed to be the first part of the antioxidant network we saw earlier (shown below) where it is oxidized to donate an electron to stabilize reactive oxygen species. Alpha-tocopherol radical can then be reduced by the donation of an electron from ascorbate (vitamin C; also shown in Figure 9.23).
Figure 9.24 The theorized antioxidant network3
To help protect the antioxidant function of alpha-tocopherol in foods and during digestion (by preventing the formation of an alpha-tocopherol radical), some manufacturers have added compounds to the oxidation site of alpha-tocopherol. These are referred to as alpha- tocopherol derivatives. The most common forms are alpha-tocopherol acetate, alpha- tocopherol succinate, and alpha-tocopherol phosphate (Ester-E®).
Alpha-tocopherol derivatives, such as acetate in alpha-tocopherol acetate, are cleaved prior to absorption in the small intestine by enzymes known as esterases, meaning that alpha- tocopherol is absorbed, not the alpha-tocopherol derivative.
The Required Web Link below provides more information on vitamin E.
Required Web Link
Subsections:
References & Links
Links
Vitamin E Fact Sheet - https://ods.od.nih.gov/factsheets/VitaminE-HealthProfessional/
Vitamin E Absorption, Metabolism, & Excretion
In addition to being found naturally in foods, alpha-tocopherol can also be synthesized. It is important to know whether alpha-tocopherol is natural or synthetic because the structures differ between these forms. You might be saying to yourself, “who cares about natural versus synthetic alpha-tocopherol?” However, the small change in their structures makes a big difference in how alpha-tocopherol is maintained in the body.
All forms of vitamin E (tocopherols, tocotrienols) are absorbed equally. Fat-soluble vitamins (A, D, E, & K) are handled like lipids, and thus are incorporated into chylomicrons that have triglycerides removed by lipoprotein lipase (LPL). The chylomicron remnants containing the different forms of vitamin E are then taken up by the liver.
The liver contains a protein called alpha-tocopherol transfer protein (alpha-TTP), which is responsible for maintaining higher levels of alpha-tocopherol in the body. Alpha-TTP preferentially binds to all natural alpha-tocopherol, but only half of the synthetic variations. Thus, natural alpha-tocopherol is more easily metabolized than half of the synthetic variations. Other forms of vitamin E (gamma-tocopherol, tocotrienols) also don't bind well to alpha-TTP and thus, are found in lower levels than alpha-tocopherol in the body.
Once bound to alpha-TTP, alpha-tocopherol is incorporated into VLDL. From VLDL, vitamin E reaches tissues, with most vitamin E in the body being found in the adipose tissue. There are 2 main routes of vitamin E excretion. The major route of excretion is through bile, that is then excreted in feces. The second route is in the urine after vitamin E is processed to make it more water-soluble.
Reference
1. Traber MG, Elsner A, Brigelius-Floh R. (1998) Synthetic as compared with natural vitamin E is preferentially excreted as alpha-CEHC in human urine: Studies using deuterated alpha- tocopheryl acetates. FEBS Lett 437(1-2): 145-148.
Dietary Vitamin E, DRI & IUs
The best food sources of vitamin E are primarily oils and nuts. The forms of vitamin E that nuts and oils contain varies, with the two major forms being alpha and gamma-tocopherol. Soybean, corn, and flaxseed oils are good sources of gamma-tocopherol. Palm and canola oils contain almost equal amounts of alpha-tocopherol and gamma-tocopherol. Safflower oil, almonds, sunflower oil, and wheat germ oil are good sources of alpha-tocopherol. Beta-tocopherol and delta-tocopherol are found in lower levels in foods. Tocotrienols, for the most part, are not found in high levels in the diet. The various amounts of tocopherols in different nuts and oils are shown in Figure 9.221.
Figure 9.221 Tocopherol distribution in plant products1
Three-fourths of the oil Americans consume is soybean oil. As a result, it is estimated that we consume 2-4 times more gamma-tocopherol than alpha-tocopherol. Europeans consume more sunflower and canola oil, and thus, are believed to consume at least 2 times more alpha- tocopherol than gamma-tocopherol1.
These two forms of vitamin E are of particular interest to researchers. There is evidence that alpha-tocopherol plays a role in increasing prostate cancer, while gamma-tocopherol may
reduce a person’s risk for cardiovascular disease2,3.
Vitamin E DRI & IUs
Before 2001, ALL forms of vitamin E contributed to the RDA and were referred to as alpha- tocopherol equivalents. In 2001, the Dietary Reference Intake (DRI) committee decided only the forms of alpha-tocopherol that were bound by alpha-TTP should be used to estimate the requirement. Thus, other forms of vitamin E (gamma-tocopherol, tocotrienols etc.) do not count toward the requirement, and the unit of measure is now mg of alpha-tocopherol. As a result, soybean, corn, and flaxseed oils, which are good sources of gamma-tocopherol, are no longer considered to be good sources of vitamin E. Refer back to Figure 9.221 for a reminder of the tocopherol content of different nuts and oils.
Another level of complexity is added by the introduction of international units (IU). IUs are a unit that are used to describe the bioactivity of different compounds, including 4 vitamins: A, D,
E, and C. It would be less confusing if these units were not used. However, most supplements use IUs. IUs are not as common on food items.
For vitamin E, IUs are specific for alpha-tocopherol and adjusted accordingly for the different forms (alpha-tocopherol acetate etc.).
References & Links
Vitamin E Deficiency & Toxicity
Vitamin E deficiency is extremely rare. Depletion studies require years on a vitamin E-deficient diet to cause deficiency1. Deficiency primarily occurs in people with lipid malabsorption problems or Ataxia with Isolated Vitamin E Deficiency (AVED). Individuals with AVED have a mutation in their alpha-TTP (the liver protein that binds to vitamin E) that prevents it from functioning correctly. The primary symptoms of vitamin E deficiency are neurological problems.
High levels of vitamin E intake do not result in a noted toxicity. However, higher levels of intake are associated with decreased blood coagulation, and potentially an increased risk of prostate cancer. In particular, hemorrhagic stroke has been linked to high vitamin E levels. It is believed that this increased bleeding risk is due to a vitamin E metabolite that has anti-vitamin K (the clotting vitamin) activity. This potential antagonism will be described more in the vitamin K section.
References & Links
1. DRI (2000) Dietary reference intakes for vitamin C, vitamin E, selenium, and carotenoids.
Vitamin C
Vitamin C is well-known for being a water-soluble antioxidant. Humans are one of the few mammals that don't synthesize vitamin C, due to a mutation in our genetic code, making it an essential micronutrient. However, due to the prevalence of vitamin C in human diets, and our ability to efficiently recycle it, deficiencies are uncommon in developed countries1.
Vitamin C's scientific names are ascorbic acid or ascorbate, and the oxidized (radicalized) form is known as dehydroascorbic acid or dehydroascorbate. The structures of ascorbic acid and dehydroascorbic acid are shown in Figures 9.31 & 9.32.
Figure 9.31 Structure of ascorbic acid2
Figure 9.32 Structure of dehydroascorbic acid3. Notice the change in the two bottom OH groups from Figure 9.31.
Figure 9.33 shows the reaction through which ascorbic acid can stabilize, or quench, 2 free radicals. The 2 circled hydrogens are lost and replaced by double bonds when ascorbic acid is
oxidized to dehydroascorbic acid. Reducing dehydroascorbic acid back to ascorbic acid is the opposite reaction.
Figure 9.33 The oxidation-reduction reaction between ascorbic acid (left) and dehydroascorbic acid (right)2,3
Ascorbic acid is believed to be a part of the antioxidant network we see in the vitamin E section (shown below) where it is oxidized to reduce alpha-tocopherol radicals. Dehydroascorbic acid can be reduced by thioredoxin reductase, a selenoenzyme, to regenerate ascorbic acid.
Figure 9.34 The theorized antioxidant network4
For more information on vitamin C, see the Required Web Link below.
Required Web Link
Subsections:
References & Links
Links
Vitamin C Fact Sheet – https://ods.od.nih.gov/factsheets/VitaminC-HealthProfessional/
Vitamin C Absorption & Tissue Accumulation
Vitamin C is found in foods primarily as ascorbic acid (80-90%), but dehydroascorbic acid is also present (10-20%). The bioavailability (amount that enters the bloodstream) of vitamin C is high at lower doses as shown below, but drops to less than 50% at higher doses.
Table 9.311 Bioavailability of vitamin C1
Dose (mg) | % Bioavailability |
200 | 112 |
500 | 73 |
1250 | 49 |
Ascorbic acid is actively absorbed into the enterocyte by the sodium vitamin C cotransporter (SVCT) 1. It then diffuses along its concentration gradient into the bloodstream. Vitamin C generally circulates as ascorbic acid.
Figure 9.311 Ascorbic acid (Asc) absorption
Accumulation
Most water-soluble vitamins, including vitamin C are not stored in the body. However, it does accumulate in certain tissues in the body where its levels can be 5-100x higher than those found in the plasma2. The table below shows the concentrations of vitamin C in different tissues and fluids. Make note of which tissues/fluids have the highest concentrations, and which have the lowest concentrations.
Table 9.312 Human tissue & fluid ascorbic acid concentrations1
Organ/Tissue | Vitamin C Concentration* | Organ/Tissue | Vitamin C Concentration* |
Pituitary Gland | 40-50 | Lungs | 7 |
Adrenal Gland | 30-40 | Skeletal Muscle | 3-4 |
Eye Lens | 25-31 | Testes | 3 |
Liver | 10-16 | Thyroid | 2 |
Brain | 13-15 | Cerebrospinal Fluid | 3.8 |
Pancreas | 10-15 | Plasma | 0.4-1 |
Spleen | 10-15 | Saliva | 0.1-9.1 |
Kidneys | 5-15 |
* mg/100 g wet tissue, mg/100 mL fluids
References & Links
Enzymatic Functions of Vitamin C
In addition to its antioxidant function, vitamin C is also a cofactor for a number of enzymes that are important in the formation of the protein collagen.
Why should you care about collagen formation? Because collagen is estimated to account for 30% or more of total proteins in the body2. Collagen contains a number of hydroxylated amino acids that are needed for collagen strands to properly cross-link. This cross-linking is important for collagen to wind together like a rope, forming the strong triple helix known as tropocollagen. This process is shown in the Figure 9.321 below.
Figure 9.321 Production of cross-linked tropocollagen in the presence of adequate vitamin C
But if there isn't enough ascorbic acid available, the collagen strands are underhydroxylated and instead of forming strong tropocollagen, the underhydroxylated collagen is degraded as shown below.
Figure 9.322 Production of underhydroxylated collagen
This weak collagen then results in the symptoms seen in scurvy that will be discussed in the next subsection.
Ascorbic Acid is also needed for2:
References & Links
Vitamin C Deficiency (Scurvy)
Why should you care about the functions of vitamin C? Because they explain the symptoms of vitamin C deficiency. While it is rare in the United States, vitamin C deficiency, known as scurvy,
displays symptoms that are a result of weak collagen, that in turn, weakens connective tissue throughout the body. Symptoms of scurvy include bleeding gums, pinpoint hemorrhages, and corkscrew hairs as shown in Figure 9.331 and Required Web Link on the next page.
Figure 9.331 Bleeding gums that occur in scurvy1
Required Web Link
Additional symptoms include impaired wound and fracture healing, easy bruising, and loose or decaying teeth. Scurvy can be fatal if not treated. Scurvy was the first discovered nutrition deficiency in 1746 by James Lind, who is shown below3.
Figure 9.332 Dr. James Lind discovered that scurvy was caused by a nutrition deficiency3
Lind was a surgeon on a British navy ship. Frequently during voyages the sailors would develop scurvy for reasons that weren't understood at the time. It was known that citrus fruits could cure or prevent scurvy, but it was believed this was due to their acidity. Lind performed clinical trials comparing citrus juice to dilute sulfuric acid and vinegar (acetic acid), and found that only citrus juice caused the sailors to recover, indicating that it was something in the citrus juice itself, and not its acidity, that prevented/cured scurvy. This is depicted in the Required Web Link, showing a sailor being treated with a lemon, below. As a result of the discovery, the British sailors became known as "Limeys" because they would drink limejuice to prevent the development of the disease4. The Required Web Link is a good video on this subject.
Required Web Link
Video: Vitamin C and the Limeys (7:21)
References & Links
Links
Corkscrew Hairs - http://www.nlm.nih.gov/medlineplus/ency/imagepages/2345.htm Vitamin C and the Limeys - https://www.youtube.com/watch?v=Mp9II8MmuoA&feature=youtu.be
Vitamin C Toxicity, Linus Pauling & the Common Cold
Vitamin C does not have a toxicity per se, but in some people, over 2 grams/day can lead to diarrhea and gastrointestinal distress. In addition, high supplementation of vitamin C increases the excretion oxalate in urine which may lead to the formation of calcium oxalate in the kidneys1. Calcium oxalate is one of the primary forms of kidney stones. However, a direct link between excretion of oxalate and actual stone formation hasn't been established1.
Nevertheless, high-dose vitamin C supplementation should be approached with some caution,
since it is not clear whether it increases the risk of forming kidney stones2.
The figures below show the most common sites of pain in someone with kidney stones.
Figure 9.341 Kidney stones normally cause pain in the shaded areas3
The Required Web Links below include a video that describes what kidney stones are, the symptoms of having stones, and some pictures of kidney stones.
Required Web Links
Video: Kidney Stones (1:16) Kidney Stones
Linus Pauling and the Common Cold
The person who popularized taking mega-doses of vitamin C was Dr. Linus Pauling. Dr. Pauling was a chemist, and is the only person to receive 2 unshared Nobel Prizes. The Nobel Prize is a prestigious award, and Dr. Pauling was close to solving the structure of DNA. This would have likely netted him another Nobel prize, but Watson and Crick beat him to it.
Later in his life Pauling became convinced that mega-doses of vitamin C could prevent the common cold. In 1970, his book Vitamin C and the Common Cold was released and became a bestseller. Later he came to believe that vitamin C could prevent cardiovascular disease, cancer, and combat aging5. However, critics of his beliefs countered that all mega-dose supplementation was doing was creating "expensive urine". This refers to the fact that the RDA is only 75-90 mg/day for adults and Pauling recommended taking 1-2 grams of vitamin C daily6.
Thus, with vitamin C being water-soluble, most of the vitamin C that people on the regimen
were paying to consume was being excreted in the urine, thus making it “expensive”.
A recent review of vitamin C and colds found that that routine mega-doses of vitamin C do not reduce the risk of the common cold in most individuals. However, there is some evidence that it might benefit people exposed to brief periods of severe physical exercise (marathon runners) or cold environments (skiers and soldiers in subarctic conditions). There has been little research conducted in children, so it is not known whether vitamin C supplementation is beneficial in this age group7.
References & Links
Cochrane Database of Systematic Reviews 2007, Issue 3. Art. No.: CD000980. DOI: 10.1002/14651858.CD000980.pub3.
Video
Kidney Stones - https://www.youtube.com/watch?v=16ewFJ-iQtw
Links
Kidney Stones - http://www.herringlab.com/photos/index.html
Selenium
Selenium is a mineral, rather than a vitamin as we’ve been discussing, that can be divided into 2 categories: organic and inorganic. The organic forms contain carbon, while the inorganic forms do not. The primary inorganic forms of selenium are selenite (SeO3) and selenate (SeO4).
Selenite and selenate are not commonly found alone in nature; they are usually complexed with sodium to form sodium selenite (Na2SeO3) and sodium selenate (Na2SeO4)1.
Selenomethionine is the most common organic form of selenium.
While selenium has both animal and plant sources, the selenium content of plants is dependent on the soil where they are grown.
As shown in Figure 9.41, soil selenium levels vary greatly throughout the United States, meaning that the selenium content of plant foods also greatly vary.
Figure 9.41 United States soil selenium levels2
The above map is interactive, so to see the soil selenium levels in a certain county or state, click on it in the link below. What are soil selenium levels where you live?
Required Web Link
Inorganic forms of selenium are commonly used in supplements. Selenomethionine is the most common organic form of selenium in supplements and food. It is found in cereal grains such as wheat, corn, and rice as well as soy. Yeast are typically used to produce selenomethionine for supplements.
It should be noted that selenomethionine accumulates at much higher levels in the body than other forms of selenium. This is because it can be nonspecifically incorporated into body proteins in place of the amino acid methionine.
For more information on selenium, see the Required Web Link below.
Required Web Link
Subsections:
References & Links
Link
USGS Soil Selenium Levels - http://tin.er.usgs.gov/geochem/doc/averages/se/usa.html Selenium Fact Sheet - https://ods.od.nih.gov/factsheets/Selenium-HealthProfessional/
Selenoproteins
Selenium's antioxidant function is not due to the mineral itself, but a result of selenoproteins.
Selanoprotein refers to any protein containing the amino acid selenocysteine.
25 human selenoproteins have been identified. For the vast majority of the other selenoproteins, their function isn't known. However, there are 2 primary functions of selenoproteins that are known1-3:
Now see how selenium completes the antioxidant network we’ve seen a few times before. Thioredoxin reductase (a selenoprotein) can regenerate ascorbate from dehydroascorbate in the theorized antioxidant network (shown in Figure 9.411).
Figure 9.411 The theorized antioxidant network4
References & Links
Selenium Absorption, Excretion, Toxicity & Its Questionable Deficiency
Selenium is highly absorbed by the body. Thus, selenium levels are not regulated by absorption, but rather by urinary excretion. Organic selenium forms may be absorbed slightly better than inorganic forms, as one study found that 98% of a dose of selenomethionine (organic form) was absorbed, compared to 84% of selenite (inorganic form)1.
Selenium is primarily excreted in the urine, but at high levels it can be eliminated in exhaled air, producing garlic odor breath.
Selenium toxicity can be a problem, especially for animals living in or around bodies of water in areas with high soil selenium levels. This is because runoff from the soil causes selenium to
collect in the water at high levels. Then the selenium starts working its way up the food chain and causing problems, as shown in the following link.
Required Web Link
In humans, the initial symptoms are nausea, fatigue, and diarrhea. If continued, the person may develop hair and nail brittleness, rash or skin lesions, and nervous system abnormalities.
One disease known to be caused by a selenium deficiency is Keshan disease. Keshan disease is a congestive cardiomyopathy (heart disease) caused by a combination of dietary deficiency of selenium and the presence of a mutated strain of coxsackievirus. Researchers determined that a selenium deficient diet caused the virus undergo a mutation turning it into a more virulent (infectious) form3. Similar results have been seen in recent experiments using vitamin E5.
Researchers are also examining the effects of vitamin deficiencies on other viruses, such as influenza (flu) and HIV. Finding similar phenomena in these or other viruses could shed light on new methods of treating or preventing some diseases.
References & Links
Trends Microbiol 12(9): 417-423.
Links
Selenium Toxicity - http://www.sci.sdsu.edu/salton/SeTooMuchTooLittle.html
Macronutrient Metabolism Micronutrients
The macronutrient metabolism vitamins and minerals are:
All but three of these will be covered in this section. Vitamin B12 will be covered in the one- carbon metabolism chapter, vitamin C was covered in the antioxidant chapter, and magnesium is going to be covered in the electrolyte chapter. We're left with iodine, manganese, and many of the B vitamins. We'll cover the 2 minerals followed by the B vitamins with the order for the sections as follows:
Iodine
Why is iodine first in this chapter? Not only is it the only non-B vitamin in this chapter, but there is also a connection between selenium (discussed in the previous chapter) and iodine. Iodine's only, yet critical, function is that it is required for thyroid hormone synthesis. Figure 10.11
shows that the thyroid gland is a butterfly-shaped organ found in the neck. The parathyroid glands are also found within the thyroid gland.
Figure 10.11 Location of thyroid and parathyroid glands1
Iodine is found in foods primarily in its ionized form, known as iodide (I-). Like selenium, soil concentrations of iodide vary greatly, thus causing food concentrations to greatly fluctuate. Sea water is high in iodine, thus foods of marine origin, such as seaweed and seafood, are good dietary sources of iodine. Dairy products also tend to be good sources of iodide because it is added to cattle feeds. Cattle also receive iodine-containing medications, and iodide-containing sanitizing solutions are used in dairy facilities, both of which also contribute to the iodine levels in dairy products,4.
Iodine is well absorbed (~90%), and most Americans consume ample iodine through the consumption of iodized salt. Consumption of 1/2 teaspoon of iodized salt meets the RDA for iodine.
The link below is a video that illustrates the reduction in iodine deficiency over the last 2 decades.
Required Web Link:
Salt is iodized with either potassium iodide (KI) or potassium iodate (KIO3). The positives of each are:
Potassium iodide
+ Less expensive
+ Higher iodine content (76% vs. 59% for KIO3)
+ More soluble
Potassium Iodate
+ More stable
The U.S. uses potassium iodide for supplementation, but the form and amount used varies from country-to-country. Most Americans’ salt intake comes from processed foods, many of which are made with non-iodized salt. Some dietary compounds interfere with thyroid hormone production or utilization. These compounds are known as goitrogens due to the increased likelihood of goiter (discussed in Section 10.12) formation5.
Some examples of foods that contain goitrogens are3,4,6:
Figure 10.12 Cassava plants are typically grown in tropical and subtropical environments6
Figure 10.13 The cassava roots are what are typically eaten, but first they must be peeled.
Unprocessed cassava is on the left, and peeled cassava root is on the right7, 8
Figure 10.14 Millet growing in a field9
Figure 10.15 Millets10
For more information on iodine, see the Required Web Link below.
Required Web Link:
Iodine Fact Sheet for Health Professionals
Subsections:
References & Links
Links
Global Iodine Scorecard - http://www.ign.org/scorecard.htm
Iodine Fact Sheet for Health Professionals - https://ods.od.nih.gov/factsheets/Iodine- HealthProfessional/
Thyroid Hormone
The thyroid accumulates most absorbed iodine, keeping it for use to synthesize thyroid hormone. The following video shows the thyroid and describes its function.
Required Web Link
As mentioned in the video, the two primary forms of thyroid hormone are triiodothyronine (T3) and thyroxine (T4). T4 is the primary circulating form, and is really a prohormone that is converted to the active T3 form.
The enzymes that metabolize thyroid hormones are known as deiodinases. There are three deiodinases (Type I, Type II, Type III) that are selenoenzymes whose location and function are summarized in the table below.
Table 10.11 Location and function of the three deiodinases1
Enzyme | Tissues | Function |
Deiodinase Type I (DI1) | Liver, kidney, thyroid gland | Plasma T3 production |
Deiodinase Type II (DI2) | Brain, pituitary, brown adipose | Local T3 production |
Deiodinase Type III (DI3) | Brain, placenta | T3 degradation |
Thyroid hormone regulates the basal metabolic rate and is important for growth and development. Thyroid hormone is particularly important for brain development, but
hypothyroidism (low thyroid hormone) also leads to decreased muscle mass and skeletal development1.
References & Links
1. Stipanuk MH. (2006) Biochemical, physiological, & molecular aspects of human nutrition. St. Louis, MO: Saunders Elsevier.
Video
Thyroid - http://www.youtube.com/watch?v=7V0HB4cKIMw
Iodine Deficiency & Toxicity
There are two iodine deficiency disorders (IDD): goiter and cretinism. Goiter is a painless deficiency condition that results from the enlargement of the thyroid to help increase its ability to take up iodine. A couple of pictures of goiters are shown below.
Figure 10.121 Pictures of women with goiters1,2
A more serious consequence of iodine deficiency occurs during pregnancy to the fetus. Iodine deficiency during this time can lead to the mental and physical retardation known as cretinism. This condition is characterized by severe hypothyroidism, stunted growth, speech loss, and paralysis3,4. The following links show some examples of individuals with cretinism.
Required Web Link
The World Health Organization calls iodine deficiency "the world's most prevalent, yet easily preventable, cause of brain damage5." By saying it is easily preventable, they are referring to the ability of salt iodization to prevent brain development problems. The New York Times article in the following Required Web Link talks about how salt iodization may be the cheapest way to raise the world's IQ.
Required Web Link
In Raising the World's I.Q., the Secret's in the Salt
Iodine toxicity is rare, but like iodine deficiency, it can result in thyroid enlargement, and hypothyroidism or hyperthyroidism. Acute toxicity results in gastrointestinal irritation, abdominal pain, nausea, vomiting, and diarrhea6.
References & Links
Links
Cretinism - http://www.gsi.ir/Images/MedicalGeology/cretinism1.jpg
In Raising the World’s I.Q., the Secret’s in the Salt - http://www.nytimes.com/2006/12/16/health/16iodine.html?_r=1&pagewanted=all
Manganese
We know far less about manganese than many other minerals. Like many minerals, it serves as a cofactor for a number of enzymes. Some examples are listed below.
Rich sources of manganese are whole grains, nuts, leafy vegetables, and teas4. Absorption of manganese is not well understood but is believed to be pretty low (<5%). The main route (90%) of excretion is via bile excreted in feces5. Deficiency and toxicities of manganese are extremely rare. The deficiency is so rare in humans that there isn't much information available on the symptoms of the condition. Symptoms in those who were deliberately made deficient include vomiting, dermatitis, changes in hair color, & skeletal defects5. Toxicity symptoms include neurological disorders similar to schizophrenia and Parkinson's disease. In Chilean miners exposed to Mn-containing dust the toxicity was named Manganese Madness2,3.
References & Links
Thiamin (Vitamin B1)
Thiamin in a water-soluble B vitamin consisting of 2 rings that are bridged together as shown below.
Figure 10.31 Structure of thiamin1
Because it was one of the original vitamins, (remember vitamine), it was originally named thiamine. The -e has since been dropped from its spelling. Thiamin is sensitive to heat, so prolonged heating, such as during cooking, causes the cleavage of thiamin between the 2 rings destroying its activity2.
Like most of the B vitamins, thiamin's primary function is as a cofactor for enzymes. It is not thiamin alone that serves as a cofactor, but instead thiamin diphosphate (thiamin + 2 phosphates), which is more commonly referred to as thiamin pyrophosphate (TPP). The structure of thiamin pyrophosphate is shown below.
Figure 10.32 Structure of thiamin pyrophosphate (aka thiamin diphosphate)3
Common sources of thiamin include whole grains, meat, and fish. The most common sources of thiamin in American diets are cereals and bread. Pork is also a good source of thiamin, while fruits and dairy products generally have low levels6.
In plants, thiamin is found in its free form, but in animals it is mostly thiamin pyrophosphate. These phosphates must be cleaved before thiamin is taken up into the enterocyte4.
Thiamin uptake and absorption is believed to be an efficient process that is passive when thiamin intake is high and active when thiamin intakes are low4. There are two thiamin transporters (THTR), THTR1 and THTR2, that are involved in thiamin uptake and absorption. THTR1 is found on the brush border and basolateral membrane, while THTR2 is only found on the brush border membrane as shown in Figure 10.335.
Figure 10.33 Thiamin uptake and absorption
Like most water-soluble vitamins there is little storage of thiamin. For more information on thiamin, see the Required Web Link below.
Required Web Link:
Thiamin Fact Sheet for Health Professionals
Subsections:
References & Links
Links
Thiamin Fact Sheet for Health Professionals - https://ods.od.nih.gov/factsheets/Thiamin- HealthProfessional/
Thiamin Functions
There are three functions of thiamin1:
Decarboxylation Reactions
A decarboxylation reaction is one that results in the loss of carbon dioxide (CO2) from the molecule as shown below.
Figure 10.311 Decarboxylation reaction2
The transition reaction and one reaction in the citric acid cycle are decarboxylation reactions that use TPP as a cofactor. The conversion of pyruvate to acetyl CoA in the transition reaction is a decarboxylation reaction that requires TPP as a cofactor. CO2 is produced as a result of this reaction.
A similar TPP decarboxylation reaction occurs in the citric acid cycle converting alpha- ketoglutarate to succinyl-CoA. CO2 is also given off as a result of this reaction as well.
TPP also functions as a cofactor for the decarboxylation of valine, leucine, and isoleucine (branched-chain amino acids)1.
Synthesis of Pentoses and NADPH
TPP is a cofactor for the enzyme transketolase. Transketolase is a key enzyme in the pentose phosphate pathway. This pathway is important for converting 6-carbon sugars into 5-carbon sugars (pentose) that are needed for synthesis of DNA, RNA, and NADPH. In addition, pentoses such as fructose are converted to forms that can be used for glycolysis and gluconeogenesis3.
Membrane and Nerve Conduction
In addition to its cofactor roles, thiamin, in the form of thiamin triphosphate (TTP, 3 phosphates), is believed to contribute to nervous system function, but its exact role is not yet fully understood1.
References & Links
Thiamin Deficiency & Toxicity
Thiamin deficiency is rare in developed countries, but still occurs in poorer countries where white (a.k.a. polished) rice is a staple food. During the polishing process, thiamin, and many other nutrients, are removed. Some people also have a mutation in THTR1 (the thiamin transporter mentioned above) that causes them to become thiamin deficient1. Thiamin deficiency is known as beriberi, which, when translated, means "I can't, I can't." The symptoms of beriberi are illustrated in the Required Web Link below.
Required Web Link
There are two major forms of beriberi: dry and wet. Dry beriberi affects the nervous system, with symptoms such as loss of muscle function, numbness, and/or tingling. Wet beriberi affects the cardiovascular system resulting in pitting edema, along with enlargement of the heart1. A picture of a person with beriberi is shown in Figure 10.321.
Figure 10.321 A person suffering from beriberi2
Another group that is at risk for thiamin deficiency is alcoholics. There are three reasons why alcoholics are prone to becoming deficient3:
The thiamin deficiency found in alcoholics is known as Wernicke-Korsakoff Syndrome. Symptoms of this condition include paralysis or involuntary eye movement, impaired muscle coordination, memory loss and confusion3. The TV show House is fictional, but the writers did use real medical information to script their episodes as you can see below.
Required Web Link
Video: Dr. House Explains Korsakoff Syndrome
Thiamin toxicity has never been reported as a result of oral intake. Thus, there is little worry about thiamin toxicity4.
References & Links
Links
Beriberi - http://www.moondragon.org/health/graphics/beriberi1.jpg
Dr. House Explains Korsakoff Syndrome - https://www.youtube.com/watch?v=KgxV-kfOnJE
Riboflavin (Vitamin B2)
A student once asked this question:
"I started taking this Super Athlete Multivitamin I bought from the health food store and about an hour or two after consumption, my pee is bright, practically neon yellow. What does that mean?"
The culprit is the vitamin riboflavin found in the Super Athlete Multivitamin. Indeed, flavin in the name riboflavin means yellow in Latin, and riboflavin in solution is bright yellow, as shown below.
Figure 10.41 Riboflavin in solution1
Riboflavin is also a water-soluble B vitamin, so the student was excreting large amounts of riboflavin in his urine, leading it to become "bright, practically neon yellow."
Riboflavin is important for the production of two cofactors: flavin adenine dinucleotide (FAD) & flavin mononucleotide (FMN).
FAD has been introduced before (Chapter 6). FMN is similar to FAD, except that it only contains one phosphate group (versus 2) and doesn't have ring structures attached to the phosphate groups that are found in FAD.
Riboflavin is photosensitive, meaning that it can be destroyed by light. This was a problem in the old days when the milkman delivered milk in clear glass bottles, resulting in the destruction of the riboflavin in the milk. These have now been replaced by cartons or opaque plastic containers to help protect the riboflavin content of the milk.
Figure 10.42 Milk is no longer packaged in clear glass bottles to help protect its riboflavin from light destruction
Foods that are particularly rich in riboflavin include eggs, organ meats (kidneys and liver), lean meats, and milk. Green vegetables also contain riboflavin. Grains and cereals are fortified with riboflavin in the United States and many other countries. The largest dietary contributors of total riboflavin intake in U.S. men and women are milk and milk drinks, bread and bread products, mixed foods whose main ingredient is meat, ready-to-eat cereals, and mixed foods whose main ingredient is grain. The riboflavin in most foods is in the form of FAD, although the main form in eggs and milk is free riboflavin4.
Riboflavin in foods is free, protein-bound, or in FAD or FMN. Only free riboflavin is absorbed so it must be cleaved, or converted before absorption2. Riboflavin is highly absorbed through a yet unknown process, though it is believed a carrier is involved3. As you would guess from the description above, riboflavin is primarily excreted in the urine.
For more information on thiamin, see the Required Web Link below.
Required Web Link:
Riboflavin Fact Sheet for Health Professionals
Subsections:
References & Links
Riboflavin Functions
Riboflavin is required for the production of FAD and FMN. Below are some of the functions of FAD and FMN1:
In addition to the functions listed above, FAD is also used in folate activation, choline catabolism, and purine metabolism1.
References & Links
1. Gropper SS, Smith JL, Groff JL. (2008) Advanced nutrition and human metabolism. Belmont, CA: Wadsworth Publishing.
Riboflavin Deficiency & Toxicity
Ariboflavinosis, riboflavin deficiency, is a rare condition that often occurs with other nutrient deficiencies. The symptoms of this condition include:
The most notable symptoms include angular stomatitis which is a lesion that forms at the corners of the mouth as shown in Figure 10.421.
Figure 10.421 Angular Cheilitis2
Glossitis is the inflammation of the tongue, which can be accompanied by redness or inflammation of the oral cavity. Dermatitis is also frequently a symptom3,4.
There has been no toxicity of riboflavin reported.
References & Links
Niacin (Vitamin B3)
Niacin is a water-soluble B vitamin. There are two forms of niacin: nicotinic acid and nicotinamide (a.k.a. niacinamide).
Niacin is important for the production of two cofactors: nicotinamide adenine dinucleotide (NAD) and nicotinamide adenine dinucleotide phosphate (NADP+).
NAD is reduced to form NADH, as shown below.
Figure 10.54 Reduction of NAD to NADH1
The structure of NADP+ is exactly the same as NAD, except it has an extra phosphate group off the bottom of the structure, as shown below.
Figure 10.55 Structure of NADP+2
Like NAD, NADP+ can be reduced to NADPH.
Niacin is unique in that it can be synthesized from the amino acid tryptophan as shown in Figure 10.56. An intermediate in this synthesis is kynurenine. Many reactions occur between this compound and niacin, and riboflavin and vitamin B6 are required for two of these reactions.
Figure 10.56 Tryptophan can be used to synthesize niacin3
To account for niacin synthesis from tryptophan, niacin equivalents (NE) were created by the DRI committee. NE are designed to measure the amount of niacin in foods, as well as their tryptophan content. It takes approximately 60 mg of tryptophan to make 1 mg of niacin. Thus, the conversions to niacin equivalents are:
1 mg Niacin = 1 NE
60 mg Tryptophan = 1 NE
The tryptophan levels of most foods are not known, but a good estimate is that tryptophan is 1% of amino acids in protein4.
Most niacin we consume is in the form of nicotinamide and nicotinic acid5, and in general is well absorbed using a yet unidentified carrier molecule6. However, in corn, wheat, and certain other cereal products, niacin bioavailability is low. In these foods, some niacin (~70% in corn) is tightly bound, making it unavailable for absorption. Treating the grains with a base frees the niacin and allows it to be absorbed. After absorption nicotinamide is the primary circulating form4,5.
Subsections:
References & Links
Niacin Functions
Approximately 200 enzymes require NAD or NADP+. Some selected functions of NAD and NADP+ include1:
References & Links
1. Gropper SS, Smith JL, Groff JL. (2008) Advanced nutrition and human metabolism. Belmont, CA: Wadsworth Publishing.
Niacin Deficiency & Toxicity
Pellagra is a niacin deficiency. This is no longer a common deficiency in developed countries, but was in the U.S. in the early 1900s. This was because corn was a staple crop, meaning it was what people primarily consumed. The bioavailability of niacin from corn is poor unless properly treated to release the bound niacin. The symptoms of pellagra are the 3 D's:
Some refer to 4 D's in which the 4th D is death if the condition is not managed.
Figure 10.521 A man with pellagra; notice the dermatitis on his arms1
The Required Web Link below shows another picture of a person suffering from dermatitis as a result of pellagra.
Required Web Link
Dietary niacin toxicity is rare. However, nicotinic acid (not nicotinamide) can improve people's lipid profiles when consumed at levels far above the RDA. For instance, the RDA & upper limit (UL) is 14 or 16 (women & men) and 35 mg (both), respectively. Many people are taking 1-2 grams (up to 6 g/day) to get the benefits in their plasma lipid profiles as shown in the table below3,4.
Table 10.521 Effects of nicotinic acid (>1.5 g/day) on plasma lipid profile2
Measure | Change |
VLDL | ↓ 25-40% |
LDL | ↓ 6-22% |
HDL | ↑ 18-35% |
Total Cholesterol | ↓ 21-44% |
Triglycerides | ↓ 21-44% |
It should be pointed out that there are special supplements for this purpose that include a slower release nicotinic acid that helps prevent the toxicity symptoms (nicotinamide is not toxic). A slow (a.k.a. long or extended) release form of niacin for people with atherosclerosis is Niaspan®.
A study found that Niaspan plus a statin was no better than a statin alone in preventing heart attacks, despite improvements in HDL and triglyceride levels. This result challenged the understanding of the importance of HDL and triglyceride levels to heart attack risk. The link below explains this study’s results.
Required Web Link
Niacin Drugs Don't Reduce Heart Attack Risk
The most well-known of the toxicity symptoms is "niacin flush", which is a dilation of capillaries accompanied by tingling that can become painful. This symptom is noted to occur at lower levels than the other toxicity symptoms5. Other symptoms include:
A nicotinic acid receptor present in adipocytes and immune cells, has been believed to mediate niacin flush, but the beneficial effects on lipid profiles do not appear to be mediated by this
receptor6,7. It is not clear at this time the mechanism of action for the improvements in lipid profiles6.
References & Links
Links
Pellagra - http://www.pathguy.com/lectures/mcgill_pellagra.jpg Niacin Drugs Don't Reduce Heart Attack Risk - http://www.nytimes.com/2011/05/27/health/policy/27heart.html
Pantothenic Acid (Vitamin B5)
Pantothenic acid is a water-soluble B vitamin that has two primary roles in the body:
Coenzyme A
The structure of pantothenic acid is shown alone below and circled within coenzyme A which we discussed in Chapter 6.
Figure 10.61 The structure of pantothenic acid1
Figure 10.62 The structure of coenzyme A (CoA) with the pantothenic acid circled2
The functions of CoA include3:
Acyl Carrier Protein
Acyl carrier protein, is also important in fatty acid synthesis3.
Animal liver and kidney, fish, shellfish, pork, chicken, egg yolk, milk, yogurt, legumes, mushrooms, avocados, broccoli, and sweet potatoes are good sources of pantothenic acid. Whole grains are also good sources of pantothenic acid, but processing and refining grains may result in a 35 to 75% loss. Freezing and canning of foods result in similar losses5.
Most pantothenic acid in food is found as CoA, which is cleaved prior to absorption. It is then taken up into the enterocyte through the sodium-dependent multivitamin transporter (SMVT) as shown below. Approximately 50% of pantothenic acid is absorbed; it is excreted primarily in urine3.
Figure 10.66 The absorption of pantothenic acid
Deficiency of pantothenic acid is very rare. Pantothenic acid supplementation did relieve the symptoms (burning feet and numbness of toes) of "burning feet syndrome" in prisoners in World War II4. It is believed pantothenic acid deficiency was the cause of this syndrome. Other symptoms noted are vomiting, fatigue, weakness, restlessness, and irritability3. No toxicity has been reported.
References & Links
Vitamin B6
Vitamin B6 is one of two B vitamins that isn’t usually referred to by its chemical name. This is due to the fact that it is composed of three compounds instead of just one: pyridoxine, pyridoxal, and pyridoxamine. Like all B vitamins, it is water-soluble.
All three forms can be activated by being phosphorylated (having a phosphate group added). In animal products, vitamin B6 is found in its phosphorylated forms, pyridoxal phosphate (PLP) and pyridoxamine phosphate (PMP). PMP is less common than PLP, however. In plants, vitamin B6 is primarily found as pyridoxine, with up to 75% being pyridoxine glucoside, which is believed to be the plant storage form1.
Vitamin B6 is found in a wide variety of foods. The richest sources of vitamin B6 include fish, beef liver and other organ meats, potatoes and other starchy vegetables, and fruit (other than citrus). In the United States, adults obtain most of their dietary vitamin B6 from fortified cereals, beef, poultry, starchy vegetables, and some non-citrus fruits. About 75% of vitamin B6 from a mixed diet is bioavailable2.
Vitamin B6 is well absorbed from foods (~75%) through passive diffusion. PLP and PMP from animal products are dephosphorylated before uptake into the enterocyte. The pyridoxamine glucoside from plants is cleaved to form free pyridoxine, but some pyridoxine glucoside is absorbed intact. Pyridoxine glucoside absorption is lower (~50%) than pyridoxine alone. The primary circulating forms of vitamin B6 are pyridoxal and PLP.
Vitamin B6 is primarily excreted in the urine, and like many other B vitamins, vitamin B6 is destroyed during cooking or heating1.
For more information on Vitamin B6, see the Required Web Link below.
Required Web Link:
Vitamin B6 Dietary Supplement Fact Sheet
Subsections:
References & Links
Vitamin B6 Functions
PLP is a cofactor for over 100 different enzymes, most are involved in amino acid metabolism. In fact, without PLP, all amino acids would be essential amino acids because we would not be able to synthesize nonessential amino acids. Functions of PLP and PMP include1:
References & Links
1. Gropper SS, Smith JL, Groff JL. (2008) Advanced nutrition and human metabolism. Belmont, CA: Wadsworth Publishing.
Vitamin B6 Deficiency & Toxicity
Vitamin B6 deficiency is rare, but symptoms include:
Given what we know about the functions of vitamin B6 most of these symptoms make sense.
The microcytic hypochromic anemia is a result of decreased heme synthesis. The neurological symptoms are due to the decreased production of neurotransmitters1.
Vitamin B6, unlike many of the other B vitamins, can produce toxicity. High doses of vitamin B6, taken for an extended period of time, can lead to neurological damage1. There are, however, some potential uses of vitamin B6 supplementation. In these cases, it is important that the supplementation be done with consultation with a physician.
One of the conditions that people may take vitamin B6 for is carpal tunnel syndrome. While the evidence is not conclusive, it appears that vitamin B6 supplementation may be beneficial, and may be used alone, or in combination with other complementary treatments, before surgery is undertaken2,3.
Morning sickness that occurs early in pregnancy is another condition where vitamin B6 supplementation is sometimes utilized. The evidence again is not clear on whether it is beneficial4,5, but the American College of Obstetricians and Gynecologists suggests that vitamin B6 may be tried to treat nausea and vomiting during pregnancy6. In 2013, the FDA approved doxylamine-pyridoxine (Diclegis) for use in pregnancy7. It is not known exactly what causes morning sickness, but it is believed that lower circulating vitamin B6 levels are associated with increased morning sickness severity8.
The last condition for which vitamin B6 is commonly supplemented is premenstrual syndrome (PMS). However, a systematic literature review found that it is inconclusive whether vitamin B6 supplementation is beneficial in managing PMS9.
References & Links
Biotin (Vitamin B7)
Biotin is a water-soluble B vitamin that is primarily found in 2 dietary forms; free biotin and
biocytin (a.k.a. biotinyllysine)1. Biocytin is biotin bound to the amino acid lysine.
Many foods contain some biotin. Foods that contain the most biotin include organ meats, eggs, fish, meat, seeds, nuts, and certain vegetables (such as sweet potatoes). The biotin content of food can vary; for example, plant variety and season can affect the biotin content of cereal grains, and certain processing techniques (e.g., canning) can reduce the biotin content of foods4.
Dietary avidin, a glycoprotein in raw egg whites, binds tightly to dietary biotin and prevents
biotin’s absorption in the gastrointestinal tract. Cooking denatures avidin, making it unable to interfere with biotin absorption.
Free biotin is believed to be highly absorbed. Before uptake, biocytin is acted on by the enzyme biotinidase, forming free biotin and lysine. Free biotin is then taken up into the enterocyte through the sodium-dependent multivitamin transporter (SMVT), as shown below1,2,4.
Figure 10.83 Free biotin is taken up into the enterocyte by the SMVT. Most biotin, like all water-soluble B vitamins, is excreted in the urine. For more information on biotin, see the Required Web Link below.
Required Web Link:
Biotin Fact Sheet for Health Professionals
Subsections:
References & Links
Links
Biotin Fact Sheet for Health Professionals - https://ods.od.nih.gov/factsheets/Biotin- HealthProfessional/#h3
Biotin Functions
Biotin is an important cofactor for carboxylase enzymes. As the name sounds, these enzymes add carboxylic acid groups (-COOH) to whatever compound they act on. In fatty acid synthesis, biotin is required by the enzyme that forms malonyl CoA from acetyl-CoA, as shown below1.
Figure 10.811 The conversion of acetyl CoA to malonyl CoA in fatty acid synthesis requires biotin2
Another biotin-requiring carboxylase is one that converts pyruvate to oxaloacetate in gluconeogenesis1. In addition to these two functions, biotin is also important for the breakdown of the amino acids isoleucine, leucine, methionine, and threonine1.
Biotin is an effective treatment for brittle nail syndrome, but it has not been shown to improve healthy nails3. There is little evidence to suggest that biotin improves healthy hair as well4.
References & Links
Biotin Deficiency & Toxicity
Biotin deficiency is very rare. Symptoms of biotin deficiency include1:
There are a couple of ways that a person could develop a deficiency in biotin. First, a very small number of people are born with a mutation in biotinidase that results in them not being able to process biocytin for absorption1. Another way is through the consumption of raw eggs. Drinking raw eggs is not something that most people do. However, some people do it to imitate Sylvester Stallone's movie character Rocky, who consumed them as part of his boxing training regimen. If you are not familiar with this movie the link below shows you how Rocky consumed his raw eggs.
Required Web Link
The potential problem with consuming raw eggs routinely is that raw egg whites contain a protein called avidin which binds biotin and prevents it from being absorbed. However, it would take more than two dozen egg whites consumed daily over many months to cause a
deficiency, making this an unlikely occurrence2. Cooking denatures avidin and prevents it from binding biotin, meaning that cooked eggs are not a concern.
No toxicity of biotin has been reported.
References & Links
Videos
Rocky Raw Eggs - http://www.youtube.com/watch?v=NhkdLHSKo9s
Chapter 11: 1-Carbon Metabolism Micronutrients
Three B vitamins are involved in what is known as 1-carbon metabolism. This is the movement of a 1-carbon unit, usually a methyl group (CH3) from one compound to another. It is similar to the movement of the amino group that occurs in transamination. As shown in the figure below, folate, vitamin B12, and vitamin B6 are the B vitamins involved in 1-carbon metabolism.
Figure 11.1 1-carbon metabolism depiction. 5-methyl tetrahydrofolate (THF) donates a methyl group to cobalamin forming methylcobalamin. Methylcobalamin donates a methyl group to homocysteine, forming methionine (amino acid). Alternatively, vitamin B6 can be utilized to convert homocysteine into cysteine.
Vitamin B6 has been covered already in the previous chapter, so this chapter is going to focus on folate and vitamin B12. We will examine this figure in pieces, so that hopefully by the time this chapter is completed, you will understand the role of all these vitamins in 1-carbon metabolism.
Sections:
Folate & Folic Acid
Folate is a B vitamin that exists in either its reduced form (folate) or oxidized form (folic acid). When folate is used in this section, we are referring to the reduced form, not the vitamin itself. Another key distinction between the 2 terms is that folic acid refers to the synthetic form, while folate refers to the natural form. Folic acid is only found in certain foods because they have been fortified with it, not because they produce it. The structure of folic acid is shown below.
Figure 11.11 Structure of Folic Acid1
Another key difference between folate and folic acid is the number of glutamates in their tails. Notice that glutamate is boxed in the structure of folic acid above. Folic acid always exists as a monoglutamate, meaning it only contains one glutamate. On the other hand, about 90% of the folate found in foods are polyglutamates, meaning there is more than one glutamate in their tail. Folic acid is more stable than folate, which can be destroyed by heat, oxidation, and light2. Table 11.11 summarizes the key differences between folate and folic acid.
Table 11.11 Comparison of folate to folic acid
Folate | Folic Acid |
Reduced Form | Oxidized Form |
Natural | Synthetic |
Polyglutamate | Monoglutamate |
More Stable |
The bioavailability of folate was believed to be much lower than folic acid.3 To account for these differences, the DRI committee created dietary folate equivalents (DFEs) to set the RDAs4. DFEs are defined as follows:
1 DFE = 1 ug food folate = 0.6 ug food folic acid = 0.5 ug folic acid on an empty stomach OR
1 DFE = ug food folate + (ug folic acid X 1.7)
The 1.7 comes from research suggesting that folic acid from food was 85% bioavailable, compared to 50% for folate (85%/50% = 1.7)4.
Before folate (polyglutamates) can be taken up into the enterocyte, the extra glutamates must be cleaved prior to uptake into the enterocyte by the reduced folate transporter (RFT, aka reduced folate carrier)5-7. Folic acid, because it is a monoglutamate, requires no cleavage for uptake before it is taken up through the RFT. Once inside the enterocyte, the monoglutamate form is methylated (notice the addition of CH3 to the lower monoglutamate) and transported into circulation through a yet unknown carrier5. This series of events is depicted in the figure below.
Figure 11.12 The uptake and absorption of folate and folic acid (orange boxes represent glutamate)
Thus, the methylated monoglutamate form is the circulating form. This is transported to the liver where it is converted back to the polyglutamate form for storage. Folate is excreted in both the urine and feces5.
For more information on folate, see the Required Web Link below.
Required Web Link
Subsections:
References & Links
Links
Folate Fact Sheet - https://ods.od.nih.gov/factsheets/Folate-HealthProfessional/
Folate Functions
The major function of folate is that it participates in 1-carbon metabolism. As described earlier, this is the transfer of 1-carbon units from one compound to another. The cofactor form of folate is tetrahydrofolate (THF). As is shown in Figure 11.111, in order for THF to be formed, a methyl group is transferred to cobalamin (vitamin B12) forming methyl-cobalamin. You can see this on the left side of the figure below.
Figure 11.111 1-carbon metabolism
There are 2 major functions of THF1:
References & Links
1. Gropper SS, Smith JL, Groff JL. (2008) Advanced Nutrition and Human Metabolism. Belmont, CA: Wadsworth Publishing.
Folate Deficiency & Toxicity
Folate deficiency is a vitamin deficiency that affects some Americans. The hallmark symptom of folate deficiency is megaloblastic (a.k.a. macrocytic) anemia. Megaloblastic anemia, as the name suggests, is characterized by large, nucleated, immature red blood cells. This occurs because folate is needed for DNA synthesis. Without it, red blood cells are not able to divide properly1. As a result, fewer and poorer functioning red blood cells are produced that cannot carry oxygen as efficiently as normal red blood cells2.
A maternal folate deficiency can lead to neural tube defects in infants. The neural tube is the embryonic structure that gives rise to the brain and spinal cord. The exact cause of neural tube defects is unknown, but folate supplementation has been shown to decrease the incidence of neural tube defects3. The most common of these neural tube defects is spina bifida (1 out of 2500 babies born in the United States), which is a failure of the neural tube to close and the spinal cord and its fluid protrude out the infant's back, as shown in Figure 11.1214,5.
Figure 11.121 Spina bifida6
The neural tube closes 21-28 days after conception1, and with 50% of pregnancies estimated to be unplanned, many women aren't aware they are pregnant during this period1,2. Thus, it is recommended that women of childbearing age consume 400 ug of folic acid daily1. In addition, in 1998 the FDA mandated that all refined cereals and grains be fortified with 140 ug folic acid
/100 grams of product7. As you can see in Figure 11.122, spina bifida prevalence rates declined during the optional fortification years and declined further once fortification became mandatory in the United States.
Figure 11.122 Neural tube defect prevalence 1995-20118
However, more recent research has found that folic acid supplementation begun before conception reduced the occurrence and severity of neural tube defects9.
The following link is an interesting account of the history that led up to the folic acid fortification. It is debatable whether folic acid fortification was fully responsible for the decrease in spina bifida rates shown above, but the rates are lower than they were pre- fortification.
Web Link
Folic Acid Fortification: Fact and Folly
Folate/Folic acid is not toxic, but it can mask a vitamin B12 deficiency and prevent its diagnosis. This effect will be discussed further in the vitamin B12 deficiency section.
References & Links
Link
Folic Acid Fortification: Fact and Folly - http://www.fda.gov/AboutFDA/WhatWeDo/History/ProductRegulation/SelectionsFromFDLIUp dateseriesonFDAHistory/ucm091883.htm
Vitamin B12
Vitamin B12 is unique among vitamins in that it contains an element (cobalt) and is found almost exclusively in animal products. Vitamin B12's scientific name is cobalamin, which is a reference to that fact that it contains cobalt. Neither plants nor animals can synthesize vitamin B12.
Instead, vitamin B12 in animal products is produced by microorganisms within the animal itself. Animals consume the microorganisms in soil while eating and grazing. Additionally, bacteria in
the stomachs of ruminant animals, like cows and sheep, can produce vitamin B 1. Some plant
12
products, such as fermented soy products (tempeh, miso) and the sea algae supplement, spirulina, are advertised as being good sources of B12. However, fermented soy products are not a reliable vitamin B12 source,2 and spirulina contains a pseudovitamin B12 compound that is not bioavailable3. For vegans, supplements, nutritional yeast, and fortified products like fortified soy milk can help them meet their vitamin B12 needs4.
The uptake, absorption, and transport of vitamin B12 is a complex process. The following descriptions explain, and figures illustrate, this process.
Vitamin B12 is normally bound to protein in food. Salivary glands in the mouth produce haptocorrin (formerly known as R protein), which travels with the food into the stomach. In the stomach, acid converts pepsinogen into pepsin, which breaks the B12 free from its protein. In addition, vitamin B12 intrinsic factor is released from the parietal cells1,7. Vitamin B12 intrinsic factor (sometimes referred to simply as intrinsic factor) is a protein-like compound that will aid in B12 absorption as will see in a moment.
Figure 11.22 Vitamin B12 in the stomach part 17,8
As pepsin frees B12 from protein, haptocorrin binds to the newly freed vitamin B12 (haptocorrin
+ B12). Intrinsic factor escapes digestion and, along with haptocorrin + B12, exits the stomach and enters the duodenum1,7.
Figure 11.23 Vitamin B12 in the stomach part 27,8
In the duodenum, pancreatic proteases break down haptocorrin, and again vitamin B12 is freed. Intrinsic factor then binds vitamin B12 (intrinsic factor + B12); intrinsic factor + B12 continues into the ileum to prepare for absorption1,7.
Figure 11.24 Vitamin B12 in the duodenum7,8
In the ileum, intrinsic factor + B12 is believed to be endocytosed into the enterocyte. Intrinsic factor is broken down in the enterocyte, freeing vitamin B12. The free vitamin B12 is then bound to transcobalamin II (TC II + B12); TC II + B12 moves into circulation7.
Figure 11.25 Vitamin B12 absorption8,9
The liver is the primary storage site for vitamin B12. Unlike most other water-soluble vitamins, the liver is able to maintain significant stores of vitamin B12. Uptake into the liver occurs through the binding of TC II + B12 to the TC II Receptor and the endocytosis of both the compound and the receptor8. Vitamin B12 is once again freed after degradation of TC II. Vitamin B12 is primarily stored in the liver as adenosylcobalamin5,7.
12
Figure 11.26 Hepatic uptake and storage of vitamin B 8
The overall bioavailability of vitamin B12 is believed to be approximately 50%3. Sublingual supplements of vitamin B12 have been found to be equally efficacious as oral supplements6. Excretion occurs mostly through bile, with little loss in urine5.
The Required Web Link below provides more information on vitamin B12.
Required Web Link
Subsections:
References & Links
Links
Vitamin B12 Fact Sheet - https://ods.od.nih.gov/factsheets/VitaminB12-HealthProfessional/
Vitamin B12 Functions
Vitamin B12 is a cofactor for 2 enzymes:
Methionine Synthase
Methionine synthase is an important enzyme in 1-carbon metabolism that uses methyl- cobalamin as its cofactor and converts homocysteine to methionine by adding a methyl group. Methionine then is converted to other compounds that serve as methyl donors, as shown below1.
Figure 11.211 1-carbon metabolism
Methymalonyl Mutase
Methymalonyl mutase is important in the breakdown of odd chain fatty acids (one containing 5, 7, 9 carbons, etc.). Odd chain fatty acids are less common than even chain fatty acids, but this enzyme is required to properly handle these less common fatty acids1.
Demyelination
In addition to its role as a cofactor for enzymes, vitamin B12 is also important for preventing degradation of the myelin sheath that surrounds neurons, as shown below.
Figure 11.212 Vitamin B12 is needed to maintain the myelin sheath that surrounds neurons2 The mechanism through which vitamin B12 prevents demyelination is not known3.
References & Links
Vitamin B12 Deficiency & Toxicity
There are 2 primary symptoms of vitamin B12 deficiency:
Megaloblastic (Macrocytic) Anemia
This is the same type of anemia that occurs in folate deficiency, and is also characterized by fewer, enlarged, immature red blood cells. In vitamin B12 deficiency, this occurs because there is not enough cobalamin to generate THF (illustrated in Figure 11.211). Thus, THF is not available for normal DNA synthesis and the red blood cells do not divide correctly.
Neurological Abnormalities
Vitamin B12 deficiency also results in nerve degeneration and abnormalities that can often precede the development of anemia. These include a decline in mental function, and burning, tingling, and numbness of legs. These symptoms can continue to worsen and deficiency can be fatal1.
The most common cause of vitamin B12 deficiency is pernicious anemia, a condition of inadequate intrinsic factor production that causes poor vitamin B12 absorption. This condition is common in people over the age of 50 because they have the condition atrophic gastritis2.
Atrophic gastritis is a chronic inflammatory condition that leads to the loss of gastric glands in the stomach, as shown in the figure in the following Required Web Link.
Required Web Link
The loss of gastric glands leads to decreased intrinsic factor production. It is estimated that ~6% of individuals age 60 and over are vitamin B12 deficient, with 20% having marginal status3. In addition to the elderly, vegans are also at risk for vitamin B12 deficiency because they do not consume animal products. However, the deficiency may take years to develop in adults because of stores and recycling of vitamin B 2. Deficiency has the potential to occur much quicker in infants or young children on vegan diets because they do not have adequate B12 stores like adults4.
12
Folate/Folic Acid masking vitamin B12 deficiency
As mentioned above, folate and vitamin B12 lead to the same megaloblastic (macrocytic) anemia. If high levels of folate or folic acid (most of the concern is with folic acid since it is fortified in foods and commonly taken in supplements) is given during vitamin B12 deficiency, it can correct this anemia. This is referred to as masking because it does not rectify the deficiency, but it "cures" this symptom. This is problematic because it does not correct the more serious neurological problems that can result from vitamin B12 deficiency. There are some people who are concerned about the fortification of cereals and grains with folic acid because people who are B12 deficient might not develop megaloblastic anemia, which makes a vitamin B12 deficiency harder to diagnose2.
No toxicity of vitamin B12 has been reported.
References & Links
Links
Atrophic Gastritis - http://catalog.nucleusinc.com/enlargeexhibit.php?ID=3754
11.3 B Vitamins, Homocysteine & Cardiovascular Disease
Homocysteine is a sulfur containing, non-proteinogenic (not used for making proteins) amino acid.
Elevated circulating homocysteine levels have been found in people with cardiovascular disease. Folate, vitamin B6, and vitamin B12 contribute to the conversion of homocysteine to methionine by providing methyl groups, thereby decreasing homocysteine levels, as illustrated in the figure below. Thus, based on these facts, it was hypothesized that intake of these B vitamins may decrease the risk of cardiovascular disease.
Figure 11.31 1-carbon metabolism
Research has found that intake of these B vitamins does decrease circulating homocysteine levels. However, most studies have NOT found that it results in improved cardiovascular disease outcomes1-3. It is debated why B vitamin intake has not resulted in improved outcomes. Some think it is because the studies have not focused on individuals with elevated homocysteine levels1, while others believe that homocysteine is simply a biomarker or indicator of cardiovascular disease, not a causative or contributing factor to cardiovascular disease development2. More research needs to be done.
References & Links
Chapter 12: Blood, Bones & Teeth Micronutrients
This chapter is a collection of vitamins and minerals that are involved in the structure or function of blood, bones and teeth. The individual sections are:
Vitamin D
Vitamin D is unique among the vitamins in that it is part vitamin, part hormone. It is considered part hormone for two reasons: (1) we have the ability to synthesize it, and (2) it has hormone- like functions. The amount synthesized, however, is often not enough to meet our needs. Thus, we need to consume this vitamin under certain circumstances, meaning that vitamin D is a conditionally essential micronutrient.
There are two major dietary forms of vitamin D: the form produced by plants and yeast is vitamin D2 (ergocalciferol), and the form made by animals is vitamin D3 (cholecalciferol). The structures of these two forms are shown below. Notice that the only difference is the presence of a double bond in D2 that is not in D3.
Figure 12.11 Structure of vitamin D2 (ergocalciferol) and vitamin D3 (cholecalciferol)1,2
We synthesize vitamin D3 from cholesterol, as shown below. In the skin, cholesterol is converted to 7-dehydrocholesterol. In the presence of UV-B light, 7-dehydrocholesterol is converted to vitamin D3. Synthesized vitamin D will combine with vitamin D-binding protein (DBP) to be transported to the liver. Dietary vitamin D2 and D3 is transported to the liver via chylomicrons. Once in the liver, vitamin D3 is converted into calcitriol (shown by its chemical abbreviation, 1,25(OH)2D, in Figure 12.12), which is the circulating form of vitamin D. The synthesis and activation of vitamin D is shown in the figures below.
Figure 12.12 Vitamin D synthesis and activation3
For more information on vitamin D, see the Required Web Link below.
Required Web Link
Vitamin D Fact Sheet for Health Professionals
Subsections:
References & Links
Links
Vitamin D Fact Sheet for Health Professionals - https://ods.od.nih.gov/factsheets/VitaminD- HealthProfessional/
Environmental Factors That Impact Vitamin D3 Synthesis
There are a number of environmental factors that affect vitamin D3 synthesis: Latitude, Season, Time of Day, Skin Color, Age, and Clothing.
Latitude
The latitude a person is at affects that person's ability to synthesize vitamin D3. There is an inverse relationship between distance from the equator and UV light exposure. Thus, with increased distance from the equator (increased latitude), there is decreased UV light exposure and vitamin D3 synthesis. The link below shows the latitude and longitude lines of the United States.
Required Web Link
United States Latitude and Longitude Lines
Seasons
Seasons also make a difference in vitamin D3 synthesis. In Boston (42० N), vitamin D synthesis only occurs from March-October, because during late fall and winter not enough UV-B reaches the earth's surface to synthesize vitamin D3. However, in Los Angeles (34० N), vitamin D3
synthesis occurs year round2. The difference is the angle of the sun relative to latitude and how many UV-B photons are absorbed before they reach the earth's surface1.
Time
Time of day is also an important factor in affecting vitamin D3 synthesis. Vitamin D3 synthesis increases in the morning before peaking at noon, then declines the rest of the day1.
Skin pigmentation
Another factor that plays an important role in vitamin D3 synthesis is skin pigmentation. Skin pigmentation tends to be darker around the equator to help protect inhabitants from the harmful effects of sun exposure. Skin color is the result of increased production of the pigment melanin, which is the pigment responsible for all skin colors.
Very dark skin color can provide a sun protection factor (SPF) 8-30 for those individuals who never burn2. These individuals will require approximately 5- to 10-times greater sunlight exposure than a light-skinned, white person to synthesize the same amount of vitamin D32,3.
Age
Age also plays a factor in vitamin D3 synthesis. Aging results in decreased 7-dehydrocholesterol concentrations in the skin, resulting in an approximately 75% reduction in the vitamin D3 synthesis capability by age 703.
Clothing
Clothing is another factor that influences vitamin D3 synthesis. More clothing means that less sun reaches your skin, and thus less vitamin D3 synthesis.
References & Links
Links
US Latitude and Longitude Lines - http://modernsurvivalblog.com/survival-skills/basic-map- reading-latitude-longitude/
Dietary Sources of Vitamin D
Because of the possible double-edged sword of sun exposure for synthesizing vitamin D3, consuming vitamin D from the diet or supplements is the alternative.
However, there are a limited number of food naturally rich in vitamin D. Good sources of vitamin D are fatty fish (salmon, tuna, etc.) and their oils (such as cod liver oil). The amount in fatty fish varies greatly with wild-caught salmon being the highest. One study showed that farmed salmon contained almost 75% less vitamin D than wild-caught salmon1. It is not known whether this disparity exists between other types of farmed and wild-caught fish varieties.
Table 12.121 Vitamin D content of fish1
Fish | Vitamin D (IU/oz) |
Blue Fish | 280 ± 68 |
Cod | 104 ± 24 |
Grey Sole | 56 ± 36 |
Farmed Salmon | 240 ± 108 |
Wild Salmon | 988 ± 524 |
Farmed Trout | 388 ± 212 |
Tuna | 404 ± 440 |
Thus, since not many foods contain vitamin D, many brands of milk have been fortified with vitamin D2 or D3 (100 IU/8 oz) since the 1930s2. However, the actual measured amount of vitamin D in many brands of milk is far less than stated on their labels3,4. Part of this problem stems from a lack of a standardized method for measuring vitamin D in the past. Without standardized analysis, there inevitably was a wide range of variation from lab to lab in the reported amount of vitamin D.
References & Links
Vitamin D Deficiency, Toxicity & Insufficiency
Rickets is a vitamin D deficiency in infants and children. A lack of vitamin D leads to decreased bone mineralization, causing the bones to become weak. The bones then bow under pressure, leading to the characteristic bowed legs, as seen in Figure 12.131.
Figure 12.131 Children suffering from rickets1
Osteomalacia is a vitamin D deficiency in adults and results in poor bone mineralization. The bone becomes soft, resulting in bone pain and an increased risk of fractures2. While rickets and osteomalacia are fairly rare in the United States, it is believed that vitamin D insufficiency might be much more widespread. Insufficiency means that the level of intake, or body status, is suboptimal (neither deficient nor optimal). Suboptimal/insufficient means intake, or status, is higher than deficient, but lower than optimal. Thus, higher intake levels will provide additional benefits. The functions of vitamin D are growing by the day due to increased research discoveries. These functions now include benefits beyond bone health, further supporting the importance of vitamin D. In late 2010, an RDA for vitamin D was established (was an Adequate Intake before). This made it, along with calcium, the first micronutrients to have their DRIs revised3. The RDA for vitamin D is 3-times higher than the previous AI. Many believe these are more reasonable levels, while others think that the new RDA is still not high enough. This belief, that many people’s vitamin D intake/status is suboptimal, is challenged by a recent review described in the link below that found that vitamin D did not reduce osteoporosis risk. In addition, a recent meta-analysis (second link) concluded, “there is probably no benefit to
expect from vitamin D supplementation in normally healthy people.”
Required Web Links
Vitamin D Ineffective for Preventing Osteoporosis Limits of Vitamin D Supplements
Vitamin D from supplements can become toxic. You cannot develop vitamin D toxicity from sun exposure, because the sunlight degrades a precursor of vitamin D3 in the skin4. Vitamin D toxicity results in hypercalcemia or high blood calcium levels. These become problematic because it can lead to the calcification of soft tissues.
References & Links
Links
Vitamin D Ineffective for Preventing Osteoporosis - http://well.blogs.nytimes.com/2013/10/17/vitamin-d-ineffective-for-preventing-osteoporosis/? Limits of Vitamin D Supplements - http://well.blogs.nytimes.com/2013/12/11/limits-of-vitamin- d-supplements/?
Calcium
Calcium is a macromineral and the most abundant mineral in the body. The reason for calcium’s
abundance is its distribution in the skeleton, which contains 99% of the calcium in the body. For more information on calcium, see the Required Web Link below.
Required Web Link
Calcium Fact Sheet for Health Professionals
Links
Calcium Fact Sheet for Health Professionals - https://ods.od.nih.gov/factsheets/Calcium- HealthProfessional/
Subsections:
Calcium Absorption
Calcium is taken up into the enterocyte through Transient Receptor Potential V6 (TRPV6), a calcium channel found on the brush border. Calbindin is the calcium binding protein that facilitates uptake through TRPV6 and transport across the enterocyte. Ca2+-Mg2+ ATPase functions to pump calcium out of the enterocyte and into circulation and to pump magnesium into the enterocyte, as shown below1.
Figure 12.211 Calcium uptake and absorption
As we have previously discussed, increased calcitriol synthesis in the kidney causes increased binding to the vitamin D receptor, which increases calbindin synthesis. Increased calbindin ultimately increases calcium uptake and absorption.
Figure 12.212 Increased calbindin increases calcium absorption
There are a couple of calcium-binding compounds that inhibit its absorption. Therefore, even though some foods are good sources of calcium, the calcium is not very bioavailable. Oxalate, found in high levels in spinach, rhubarb, sweet potatoes, and dried beans, is the most potent inhibitor of calcium absorption2. Recall that calcium oxalate is one of the compounds that makes up kidney stones. Based on this understanding, it should not be a surprise that formation of this compound inhibits calcium absorption. Another inhibitor of calcium absorption is
phytate. Phytate is found in whole grains and legumes2. So, ironically, the whole grains in your breakfast cereal can actually reduce slightly the amount of calcium you absorb from the milk you put on that same cereal.
References & Links
Calcium Bioavailability
Calcium bioavailability varies greatly from food to food, as shown in the table below. This table gives the serving size, calcium content of that food, and percent absorbed. The calcium content is multiplied by the absorption percentage to calculate the estimated calcium absorbed. Finally, it shows the servings of each food needed to equal the estimated calcium absorbed from 1 serving of milk.
Table 12.221 Bioavailability of calcium from different foods sources1-3
Food | Serving Size (g) | Calcium content (mg) | Absorption (%) | Estimated Calcium Absorbed | Servings needed to equal 240 mL milk |
Cow’s Milk | 240 | 300 | 32.1 | 96.3 | 1.0 |
Almonds, dry roasted | 28 | 80 | 21.2 | 17.0 | 5.7 |
Beans, Pinto | 86 | 44.7 | 26.7 | 11.9 | 8.1 |
Beans, Red | 172 | 40.5 | 24.4 | 9.9 | 9.7 |
Beans, White | 110 | 113 | 21.8 | 24.7 | 3.9 |
Bok Choy | 85 | 79 | 53.8 | 42.5 | 2.3 |
Broccoli | 71 | 35 | 61.3 | 21.5 | 4.5 |
Brussel Sprouts | 78 | 19 | 63.8 | 12.1 | 8.0 |
Cabbage, Chinese | 85 | 79 | 53.8 | 42.5 | 2.3 |
Cabbage, Green | 75 | 25 | 64.9 | 16.2 | 5.9 |
Cauliflower | 62 | 17 | 68.6 | 11.7 | 8.2 |
Cheddar Cheese | 42 | 303 | 32.1 | 97.2 | 1.0 |
Chinese mustard greens | 85 | 212 | 40.2 | 85.3 | 1.1 |
Chinese spinach | 85 | 347 | 8.36 | 29 | 3.3 |
Fruit Punch (CCM) | 240 | 300 | 52 | 156 | 0.6 |
Kale | 85 | 61 | 49.3 | 30.1 | 3.2 |
Kohlrabi | 82 | 20 | 67.0 | 13.4 | 7.2 |
Mustard Greens | 72 | 64 | 57.8 | 37.0 | 2.6 |
Orange juice (CCM) | 240 | 300 | 36.3 | 109 | 0.8 |
Radish | 50 | 14 | 74.4 | 10.4 | 9.2 |
Rhubarb | 120 | 174 | 8.54 | 10.1 | 9.5 |
Rutabaga | 85 | 36 | 61.4 | 22.1 | 4.4 |
Sesame seeds, no hulls | 28 | 37 | 20.8 | 7.7 | 12.2 |
Soy milk (tricalcium phosphate) | 240 | 300 | 24.0 | 72.0 | 1.3 |
Soy milk (calcium carbonate) | 240 | 300 | 21.1 | 66.3 | 1.0 |
Spinach | 85 | 115 | 5.1 | 5.9 | 16.3 |
Sweet Potatoes | 164 | 44 | 22.2 | 9.8 | 9.8 |
Tofu with Ca | 126 | 258 | 31.0 | 80.0 | 1.2 |
Turnip Greens | 72 | 99 | 51.6 | 51.1 | 1.9 |
Watercress | 17 | 20 | 67.0 | 13.4 | 7.2 |
Yogurt | 240 | 300 | 32.1 | 96.3 | 1.0 |
Notice that the foods high in oxalate like spinach, rhubarb, sweet potatoes, and dried beans are poorly absorbed. But there are still a number of calcium sources outside of milk.
The 2 most common forms of calcium found in supplements are calcium carbonate and calcium citrate. As you can see in the figure below, they differ in the amount of elemental calcium they contain. This shows how much of the molecular weight of the compound is calcium.
Figure 12.221 Percent of calcium supplements that is elemental calcium4
The higher the percent elemental calcium, the greater the amount of calcium you will receive per given weight of that compound, versus a compound that has a lower elemental calcium percentage. Both carbonate and citrate forms are well absorbed, but individuals with low stomach acid absorb citrate better. Also, carbonate is best absorbed when taken with food, while for citrate it is equally well absorbed when taken alone4.
Older research suggested that calcium citrate malate was more bioavailable than other calcium sources. However, a more recent clinical study found no difference in the bioavailability of calcium from calcium citrate malate in orange juice, skim milk, or calcium carbonate supplements5. There is some evidence that suggests that even though bioavailability is the same among these different forms, they might not be equally effective in improving bone measures6.
References & Links
109(5): 812-813.
Calcium Functions
In terms of bone and teeth, calcium is found in bone and referred to as hydroxyapatite (a mineralized form of calcium). There are also a number of non-bone functions of calcium. Calcium is an intracellular signaling molecule. Because of this, intracellular calcium is tightly controlled, primarily stored within organelles.
Non-bone functions include1:
Neurotransmitter release - Neurotransmitter release is stimulated by the opening of voltage- gated Ca2+ channels. This stimulates the synaptic vesicle to fuse with the axon membrane and release the neurotransmitter into the synapse.
Muscle contraction - Calcium is released in muscle cells, where it binds to the protein troponin, changes its shape, and removes the tropomyosin blockade of actin active sites so that contraction can occur2. This can be seen in the following animation and figure (same link).
Required Web Link
Hormone release - Calcium acts as an intracellular messenger for the release of hormones, such as insulin. The link below shows how in the beta cells of the pancreas, the opening of voltage- gated calcium channels stimulates the insulin granules to fuse with the beta cell membrane to release insulin.
Required Web Link
Blood Clotting - As will be discussed more in the vitamin K section, calcium binding to activated Gla proteins is important in the blood clotting cascade.
Enzyme regulation - The binding of calcium to calcium-binding proteins also regulates the action of a number of enzymes3.
References & Links
1. Byrd-Bredbenner C, Moe G, Beshgetoor D, Berning J. (2009) Wardlaw's perspectives in nutrition. New York, NY: McGraw-Hill. 2.http://legacy.owensboro.kctcs.edu/GCaplan/anat/Notes/API%20Notes%20J%20%20Muscle% 20Contraction.htm
3. Gropper SS, Smith JL, Groff JL. (2008) Advanced nutrition and human metabolism. Belmont, CA: Wadsworth Publishing.
Links
Muscle contraction - http://legacy.owensboro.kctcs.edu/GCaplan/anat/Notes/API%20Notes%20J%20%20Muscle%2 0Contraction.htm
Insulin release - http://www.dolcera.com/wiki/images/Image11.jpeg
Calcium Deficiency & Toxicity
Because of the large amount of calcium in bones, deficiency is rare1. Hypocalcemia (low serum calcium levels in blood) can result in tetany (involuntary muscle contractions)2. In addition, calcium deficiency in children can lead to rickets, which is a vitamin D deficiency. While not a deficiency, low calcium intake can lead to decreased bone mineral density and the conditions osteopenia and osteoporosis. How these differ from osteomalacia and normal bone is illustrated and described below. There are two different bone components that we will consider to understand what is happening in the bone. Matrix is the scaffolding onto which mineral is deposited. Mineral is at it sounds, the mineral that is deposited on the matrix.
Osteomalacia - Bone mass is normal, but the matrix to mineral ratio is increased, meaning there is less mineral in bone.
Osteopenia - Bone mass is decreased, but the matrix to mineral ratio is not altered from normal bone. This condition is intermediate in between normal and osteoporosis.
Osteoporosis - Bone mass is further decreased from osteopenia, but the matrix to mineral ratio is not altered from normal bone3.
To prevent osteoporosis it is important to build peak bone mass, 90% of which is built in females by age 18 and age 20 in males, but can continue to increase until age 30. After that time, bone mass starts to decrease. For women after menopause, bone mass decreases dramatically because of the decrease in estrogen production, as shown in the link below4.
Required Web Link
Calcium toxicity is rare, occurring in those with hyperparathyroidism or high calcium supplementation levels. Like vitamin D, toxicity can lead to calcification of soft tissues5. In addition, a very high intake of calcium can lead to kidney stone formation.
References & Links
Link
Bone Mass - http://drugline.org/img/term/bone-mass-density-2046_2.gif Bone Mineral Density T-Scores - http://www.orthopaedicsurgeon.com.sg/wp- content/uploads/2011/11/t-scores-large.gif
Phosphorus
Animal products are rich sources of phosphate. Plant products contain phosphorus, but some is in the form of phytic acid (phytate). In grains, over 80% of the phosphorus is phytate. The bioavailability of phosphorus from phytate is poor (~50%) because we lack the enzyme phytase2. Nevertheless, ~50-70% of phosphorus is estimated to be absorbed from our diet1.
Another source of phosphorus is phosphoric acid that is used to acidify colas. Colas are caramel-colored, carbonated soft drinks that contain caffeine, such as Coca-Cola, Pepsi, etc.
Epidemiological studies have found that soft drink consumption is associated with decreased bone mineral densities, particularly in females3,4. It has been hypothesized that phosphoric acid
plays some role in this effect, but there is limited evidence to support this belief. Most phosphorus is excreted in the urine.
Phosphorus deficiency is rare, but can hinder bone and teeth development. Other symptoms include muscle weakness, rickets, and bone pain5. Toxicity is also rare, but it causes low blood calcium concentrations and tetany1.
http://lpi.oregonstate.edu/mic/minerals/phosphorus#reference10
Subsection:
References & Links
12.31 Phosphorus Functions
Phosphorus has a number of functions in the body1.Phosphate is a component of hydroxyapatite in bones and teeth, and can have non-bone function.
Non-bone functions include:
Phosphorylation - Phosphates are used to activate and deactivate a number of proteins. In addition, compounds are also frequently phosphorylated, like the monosaccharides shown below.
Figure 12.311 Uptake of monosaccharides into the hepatocyte Phospholipids - Phosphates are a component of phospholipids DNA/RNA - DNA/RNA have a phosphate backbone as shown below.
Figure 12.313 Structure of DNA2
ATP - The major energy currency, ATP, stores energy in its phosphate bonds.
Secondary Messengers - The intracellular secondary messengers cyclic AMP (cAMP) and inositol triphosphate (IP3) both contain phosphate. The action of these secondary messengers can be seen in the links below.
Required Web Links
References & Links
Links
cAMP - http://courses.washington.edu/conj/gprotein/cyclicamp.htm IP3 - http://courses.washington.edu/conj/gprotein/ip3.htm
Fluoride
Fluoride is a nonessential mineral that is not required by the body and it is not widely found in the food supply. The majority of what we consume comes from fluoridated water. Other good non-dietary sources are fluoridated toothpaste and dental rinses1. Absorption of fluoride is near 100% for both dietary and non-dietary forms and it is rapidly excreted in the urine2.
Since it is a nonessential mineral, there is no fluoride deficiency. However, fluoride can be quite toxic. Acute toxicity symptoms from large intakes of fluoride include1: Nausea, Vomiting, Diarrhea, and Convulsions. Chronic toxicity results in an irreversible condition known as fluorosis.
There is debate as to whether water should be fluoridated. The following links are examples of just how conflicted the U.S. is. The first is a New York Times article on this topic. There is also an article about Portland’s decision to begin fluoridating its water in 2014. The third article is about a bill introduced by a Kansas lawmaker concerned about the effects of water fluoridation.
Required Web Links
Portland Approves Fluoridation by ‘14
Dentists speak out as fluoride bill nears hearing
References & Links
Links
Fluoridation Debate, Redux - http://www.nytimes.com/2012/03/18/opinion/sunday/fluoridation-debate-redux.html? Portland Approves Fluoridation by ‘14 - http://www.nytimes.com/2012/09/13/us/portland- approves-adding-fluoride-to-water-by-14.html?
Dentists speak out as fluoride bill nears hearing - http://ksn.com/2014/02/10/dentists-speak- out-as-fluoride-bill-nears-hearing/
Vitamin K
There are 3 forms of vitamin K. Phylloquinone (K1), the plant form of vitamin K, is the primary dietary form of vitamin K and found in green leafy vegetables, broccoli, Brussels sprouts, and asparagus are foods that are good sources of phylloquinone1. Another form of vitamin K, menaquinone (K2), is synthesized by bacteria in the colon. Menaquinone comprises ~10% of absorbed vitamin K every day and can also be found in small amounts in animal products. Its structure is shown below2. The third form, a synthetic form of vitamin K, is menadione (K3).
Vitamin K is absorbed like other fat-soluble substances. Approximately 80% of phylloquinone and menaquinone are incorporated into chylomicrons and stored primarily in the liver1,3. Once metabolized, vitamin K is primarily excreted via bile in the feces, with a lesser amount excreted in urine3.
For more information on vitamin K, see the Required Web Link below.
Required Web Link
Vitamin K Fact Sheet for Health Professionals
Subsections:
References & Links
Vitamin K Functions
Vitamin K is a cofactor for carboxylation reactions that add a CO2 to the amino acid, glutamic acid (glutamate), in certain proteins. The enzyme, gamma-glutamyl carboxylase, uses a vitamin K cofactor to convert glutamic acid to gamma-carboxyglutamic acid (Gla). Gla proteins are those that contain glutamic acid(s) that have been converted to gamma-carboxyglutamic acid(s). The formation of Gla proteins allows the 2 positive charges of calcium to bind between the 2 negative charges on the carboxylic acid groups (COO-) in the Gla. The binding of calcium activates these proteins1-3.
Figure 12.512 Gamma-glutamyl carboxylase converts glutamic acid to gamma-carboxyglutamic acid (Gla).
Gla proteins are important in blood clotting. Blood clotting occurs through a cascade of events, as shown in the following 2 videos. The animation below gives an overview of blood clotting, the video is a fun depiction of the blood clotting cascade.
Web Links
Video: The Clotting Cascade (1:20)
If these proteins within the blood clotting cascade are not activated to Gla, the cascade does not proceed as normal, leading to impaired blood clotting. After being used as a cofactor by gamma-glutamyl carboxylase to produce a Gla protein, vitamin K becomes vitamin K epoxide. Vitamin K epoxide needs to be converted back to vitamin K to serve as a cofactor again.
Warfarin (Coumadin) and dicumarol are a couple of blood thinning drugs that inhibit this regeneration of vitamin K. This reduces the amount of Gla in the blood clotting proteins, thus reducing the clotting response. The structure of warfarin and dicumarol are shown in Figure 12.514.
Figure 12.514 Structure of warfarin5
Figure 12.515 Structure of dicumarol6
The following coumadin rap song video gives further information on warfarin.
Web Link
Video: Coumadin Rap Song (3:44)
Vitamin K may also be important for bone health. There are 3 Gla proteins found in bone: osteocalcin, matrix Gla protein (MGP), and protein S4. Osteocalcin is a major bone protein, constituting 15-20% of all non-collagen proteins in bone. However, overall, the function of these 3 proteins in bone is not known2,3. Some research suggests that higher vitamin K status or intake decreases bone loss, but it is still not clear whether vitamin K truly is important for bone health7.
References & Links
Videos
Hemostasis Animation- http://www.mhhe.com/biosci/esp/2002_general/Esp/folder_structure/tr/m1/s7/trm1s7_3.ht m
The Clotting Cascade - https://www.youtube.com/watch?v=NJm4DE-tVuY&feature=related Coumadin Rap Song - http://www.youtube.com/watch?v=Mfk05IFfW48&feature=watch_response
Vitamin K Deficiency & Toxicity
Vitamin K deficiency is rare, but can occur in newborn infants. They are at higher risk, because there is poor transfer of vitamin K across the placental barrier, their gastrointestinal tracts do not contain vitamin K producing bacteria, and breast milk is generally low in vitamin K1. As a result, it is recommended (and widely practiced) that all infants receive a vitamin K injection within 6 hours of birth2.
Prolonged antibiotic treatment (which kills bacteria in the gastrointestinal tract) and lipid absorption problems can also lead to vitamin K deficiency3. Vitamin K deficient individuals have an increased risk of bleeding or hemorrhage. Remember that high levels of vitamin E intake can also interfere with vitamin K's blood clotting function. It is believed that a vitamin E metabolite, with similar structure to the vitamin K quinones, antagonizes the action of vitamin K.
Phylloquinone and menaquinone have no reported toxicities. However, menadione can cause liver damage1.
References & Links
Vitamin A
There are 3 forms of vitamin A (retinol, retinal, and retinoic acid) that collectively are known as retinoids. Retinol is the alcohol (OH) form, retinal is the aldehyde (COH) form, and retinoic acid is the carboxylic acid (COOH) form, as shown in the figure below (areas of difference are indicated by red)
Figure 12.61 Structure of the retinoids1
For more information on vitamin K, see the Required Web Link below.
Required Web Link
Vitamin A Fact Sheet for Health Professionals
Subsections:
References & Links
Links
Vitamin A Fact Sheet for Health Professionals - https://ods.od.nih.gov/factsheets/VitaminA- HealthProfessional/
Carotenoids
Carotenoids are 40-carbon compounds that are found throughout nature. Animals do not produce carotenoids, thus any found in animals came from consumed plants or microorganisms. There are more than 600 natural carotenoids. However, the 6 main ones found in the diet and in the body are1: Beta-carotene, Alpha-carotene, Beta-cryptoxanthin, Lutein, Zeaxanthin, and Lycopene.
Many carotenoids are pigments, meaning they are colored. The table below gives the color of some of these carotenoids, as well as some food sources.
Table 12.611 Carotenoids’ color and food sources
Carotenoid | Color | Food Sources |
Beta-carotene | Orange | Carrots, Sweet Potatoes, Leafy Greens |
Lycopene | Red | Tomatoes, Watermelon, Pink Grapefruit |
Lutein/Zeaxanthin | Yellow | Kale, Corn, Egg Yolks, Spinach |
Carotenoids can be further classified as provitamin A or non-provitamin A. Provitamin A carotenoids are those that can be cleaved to form retinal, while the non-provitamin A carotenoids cannot. After provitamin A carotenoids are taken up into the enterocyte, some are cleaved to form retinal. In the case of symmetrical beta-carotene, it is cleaved in the center to form 2 retinal molecules.
References & Links
1. Lindshield BL, Erdman JW. (2006) Carotenoids. In: Bowman BA, Russell RM, editors. Present Knowledge in Nutrition. Washington, D.C.: International Life Sciences Institute. pp. 184-197.r
Vitamin A Uptake, Absorption, Transport & Storage
The uptake, absorption, transport, and storage of vitamin A and carotenoids are summarized in the Figure 12.621.
Esters are removed by esterases so that free retinol can be taken up into the enterocyte. Preformed vitamin A is highly bioavailable (70-90%) if consumed with some fat2. Carotenoids
have a much lower bioavailability, which varies based on the carotenoid and matrix it is in when consumed. Once provitamin A carotenoids are taken up into the enterocytes, they are: (1) cleaved to retinal and then converted to retinol or (2) absorbed intact and incorporated into chylomicrons.
Figure 12.621 Vitamin A uptake, absorption, transport, and storage. Adapted from reference 1
Retinol in the enterocyte is esterified, forming retinyl esters. The retinyl esters are packaged into chylomicrons (CM) and enter the lymph system. Once the chylomicrons reach circulation, triglycerides are cleaved off to form chylomicron remnants (CM Rem). These are taken up by hepatocytes, where the retinyl esters are de-esterified to form retinol.
The liver is the major storage site of vitamin A. For storage, the retinol will be transported from the hepatocytes to the stellate cells and converted back to retinyl esters, the storage form of vitamin A. If vitamin A is needed to be released into circulation, retinol will combine with retinol binding protein (RBP). Retinol + RBP are then bound to a large transport protein, transthyretin (TTR). It is believed that retinol + RBP would be filtered out by the kidney and excreted in urine if it was not bound to TTR1.
After it is further metabolized, 60% of vitamin A is excreted in the urine, 40% in feces2.
References & Links
Vitamin A Functions
Vitamin A has a number of important functions in the body.
Vision
The retina is the inner back lining of the eye that takes visual images and turns them into nerve signals that are sent to the brain to form the images that we "see", as shown in the following link1.
Web Link
Cell Differentiation
Vitamin A, in particular retinoic acid, is important for cell differentiation, or the ability of stem cells to develop into specialized cells.
References & Links
1. Byrd-Bredbenner C, Moe G, Beshgetoor D, Berning J. (2009) Wardlaw's perspectives in nutrition. New York, NY: McGraw-Hill.
Links
Retina - http://webvision.umh.es/webvision/imageswv/Sagschem.jpeg
Vitamin A Deficiency & Toxicity
Vitamin A deficiency is rare in North America, but is a huge problem in developing countries. In many developing countries, they do not have a stable dietary source of retinoids or provitamin.
Often the earliest symptom of vitamin A deficiency is night blindness, due to the insufficient production of rhodopsin. The reason that this is the earliest symptom, is that circulating vitamin A levels are homeostatically-controlled, meaning that they do not change until after vitamin A
stores are exhausted. This means that blood, serum, plasma measurements are going to appear normal until all stores are exhausted. As a result, sensitively assessing someone as vitamin A deficient can be challenging. There are further changes to the eye that occur during vitamin A deficiency, collectively referred to as xerophthalmia, which are shown in the Required Web Link on the next page.
Required Web Link
The eye signs of vitamin A deficiency
Ultimately the person can become blind. Vitamin A deficiency is the leading cause of blindness in some parts of the world1.
Another symptom of vitamin A deficiency is hyperkeratosis. In this condition, cells overproduce the protein keratin, causing the skin to become rough and irritated, as shown in the link below1.
Required Web Link
Hyperkeratosis
One way to counter vitamin A deficiency in developing countries is for staple crops, like rice and corn, to contain beta-carotene. In the case of rice, Golden Rice was genetically modified to produce beta-carotene. A second generation of golden rice, known as Golden Rice 2, has now been developed. However, politics and regulations have prevented it from being used. This is described in the first link. The second link shows some of the opposition to Golden Rice. The third is a nice figure that details the progress towards Golden Rice being used.
Required Web Links
The Golden Rice - An exercise in how not to do science Golden Rice Project
Vitamin A can be very toxic and can cause serious symptoms, such as blurred vision, liver abnormalities, skin disorders, and joint pain1,2. In addition, research has suggested that people who consume high levels of vitamin A are more prone to bone fractures2. Toxic levels of vitamin A are also teratogenic, which means they could cause birth defects.
References & Links
Links
The eye signs of vitamin A deficiency - http://www.cehjournal.org/article/the-eye-signs-of- vitamin-a-deficiency/
Hyperkeratosis - http://api.ning.com/files/pKcbIy8a8fSwvjlw-NqcoyW- h1U9xsjxM86*Pg7xe7WAS91frtrQFThTH2oDWcMvbUJ9Mlutd3B9tXk8hjbfmXkeZyJs- 7Mi/follicularhyperkeratosis1.jpg
Golden Rice - http://www.goldenrice.org/
The Golden Rice - An exercise in how not to do science - http://www.i-sis.org.uk/rice.php Golden Rice Project - http://www.irri.org/images/golden_rice/GoldenRiceProjectTimelineAugust2013.jpg
Iron
There are 2 major dietary forms of iron: heme iron and non-heme iron. Heme iron is only found in foods of animal origin, within hemoglobin and myoglobin. The structure of heme iron is shown below.
Figure 12.71 Structure of heme iron1
Approximately 40% of iron in meat, fish, and poultry is heme-iron, and the other 60% is non- heme iron2.
Non-heme iron is the mineral alone, in either its oxidized or reduced form. The 2 forms of iron are:
It is estimated that 25% of heme iron and 17% of non-heme iron are absorbed2. Approximately 85-90% of the iron we consume is non-heme iron2,3.
In addition to getting iron from food sources, if food is cooked in cast iron cookware, a small amount of iron can be transferred to the food. On the next page you will find a link to a story about the iron fish that is being used in Cambodia to increase iron intake in an area with prevalent iron deficiency. However, they found that the iron fish was not effective in reducing anemia4.
Web Link
Canadian’s lucky iron fish saves lives in Cambodia
Many breakfast cereals are fortified with reduced iron, which looks like iron filings, as the following video shows.
Web Link
Video: Iron for breakfast (1:02)
While the iron bioavailability of this reduced iron is low, some is absorbed5.
Supplements
Most iron supplements use ferrous (Fe2+) iron, because this form is better absorbed, as discussed in the next section. The figure below shows the percent of elemental iron in different supplements. This is the percentage of elemental iron that is in each compound.
Figure 12.72 Elemental iron in different iron supplements3
Vitamin C does not increase absorption of ferrous supplements because they are already in reduced form, as discussed in the following subsection2. Iron chelates are marketed as being better absorbed than other forms of iron supplements, but this has not been proven6. It is recommended that supplements are not taken with meals, because they are better absorbed when not consumed with food2.
For more information on vitamin K, see the Required Web Link below.
Required Web Link
Iron Dietary Supplement Fact Sheet
Subsections:
References & Links
Link
Canadian’s lucky iron fish saves lives in Cambodia - http://www.therecord.com/news/local/article/624229--canadian-s-lucky-iron-fish-saves-lives- in-cambodia
Iron Dietary Supplement Fact Sheet - https://ods.od.nih.gov/factsheets/Iron- HealthProfessional/
Video
Iron for breakfast - https://www.youtube.com/watch?v=pRK15XSqtAw
Iron Uptake & Absorption
There are 2 transporters for iron, one for heme iron and one for non-heme iron. The non-heme transporter is the divalent mineral transporter 1 (DMT1), which transports Fe2+ into the enterocyte. Heme iron is taken up through heme carrier protein 1 (HCP-1), and then metabolized to Fe2+. Fe2+ may be used by enzymes and other proteins or stored in the enterocyte bound to ferritin, the iron storage protein. To reach circulation, iron is transported through ferroportin1,2. This process is summarized in Figure 12.711.
Figure 12.711 Iron uptake into the enterocyte
Since only the reduced form of non-heme iron (Fe2+) is taken up, Fe3+ must be reduced. There is a reductase enzyme on the brush border, duodenal cytochrome b (Dcytb), that catalyzes the reduction of Fe3+ to Fe2+, as shown below. Vitamin C enhances non-heme iron absorption because it is required by Dcytb for this reaction. Thus, if dietary non-heme iron is consumed with vitamin C, more non-heme iron will be reduced to Fe2+ and taken up into the enterocyte through DMT1 as shown in Figure 12.712.
Figure 12.712 Reduction of non-heme iron by Dcytb
In addition to vitamin C, there is an unidentified factor in muscle that enhances non-heme iron absorption if consumed at the same meal3. This unidentified factor is referred to as meat protein factor (MPF).
Inhibitors of non-heme iron absorption typically chelate, or bind, the iron to prevent absorption. Phytates (phytic acid), which also inhibit calcium absorption, chelate non-heme iron decreasing its absorption.
Figure 12.713 Structure of phytic acid4
Other compounds that inhibit absorption are: Polyphenols (coffee, tea)1
Figure 12.714 Structure of gallic acid, a polyphenol5
Oxalate (spinach, rhubarb, sweet potatoes, and dried beans)2
Figure 12.715 Structure of calcium oxalate6 Calcium is also believed to inhibit iron uptake.
References & Links
Iron Transport & Storage
Transferrin is the major iron transport protein (transports iron through blood). Fe3+ is the form of iron that binds to transferrin, so the Fe2+ transported through ferroportin must be oxidized to Fe3+. There are 2 copper-containing proteins that catalyze this oxidation of Fe2+: hephaestin and ceruloplasmin. Hephaestin is found in the membrane of enterocytes, while ceruloplasmin is the major copper transport protein in blood. Hephaestin is the primary protein that performs this function in a coupled manner (need to occur together) with transport through ferroportin. This means that the Fe2+ needs to be oxidized to be transported through ferroportin. Evidence suggests that ceruloplasmin is involved in oxidizing Fe2+ when iron status is low1. Once oxidized, Fe3+ binds to transferrin and is transported to a tissue cell that contains a transferrin receptor.
Transferrin binds to the transferrin receptor and is endocytosed, as shown in Figure 12.7212.
Figure 12.721 Transport and uptake of iron
Once inside cells, the iron can be used for cellular purposes (cofactor for enzyme etc.) or it can be stored in the iron storage proteins ferritin or hemosiderin. Ferritin is the primary iron storage protein, but at higher concentrations, iron is also stored in hemosiderin2.
Figure 12.722 Fates of iron within cells
There are 3 major compartments of iron in the body3:
Functional iron consists of iron performing some function. There are 3 functional iron sub- compartments.
The functions of these sub-compartments are discussed in the next section. Iron Stores consist of:
The liver is the primary storage site in the body, with the spleen and bone marrow being the other major storage sites.
Circulating iron is found in transferrin3.
The majority of iron is in the functional iron compartment. The figure below further reinforces this point, showing that most iron is found in red blood cells (hemoglobin) and tissues (myoglobin).
Figure 12.723 Iron distribution in different compartments4
Also notice how small oral intake and excretion are compared to the amount found in the different compartments in the body. As a result, iron recycling is really important, because red blood cells only live for 120 days. Red blood cells are broken down in the liver, spleen, and bone marrow and the iron can be used for the same purposes as described earlier: cellular use, storage, or transported to another tissue on transferrin2. Most of this iron will be used for heme
and ultimately red blood cell synthesis. The figure below summarizes the potential uses of iron recycled from red blood cells.
Figure 12.724 Iron recycling from red blood cells
Iron is unique among minerals in that our body has limited excretion ability. Thus, absorption is controlled by the hormone hepcidin. The liver has an iron sensor so when iron levels get high, this sensor signals for the release of hepcidin. Hepcidin causes degradation of ferroportin. Thus, the iron is not able to be transported into circulation5.
Figure 12.725 Action of hepcidin4
The iron is now trapped in the enterocyte, which is eventually sloughed off and excreted in feces. Thus, iron absorption is decreased through the action of hepcidin.
Figure 12.726 Enterocytes are sloughed off the villus and unless digested and their components reabsorbed, they will be excreted in feces
References & Links
Iron Functions
As we talked about in the previous subsection, there are 3 primary functional iron subcompartments:
Hemoglobin contains heme that is responsible for red blood cells’ red color. Hemoglobin carries
oxygen to tissues. The function of hemoglobin can be seen in the Required Web Link below.
Required Web Link
Myoglobin is similar to hemoglobin in that it can bind oxygen. However, instead of being found in blood, it is found in muscle. The color of meat products is a result of the state that myoglobin is in, as shown in the Required Web Link on the next page.
Required Web Link
There are a number of enzymes that use iron as a cofactor. We've already talked about two in this class.
Iron is a cofactor for the antioxidant enzyme, catalase that converts hydrogen peroxide to water, as shown below.
Figure 12.731 Catalase uses iron as a cofactor
Iron is also a cofactor for proline and lysyl hydroxylases that are important in collagen cross- linking. This will be discussed further in the vitamin C section. The function of these enzymes is shown below.
Figure 12.732 Importance of ascorbic acid and iron to proline and lysyl hydroxylases.
Heme iron is also found in cytochromes, like cytochrome c in the electron transport chain as shown below1.
Figure 12.733 Cytochrome c in the electron transport chain contains iron2
References & Links
Links
Hemoglobin - http://www.nlm.nih.gov/medlineplus/ency/imagepages/19510.htm Myoglobin & Meat Color - http://meatisneat.files.wordpress.com/2009/09/slide11.jpg
Iron Deficiency & Toxicity
The levels of iron in the different compartments is illustrated by the figure below. The red above the table is meant to represent the amount of iron in the different compartments. In early negative iron balance stage, iron stores are slightly depleted. Once the stores are almost completely exhausted, this state is referred to as iron depletion. In iron deficiency, stores are completely exhausted and the circulating and functional iron levels are also depleted. In iron anemia, the circulating and functional iron levels are further depleted from iron-deficiency.
1 Great measure, but invasive
2 Small amount are released from liver, bone, and spleen – proportional to body stores
3 Also referred to as total iron-binding capacity
Figure 12.741 Measures of iron status1-3
The most common measures of iron status are hemoglobin concentrations and hematocrit (described below) levels. A decreased amount of either measure indicates iron deficiency, but these two measures are among the last to indicate that iron status is depressed. This is because, as you can see in the figure above, circulating iron (plasma iron) levels are not altered until you reach iron deficiency. Thus, other measures are likely better choices1.
The hematocrit, as illustrated in the figure below, is a measure of the proportion of red blood cells (erythrocytes) as compared to all other components of blood. The components are separated by a centrifuge. The red blood cells remain at the bottom of the tube. They can be quantified by measuring the packed cell volume (PCV) relative to the total whole blood volume.
w Figure 12.742 Hematocrit figures4,5
One of the best measures of iron status is bone marrow iron, but this is an invasive
measure, and is therefore not commonly used. Plasma ferritin, the iron storage protein, is also found in lower amounts in the blood (plasma) and is a good indicator of iron stores. Thus, it is a sensitive measure to determine if someone is in negative iron balance or iron depleted. It is not as useful of a measure beyond this stage because the iron stores have been exhausted for the most part. Transferrin iron binding capacity (aka total iron binding capacity), as it sounds, is a measure of how much iron transferrin can bind. An increase in transferrin iron binding capacity indicates deficiency (>400 indicates deficiency). But the best measure for deficiency or anemia is either percent serum transferrin saturation or plasma iron. A lower % saturation means that less of the transferrin are saturated or carrying the maximum amount of iron that they can handle. Plasma iron is easily understood as the amount of iron within the plasma1.
Iron deficiency is the most common deficiency worldwide, estimated to affect 1.6 billion people. In the US, it is less common, but an estimated 10% of toddlers and women of childbearing age are deficient. Iron deficiency often results in a microcytic (small cell), hypochromic (low color) anemia, that is a result of decreased hemoglobin production. With decreased hemoglobin, the red blood cells cannot carry as much oxygen. Decreased oxygen leads to slower metabolism. Thus, a person with this anemia feels fatigued, weak, apathetic, and can experience headaches6. Other side effects include decreased immune function and delayed cognitive development in children7.
Those who are particularly at risk are1,7:
To give you a better understanding of these risks, it is helpful to look at how much higher the RDAs are for women of reproductive age and pregnant women compared to men8.
Women of reproductive age 18 mg/day Pregnancy 27 mg/day
Men 8 mg/day
To put this in perspective, 3 oz of beef contains ~3 mg of iron. Thus, it can be a challenge for some women to meet the requirement. The RDA committee estimates the iron requirements to be 80% and 70% higher for vegans and endurance athletes, respectively. The increased requirement for endurance athletes is based on loss due to "foot strike hemolysis", or the
increased rupture of red blood cells due to the striking of the foot on hard surfaces3.
Iron toxicity is rare in adults, but can occur in children who consume too many supplements containing iron. Symptoms of this acute toxicity include nausea, vomiting, and diarrhea7.
50 out of 10,000 newborns in the United States are born with the genetic condition, hemochromatosis. In this condition, there is a mutation in a protein in the enterocyte that prevents the normal decrease of intestinal iron absorption. Without this protein these individuals cannot decrease iron absorption. Since the body cannot excrete iron, it accumulates in tissues, and ultimately can result in organ failure1.
References & Links
12.8 Zinc
Many animal products are good sources of zinc and are estimated to account for 70% of the zinc North Americans’ consume1. An estimated 15-40% of consumed zinc is absorbed2. Zinc is taken up into the enterocyte through the Zir-and Irt-like protein 4 (ZIP4). Once inside the enterocyte, zinc can:
These functions are represented in the figure below.
Figure 12.81 Fates of zinc once it is taken up into the enterocyte
The zinc attached to albumin is transported to the liver through the portal vein. There is not a major storage site of zinc, but there are pools of zinc in the liver, bone, pancreas, and kidney1. Zinc is primarily excreted in feces.
There are some similarities between zinc and iron absorption. Increased zinc consumption results in increased thionein synthesis in the enterocyte. As a result, more zinc is bound to thionein (forming metallothionein) and not used for functional uses or transported into circulation, as represented by the thick and thin arrows in the figure below.
Figure 12.82 Fate of zinc under high zinc status
The enterocytes are then sloughed off preventing the bound zinc from being absorbed.
Figure 12.83 Enterocytes are sloughed off and excreted in feces. There are a number of inhibitors of zinc absorption:
Non-heme iron also inhibits zinc absorption. In supplements, zinc is found as3,4:
Zinc oxide is the least bioavailable form, but since it is 80% zinc, it is commonly used in supplements7.
For more information on vitamin K, see the Required Web Link below.
Required Web Link
Zinc Fact Sheet for Health Professionals
Subsections:
References & Links
Links
Zinc Fact Sheet for Health Professionals - https://ods.od.nih.gov/factsheets/Zinc- HealthProfessional/
Zinc Functions
Zinc is a cofactor for up to 300 enzymes in the body1. Enzymes that use zinc as a cofactor are known as metalloenzymes.
Zinc is a cofactor for the antioxidant enzyme superoxide dismutase that converts superoxide to hydrogen peroxide, as shown below.
Figure 12.811 Superoxide dismutase uses zinc as a cofactor
Alcohol dehydrogenase uses 4 zincs per enzyme. Its role in ethanol metabolism is shown in Figure 12.8122.
Figure 12.812 Ethanol metabolism3,4
Zinc is also important for the formation of zinc fingers in proteins. Zinc fingers help proteins bind to DNA2.
Figure 12.815 Structure of a zinc finger, zinc is the green atom bound in the center5
Zinc is also important for growth, immune function, and reproduction2,6.
References & Links
Zinc Deficiency & Toxicity
As can be seen on the bottom map in the link below, the risk of zinc deficiency is low in North America, but there are other places in the world where it is much more common.
Figure 12.821 Worldwide prevalence of zinc deficiency1
At particular risk are children, pregnant women, elderly and the poor1. Symptoms of zinc deficiency include2,3: Growth inhibition, Delayed sexual maturation, Dermatitis, Hair loss, Impaired immune function, and Skeletal abnormalities
In the link below you can see a picture of an infant with dermatitis caused by zinc deficiency.
Web Link
Zinc toxicity is not common, but an acute toxicity results in2: Nausea, Vomiting, Intestinal cramps, and Diarrhea
Chronic toxicity can result in copper deficiency, as will be discussed in the copper section3.
References & Links
Links
Zinc Deficiency Dermatitis - http://img.tfd.com/mosbycam/thumbs/50029X-fx3.jpg
Copper
Like iron, copper is found in 2 forms:
Cu1+ is the form that is primarily absorbed, thus Cu2+ is reduced to Cu1+ in the lumen. Like zinc, copper is transported through the portal vein to the liver bound to albumin, as shown below. Albumin has a high affinity for Cu2+, so Cu1+ is oxidized before transported to albumin through ATP7A, as illustrated below.
Figure 12.91 Copper absorption
Like zinc, there is not much storage of copper in the body. The liver is the primary site of storage, where copper is taken up through an unknown transporter. If it is going to be stored, it will bind with thionein to form metallothionein. Copper to be sent out to the body is transferred to the copper transport protein ceruloplasmin, which can bind 6 coppers/protein as shown below1.
Figure 12.92 Copper in the hepatocyte
Legumes, whole grains, nuts, shellfish, and seeds are good sources of copper2. It is estimated that over 50% of copper consumed is absorbed1. Copper is primarily excreted in the feces.
There are number of different forms of copper used in supplements: Copper sulfate (25% copper)
Cupric chloride (47% copper)
Cupric acetate (35% copper) Copper carbonate (57% copper) Cupric oxide (80% copper)
All of these forms of copper are bioavailable, except cupric oxide. Assays have shown that it is not absorbed at all. Nevertheless, some supplements still use this form of copper1,3.
Subsections:
References & Links
129(12): 2278-2279.
Copper Functions
Copper has a number of functions that are described and shown below.
Two copper-containing proteins, ceruloplasmin and hephaestin, oxidize Fe2+ to Fe3+. Fe3+ is the form that binds to transferrin, as shown below1.
Figure 12.911 Transport and uptake of iron
Because copper is needed for this function, it is important for iron absorption.
Copper is also a cofactor for superoxide dismutase, which converts superoxide to hydrogen peroxide, as shown below.
Figure 12.912 Superoxide dismutase uses zinc as a cofactor
Copper is also needed for hormone synthesis. For example, it is a cofactor for dopamine beta- hydroxylase, which converts dopamine to norepinephrine.
Hopefully the following example looks vaguely familiar because we talked about this pathway in the the vitamin C functions subsection. Ascorbic acid reduces Cu2+ back to Cu1+ so that this enzyme can continue to function, as shown below1. This is analogous to how ascorbic acid reduces Fe3+ back to Fe2+ so proline and lysyl hydroxylases can continue to function.
Figure 12.914 Dopamine beta-hydroxylase
Cytochrome c oxidase (complex IV) in the electron transport chain is a copper-containing enzyme that reduces oxygen to form water, as shown below1.
Figure 12.915 Cytochrome c oxidase (complex IV)2
Lysyl oxidase, an enzyme that is important for cross-linking between structural proteins (collagen and elastin), requires copper as a cofactor1.
References & Links
Copper Deficiency & Toxicity
Copper deficiency is rare in humans, but results in the following symptoms1,2:
Copper deficiency can result in a secondary iron deficiency, since Fe2+ cannot be oxidized to Fe3+ to bind to transferrin. This can cause the hypochromic anemia that occurs in iron deficiency.
Copper toxicity is also rare in humans, but acute toxicity results in the following symptoms1,2: Nausea, vomiting, diarrhea, and abdominal pain.
Chronic symptoms include1,2: Brain, liver, and kidney damage as well as Neurological damage
Wilson's disease is a genetic disorder where a mutation in ATP7B prevents copper excretion, resulting in copper toxicity. One notable symptom is that individuals with this disease have golden to greenish-brown Kayser-Fleischer rings around the edges of the cornea, as shown in the link below1,2.
Web Link
References & Links
Link
Kayser-Fleischer ring - http://www.nejm.org/doi/full/10.1056/NEJMicm1101534#t=article
How High Zinc Intake Can Lead to Copper & Iron Deficiencies
As you learned previously, thionein is the storage protein for zinc, but it more avidly binds copper. When it binds a mineral, it becomes metallothionein. High zinc intake results in increased thionein synthesis in the enterocyte. Thus, when an individual is consuming high zinc levels, the enterocyte will have high levels of thionein as shown below.
Figure 12.931 Zinc increases thionein production
The high levels of thionein will bind any copper that is taken up into the enterocyte (as metallothionein), "trapping" the copper in the enterocyte and preventing it from being absorbed into circulation, as shown below.
Figure 12.932 Copper taken up into the enterocyte is bound to thionein forming metallothionein.
The enterocytes containing the "trapped" copper move up the crypt and are sloughed off and excreted in feces. The copper consumed essentially is lost from the body through this process.
Figure 12.933 Enterocytes are sloughed off and excreted in feces
Without adequate copper being transported to the liver, no ceruloplasmin is produced and released into circulation. The lack of copper further influences iron transport by decreasing ceruloplasmin in circulation and hephaestin (another copper-containing protein) on the membrane of the enterocyte. These 2 proteins normally convert Fe2+ to Fe3+ so that iron can bind to transferrin.
Figure 12.934 Lack of copper means that hephaestin and ceruloplasmin aren't available to oxidize Fe2+ to Fe3+
Without hephaestin and ceruloplasmin, Fe3+ is not formed from Fe2+. As a result Fe2+ is "trapped" in the enterocyte because it can't bind to transferrin as shown in Figure 12.935.
Figure 12.935 Fe2+ is trapped in the enterocyte
The enterocytes containing the "trapped" iron move up the crypt and are also sloughed off and excreted in feces. The iron consumed essentially is lost from the body through this process.
Figure 12.936 Enterocytes are sloughed off and excreted in feces
In summary, high zinc intake increases thionein production, which traps all copper; the lack of copper decreases circulating ceruloplasmin and hephaestin, which causes all iron to be trapped as well. This example illustrates the interconnectedness of zinc, copper, and iron.
No References
Chapter 13: Electrolyte Micronutrients
In this chapter, electrolytes will be explained before learning more about the 4 electrolyte micronutrients. Then, hypertension will be discussed, along with the impact of these micronutrients on the condition.
Subsections:
Electrolytes
Electrolytes are compounds that separate into ions (molecules with a charge) in water. These compounds are also commonly referred to as salts. Electrolytes can be separated into 2 classes:
Cations: ions that have a positive charge Anions: ions that have a negative charge
The following table summarizes the major intracellular and extracellular electrolytes by giving their milliequivalents (mEq)/L. Milliequivalents are a measure of charge. Thus, a higher value means that the cation or anion is accounting for more charge.
Table 13.11 Major intracellular and extracellular electrolytes1,2
Intracellular | Extracellular | ||
Cations | Anions | Cations | Anions |
Potassium (K+) | Phosphate (PO4-) | Sodium (Na+) | Chloride (Cl-) |
Magnesium (Mg2+) | Proteins | Bicarbonate (HCO3-) | |
2- Sulfate (SO4 ) | Proteins | ||
The following figure graphically shows the major intracellular and extracellular cations (green) and anions (red).
Figure 13.11 Major intracellular and extracellular cations (green) and anions (red)2
Electrolytes and proteins are important in fluid balance. Your body is 60% water by weight.
Two-thirds of this water is intracellular, or within cells. One-third of the water is extracellular, or outside of cells. One-fourth of the extracellular fluid is plasma, while the other 3/4 is interstitial (between cells) fluid. Thus, when considering total body water, around 66% is intracellular fluid, 25% is interstitial fluid, and 8% is plasma3,4.
You might remember the term “osmosis” from a past science course. You might remember that osmosis has something to do with the movement of water across membranes; into or out of cells. You might further remember that osmosis can be driven by solute concentration (the concentration of dissolved substances). The solute concentration that drives osmosis is commonly called osmolality. Very simply, osmolality is the concentration of a dissolved substance, which tends to affect the movement of water. The electrolytes shown in the diagram above are responsible for osmolality. In Figure 13.11, a higher concentration of ions and proteins in the cell would be osmolality, that would ultimately drive the movement of water into the cell. If the concentration of ions and proteins outside of the cells were greater, you would expect that the osmolality would drive the movement of water out of the cell.
Water balance in our bodies takes place everywhere…in all of our organs…all of our tissues…between our individual cells, in a great complex of interactions ultimately moderated by osmolality. Osmolality can drive water movement into and out of tissues and cells, and osmolality can hold water in a particular place.
Fluid distribution between the different compartments of the body are shown in Figure 13.12.
Figure 13.12 Distribution of fluid in the body3,4.
References & Links
Sodium
Salt (NaCl) contributes almost all the sodium that we consume. 75-85% of the salt we consume is from processed foods, 10% is naturally in foods, and added salt contributes 10-15% of total salt intake1. Sodium is the major cation in extracellular fluid.
Figure 13.21 Sodium-potassium ATPase (aka sodium-potassium pump), an active carrier transporter3
Sodium has 3 main functions1:
Fluid balance
The body regulates sodium and fluid levels through a series of processes as shown in Figure
Figure 13.22 Response to decreased plasma volume and blood pressure
Aids in monosaccharide and amino acid absorption
Glucose and galactose are taken up into the enterocyte by sodium-glucose cotransporter 1 (SGLT1), which requires sodium to be transported along with glucose or galactose.
Figure 13.23 Carbohydrate Absorption
Amino acids are taken up and transported into circulation through a variety of amino acid transporters. Some of these transporters are sodium-dependent (require sodium to transport amino acids).
Figure 13.24 Protein absorption
Sodium deficiency is rare, and is normally due to excessive sweating. Sweat loss must reach 2- 3% of body weight before sodium losses are a concern1,2. This situation can occur in marathon runners and ultra-marathon runners who sweat for many hours straight (without proper liquid intake). Low blood sodium levels (hyponatremia) can result in1:
Hyponatremia can also result from water intoxication, a potentially fatal situation that can arise when too much water is consumed at one time. A decrease in sodium concentration can reduce osmolality outside of the cells and, therefore, increase the relative osmolality inside of the cells. As a consequence, cells swell as water moves in. This is a particularly dangerous situation in the brain. Swelling of brain tissue can result in an increase in intracranial pressure that can ultimately lead to cerebral edema and brainstem dysfunction.4
Sodium is not toxic, but higher sodium intake increases the risk of developing high blood pressure. High sodium intake also increases calcium excretion, but studies haven't found an increased risk of osteoporosis. High sodium intake may also increase the risk of developing kidney stones (by increasing calcium excretion), because calcium oxalate is the most common form of kidney stone as reference in Chapter 91.
References & Links
Chloride
Sodium's partner in salt, chloride, is the major extracellular anion. Almost all of the chloride we consume is from salt, and almost all chloride is absorbed. It is excreted in urine like sodium.
Chloride has the following functions1:
Chloride deficiency is rare, but can occur because of severe diarrhea or vomiting. Other symptoms of this deficiency include1,2:
Chloride is not toxic, but since it is a part of salt, it is recommended that we restrict our intake to avoid potential increases in blood pressure.
References & Links
Potassium
Potassium is the major intracellular cation. Good sources of potassium include beans, potatoes (with skin), milk products, orange juice, tomato juice, and bananas1,2. Potassium, like sodium and chloride, is well absorbed. Greater than 85% of consumed potassium is absorbed.
Potassium is primarily excreted in urine (~90%)3. Potassium is important for:
Increased potassium intake results in decreased calcium excretion. This is the opposite effect of increased sodium intake, which increases calcium excretion1.
Potassium deficiency is rare but can be fatal. Symptoms include:
Weakness Fatigue Constipation
Irregular heartbeat (can be fatal)
Deficiency can occur in individuals that are on diuretics, drugs that increase urine production, and individuals with eating disorders1.
Toxicity is also extremely rare, only occurring if there is a problem with kidney function. Symptoms of toxicity are irregular heartbeat and even cardiac arrest1.
References & Links
Magnesium
Magnesium is an electrolyte, but that is not considered its major function in the body. Green leafy vegetables, beans, nuts, seeds, and whole grains are good sources of magnesium1,2. 40- 60% of consumed magnesium is absorbed at normal levels of intake. Magnesium is excreted primarily in urine3.
Magnesium helps to stabilize ATP and nucleotides by binding to phosphate groups. Magnesium plays a role in over 300 enzymes in the body. Here is a list of some of the physiological processes that magnesium participates in3:
Magnesium deficiency is rare, but can be caused by prolonged diarrhea or vomiting. Symptoms include1:
Magnesium toxicity is also rare but can occur from excessive use of antacids or laxatives. Symptoms include3:
Magnesium supplements differ in percent of magnesium in the different forms, as shown in Figure 13.51.
Figure 13.51 Percent magnesium in oral supplements4
The bioavailability of magnesium oxide is significantly lower than magnesium chloride, magnesium lactate, and magnesium aspartate. The latter 3 are equally bioavailable4.
References & Links
Hypertension, Salt-Sensitivity & the DASH Diet
Approximately 27% of American adults have hypertension (high blood pressure), which increases their risk of developing cardiovascular disease1. Salt and/or sodium intake is believed to be a major causative factor in the development of hypertension. However, it is now known that not everyone is salt-sensitive. Salt-sensitive means that a person’s blood pressure increases with increased salt intake and decreases with decreased salt intake. Approximately 25% of normotensive (normal blood pressure) individuals and 50% of hypertensive individuals are salt-sensitive2. Most others are salt-insensitive, and in a small portion of individuals, low salt consumption actually increases blood pressure1. Unfortunately, there isn't a clinical method to determine whether a person is salt-sensitive. There are some known characteristics that increase the likelihood of an individual being salt-sensitive. They are1:
There is some evidence now suggesting that there may be negative effects in some people who restrict their sodium intakes to the levels recommended by some organizations. The second link describes a couple of studies that had conflicting outcomes as it relates to the importance of salt reduction in decreasing blood pressure and cardiovascular disease. The third link is to a study that found that higher potassium consumption, not lower sodium consumption, was associated with decreased blood pressure in adolescent teenage girls.
Required Web Links
Report Questions Reducing Salt Intake Too Dramatically Pour on the Salt? New Research Suggests More Is OK For Teenagers, Potassium May Matter More Than Salt
To combat hypertension, the Dietary Approaches to Stop Hypertension (DASH) diet was developed. This diet emphasizes fruits, vegetables, fat-free/low-fat milk and milk products, whole grain products, fish, poultry, and nuts. It limits red meat, sweets, added sugars, and sugar-containing beverages As a result the diet is high in potassium, magnesium, calcium, protein, and fiber.
The daily goals for the DASH diet are shown in Figure 13.61.
Figure 13.61 DASH daily nutrient goals3
To get an idea of what types of foods and how much would be consumed in the diet, an eating plan is shown in Figure 13.62.
Figure 13.62 DASH eating plan3
The DASH diet has been shown to be remarkably effective in decreasing blood pressure in those with hypertension. Nevertheless, most people with hypertension aren't following the DASH diet. In fact, evidence from the National Health and Nutrition Examination Survey found that significantly fewer hypertensive individuals were following the DASH diet in 1999-2004 than during 1988-1994, as shown in the Table 13.61.
Table 13.61 Percent of hypertensive subjects in NHANES trial meeting the DASH goals4
Variable | NHANES 1988-1994 (n = 4336) | NHANES 1999-2004 (n = 3821) | Absolute Change (%) | p-value |
DASH Accordance | 29.3 ± 1.5 | 21.7 ± 1.3 | -7.6 | <0.001 |
Total Fat | 42.9 ± 1.8 | 35.9 ± 2.0 | -7.0 | 0.01 |
Saturated Fat | 20.6 ± 1.2 | 20.4 ± 1.4 | -0.2 | 0.94 |
Protein | 43.7 ± 2.0 | 47.7 ± 1.9 | 4.0 | 0.73 |
Cholesterol | 26.4 ± 2.2 | 24.3 ± 1.6 | -2.1 | 0.44 |
Fiber | 20.2 ± 1.5 | 12.3 ± 0.9 | -7.9 | <0.001 |
Magnesium | 14.2 ± 1.3 | 6.4 ± 0.8 | -7.8 | <0.001 |
Calcium | 19.0 ± 1.6 | 17.6 ± 2.0 | -1.4 | 0.58 |
Potassium | 12.7 ± 0.9 | 11.7 ± 0.9 | -1.0 | 0.46 |
Sodium | 17.8 ± 1.5 | 14.6 ± 1.3 | -3.2 | 0.21 |
The main components that contributed to the decrease in DASH diet accordance were total fat, fiber, and magnesium, as indicated by their high negative absolute changes.
References & Links
Links
Report Questions Reducing Salt Intake Too Dramatically - http://www.usatoday.com/story/news/nation/2013/05/14/salt-diet-sodium-intake/2156143/ Pour on the Salt? New Research Suggests More Is OK - http://www.nbcnews.com/health/heart- health/pour-salt-new-research-suggests-more-ok-n179941
For Teenagers, Potassium May Matter More Than Salt - http://well.blogs.nytimes.com/2015/04/27/for-teenagers-potassium-may-matter-more-than- salt/
CHAPTER 14: Achieving a Healthy Diet
Adapted from: Zimmerman and Snow. “An Introduction to Nutrition” v. 1.0. Accessed on December 4, 2017. https://2012books.lardbucket.org/books/an-introduction-to-nutrition/
Sections:
Let us finally talk about a toolkit for a healthy diet. Long before the dietary toolkit full of acronyms such as DRI, RDA, EAR, and UL, daily standards were created with the single goal of keeping workers alive and toiling in the factories and workhouses of the early Industrial Revolution. In the late nineteenth century, powerhouse tycoons operated without fear of legal consequences and paid their workers as little as possible in order to maximize their own profits. Workers could barely afford housing, and depended on what their bosses fed them at the workhouses to fend off starvation.
Figure 14.01 Without programs like food stamps, workers and military personnel often had to accept whatever food their employers gave to them. © Shutterstock
Living conditions in those days show that the term “starvation wages” was not just a figure of speech. Here is a typical day’s menu:
As public awareness about these working conditions grew, so did public indignation. Experts were eventually called upon to create the first dietary guidelines, which were designed only to provide a typical individual with what they needed to survive each day, and no more. It was not until World War I that the British Royal Society first made recommendations about the nutrients people needed to be healthy, as opposed to merely surviving. They included ideas we now take for granted, such as making fruit and vegetables part of the diet and giving milk to children. Since then, most governments have established their own dietary standards. Food is a precious commodity, like energy, and controlling the way it is distributed confers power.
Sometimes this power is used to influence other countries, as when the United States withholds food aid from countries with regimes of which it disapproves. Governments can also use their power over food to support their most fragile citizens with food relief programs, such as the Supplemental Nutrition Assistance Program (SNAP) and the Women, Infants, and Children Supplemental Food Program (WIC).
The US government has also established dietary standards to help citizens follow a healthy diet. The first of these were the Recommended Daily Allowances (RDAs), published in 1943 because of the widespread food shortages caused by World War II. During the war, the government rationed sugar, butter, milk, cheese, eggs, coffee, and canned goods. Limited transportation made it hard to distribute fruits and vegetables. To solve this problem, the government
encouraged citizens to plant “victory gardens” to produce their own fruits and vegetables. More than twenty million people began planting gardens in backyards, empty lots, and on rooftops. Neighbors pooled their resources and formed cooperatives, planting in the name of patriotism.
Today in the United States, there are various measures used to maintain access to nutritious, safe, and sufficient food to the citizenry. Many of these dietary guidelines are provided by the government, and are found at the Food and Drug Administration’s (FDA) new website, ChooseMyPlate.gov. We call this collection of guidelines the “dietary toolkit.”
The government works to provide citizens with information, guidance, and access to healthy foods. How will you decide which information to follow? What are the elements of a healthy diet, and how do you figure out ways to incorporate them into your personal diet plan? The
dietary toolkit can be likened to a mechanics toolkit, with every tool designed for a specific task(s). Likewise, there are many tools in the dietary toolkit that can help you build, fix, or maintain your diet for good health. In this chapter, you will learn about many of the tools available to you.
Today, the US government sets dietary guidelines that provide evidence-based nutrition information designed to improve the health of the population. Source: US Department of Agriculture.
A Healthy Philosophy toward Food
“Tell me what you eat, and I will tell you what you are” wrote the French lawyer and politician, Antheime Brillat-Savarin in his book, Physiologie du Gout, ou Meditations de Gastronomie Transcendante, in 1826. Almost one hundred years later, nutritionist Victor Lindlahr wrote in an ad in 1923, “Ninety percent of the diseases known to man are caused by cheap foodstuffs. You are what you eat.” Today, we know this phrase simply as, “You are what you eat.”1
Good nutrition equates to receiving enough (but not too much) of the macronutrients (proteins, carbohydrates, fats, and water) and micronutrients (vitamins and minerals) so that the body can stay healthy, grow properly, and work effectively. The phrase “you are what you eat” refers to the fact that your body will respond to the food it receives, either good or bad. Processed, sugary, high-fat, and excessively salted foods leave the body tired and unable to perform effectively. By contrast, eating fresh, natural whole foods fuels the body by providing what it needs to produce energy, promote metabolic activity, prevent micronutrient deficiencies, ward off chronic disease, and to promote a sense of overall health and well-being.
Nutrition provides the nutrients the body needs to perform all activities, from taking a breath to strenuous athletic activity. © Dreamstime
Table 14.1 Why Nutrition Is Important to Health
Protein | Necessary for tissue formation, cell reparation, and hormone and enzyme production. It is essential for building strong muscles and a healthy immune system. |
Carbohydrates | Provide a ready source of energy for the body and provide structural constituents for the formation of cells. |
Fat | Provides stored energy for the body, functions as structural components of cells and also as signaling molecules for proper cellular communication. It provides insulation to vital organs and works to maintain body temperature. |
Vitamins | Regulate body processes and promote normal body-system functions. |
Minerals | Regulate body processes, are necessary for proper cellular function, and comprise body tissue. |
Water | Transports essential nutrients to all body parts, transports waste products for disposal, and aids with body temperature maintenance. |
Undernutrition, Overnutrition, and Malnutrition
For many, the word “malnutrition” produces an image of a child in a third-world country with a bloated belly, and skinny arms and legs. However, this image alone is not an accurate representation of the state of malnutrition. For example, someone who is 150 pounds overweight can also be malnourished. Malnutrition refers to one not receiving proper nutrition and does not distinguish between the consequences of too many nutrients or the lack of nutrients, both of which impair overall health. Undernutrition is characterized by a lack of nutrients and insufficient energy supply, whereas overnutrition is characterized by excessive nutrient and energy intake. Overnutrition can result in obesity, a growing global health threat. Obesity is defined as a metabolic disorder that leads to an overaccumulation of fat tissue.
Although not as prevalent in America as it is in developing countries, undernutrition is not uncommon and affects many subpopulations, including the elderly, those with certain diseases, and those in poverty. Many people who live with diseases either have no appetite or may not be able to digest food properly. Some medical causes of malnutrition include cancer,
inflammatory bowel syndrome, AIDS, Alzheimer’s disease, illnesses or conditions that cause chronic pain, psychiatric illnesses, such as anorexia nervosa, or as a result of side effects from medications. Overnutrition is an epidemic in the United States and is known to be a risk factor for many diseases, including Type 2 diabetes, cardiovascular disease, inflammatory disorders (such as rheumatoid arthritis), and cancer.
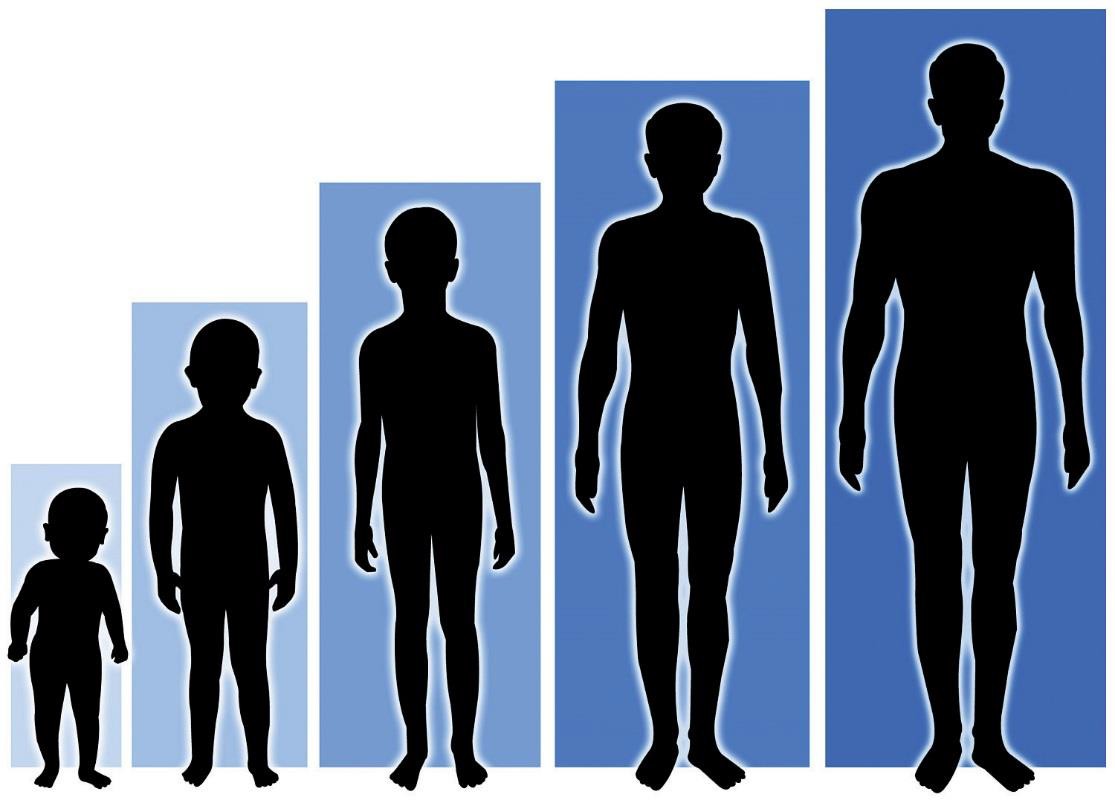 Growth and Development
Proper growth throughout the life stages depends upon proper nutrition. © Dreamstime
From birth to adulthood, nutrients fuel proper growth and function of all body cells, tissue, and systems. Without proper amounts of nutrients, growth and development are stunted. Some nutrient deficiencies manifest right away, but sometimes the effects of undernutrition are not seen until later in life. For example, if children do not consume proper amounts of calcium and vitamin D, peak bone mass will be reduced compared to what it would be had adequate amounts of these nutrients been consumed. When adults enter old age without adequate bone mass, they are more susceptible to osteoporosis, putting them at risk for bone fractures.
Therefore, it is vital to build bone strength through proper nutrition during youth because it cannot be done in later life.2
The Healing Process
With all wounds, from a paper cut to major surgery, the body must heal itself. Healing is facilitated through proper nutrition3, while malnutrition inhibits and complicates this vital process.
Healing, a critical function of a healthy body, is facilitated by adequate nutrition.
The following nutrients are important for proper healing:
Now that we have discussed the importance of proper nutrition for your body to perform normal tissue growth, repair, and maintenance, we will discuss ways of achieving a healthy diet.
References & Links
1Phrase Finder. Accessed July 6, 2011. http://www.phrases.org.uk/meanings/you%20are%20what%20you%20eat.html
2MedicineNet.com. “Nutrients for the Growing Years.” Last reviewed August 13, 2003. http://www.medicinenet.com/script/main/art.asp?articlekey=10054.
3MacKay, D., ND, and A. L. Miller, ND. “Nutritional Support for Wound Healing.” Alternative Medicine Review 8, no. 4 (2003): 359–77.
What Is Nutritional Balance and Moderation?
Achieving a healthy diet is a matter of balancing the quality and quantity of food that is eaten. There are five key factors that make up a healthful diet:
A healthy diet is one that favors whole foods. As an alternative to modern processed foods, a healthy diet focuses on “real” fresh whole foods that have been sustaining people throughout the millenniums. Whole foods supply the needed vitamins, minerals, protein, carbohydrates, fats, and fiber that are essential to good health. Commercially prepared and fast foods are often lacking nutrients and often contain inordinate amounts of sugar, salt, saturated and trans fats, all of which are associated with the development of diseases such as atherosclerosis, heart disease, stroke, cancer, obesity, high cholesterol, diabetes, and other illnesses. A balanced diet is a mix of food from the different food groups (vegetables, legumes, fruits, grains, protein foods, and dairy).
ADEQUACY
An adequate diet is one that favors nutrient-dense foods. Nutrient-dense foods are defined as foods that contain many essential nutrients per calorie. Nutrient-dense foods are the opposite of “empty-calorie” foods, such as sugary carbonated beverages, which are also called “nutrient- poor.” Nutrient-dense foods include fruits and vegetables, lean meats, poultry, fish, low-fat dairy products, and whole grains. Choosing more nutrient-dense foods will facilitate weight loss, while simultaneously providing all necessary nutrients.
Table 14.2 The Smart Choice: Nutrient-Dense Food Alternatives
Instead of… | Replace with… |
Sweetened fruit yogurt | Plain fat-free yogurt with fresh fruit |
Whole milk | Low-fat or fat-free milk |
Cheese | Low-fat or reduced-fat cheese |
Bacon or sausage | Canadian bacon or lean ham |
Sweetened cereals | Minimally sweetened cereals with fresh fruit |
Apple or berry pie | Fresh apple or berries |
Deep-fried French fries | Oven-baked French fries or sweet potato baked fries |
Fried vegetables | Steamed or roasted vegetables |
Sugary sweetened soft drinks | Seltzer mixed with 100 percent fruit juice |
Recipes that call for sugar | Experiment with reducing amount of sugar and adding spices (cinnamon, nutmeg, etc…) |
1Source: US Department of Agriculture. “Food Groups.” http://www.choosemyplate.gov/food-groups/.
BALANCE
Balance the foods in your diet. Achieving balance in your diet entails not consuming one nutrient at the expense of another. For example, calcium is essential for healthy teeth and bones, but too much calcium will interfere with iron absorption. Most foods that are good sources of iron are poor sources of calcium, so in order to get the necessary amounts of calcium and iron from your diet, a proper balance between food choices is critical. Another example is that while sodium is a vital nutrient, an overabundance of it can contribute to congestive heart failure and chronic kidney disease. Remember, everything must be consumed in the proper amounts.
With careful planning, a balanced diet providing optimal nutrition can be achieved and maintained.
© Shutterstock
MODERATION
Eat in moderation. Moderation is crucial for optimal health and survival. Burgers, French fries, cake, and ice cream each night for dinner will lead to health complications. But as part of an otherwise healthful diet and consumed only on a weekly basis, this should not have too much of an impact on overall health. If this is done once per month, it will have even less of an impact upon overall health. It is important to remember that eating is, in part, about enjoyment and indulging with a spirit of moderation. This fits within a healthy diet.
CALORIE CONTROL
Monitor food portions. For optimum weight maintenance, it is important to ensure that energy consumed from foods meets the energy expenditures required for body functions and activity. If not, the excess energy contributes to gradual, steady weight gain. In order to lose weight, you
need to ensure that more calories are burned than consumed. Likewise, in order to gain weight, calories must be eaten in excess of what is expended daily.
The number of calories consumed should always match the number of calories being expended by the body to maintain a healthy weight.
© Networkgraphics
VARIETY
Variety involves eating different foods from all the food groups. Eating a varied diet helps to ensure that you receive all the nutrients necessary for a healthy diet. One of the major drawbacks of a monotonous diet is the risk of consuming too much of some nutrients and not enough of others. Trying new foods can also be a source of pleasure—you never know what foods you might like until you try them.
Developing a healthful diet can be rewarding, but be mindful that all of the principles presented must be followed to derive maximal health benefits. For instance, introducing variety in your diet can still result in the
Scientific evidence confirms that a diet full of fresh whole foods reduces the risks for developing chronic disease and helps maintain a healthy weight.
© Dreamstime
consumption of too many high-calorie, nutrient-poor foods and inadequate nutrient intake if you do not also employ moderation and calorie control. Using all of these principles together will afford you lasting health benefits.
Table 14.3 Food Choices for a Healthful Diet
Grain | Vegetable | Fruit | Dairy | Protein |
Whole-grain products, | Dark green: broccoli, | apples, apricots, | all fluid milk (fat free, | Meats: beef, ham, |
brown rice, quinoa, | collards, kale, romaine | bananas | low-fat, reduced-fat, | lamb, pork, veal |
barley, buckwheat, | lettuce, spinach, turnip | whole milk, lactose- | ||
millet, wild rice, oats, | greens, watercress | free), fortified soy | ||
rye berries, sorghum, | milk, yogurt | |||
bulgur, kasha, farrow, | ||||
wheat berries, corn, | ||||
amaranth, spelt | ||||
Red and orange: Acorn | Berries: strawberries, | Hard natural cheeses: | Poultry: chicken, | |
squash, butternut | blueberries, | cheddar, mozzarella, | goose, turkey, duck | |
squash, carrots, | raspberries, cherries, | Swiss, parmesan | ||
pumpkin, red peppers, | grapefruit, kiwi fruit, | |||
sweet potatoes | lemons, limes, | |||
mangoes | ||||
Beans and peas: Black | Melons: cantaloupe, | Soft cheeses: ricotta, | Eggs | |
beans, black-eyed | honey dew, | cottage | ||
peas, chickpeas, kidney | watermelon | |||
beans, lentils, navy | ||||
beans, pinto beans, | ||||
soybeans, split peas, | ||||
white beans | ||||
Starchy: Cassava, green | Other fruits: | Beans and peas: (see | ||
bananas, green peas, | nectarines, oranges, | vegetable column) | ||
green lima beans, | peaches, pears, | |||
plantains, potatoes, | papaya, pineapple, | |||
taro, water chestnuts | plums, prunes | |||
Other vegetables: | Nuts and seeds: | |||
Asparagus, avocado, | almonds, cashews, | |||
bean sprouts, beets, | hazelnuts, peanuts, | |||
Brussels sprouts, | pecans, pistachios, | |||
cabbage, cauliflower, | pumpkin seeds, sesame | |||
celery, eggplant, green | seeds, sunflower seeds, | |||
beans, green peppers, | walnuts | |||
mushrooms, okra, | ||||
onions, parsnips | ||||
Seafood: catfish, cod, flounder, haddock, halibut, herring, mackerel, pollock, porgy, salmon, sea bass, snapper, swordfish, trout, tuna | ||||
Shellfish: scallops, muscles, crab, lobster |
Source: Adapted from http://www.choosemyplate.gov/food-groups/protein-foods.html.
Required Video 14.1
Different Types of Grains: In this video, a registered dietitian discusses the benefits of eating whole grains.2
http://www.ehow.com/video_4983984_different-types-grains.html
References and Links
1Source: US Department of Agriculture. “Food Groups.” http://www.choosemyplate.gov/food-groups/.
2http://www.ehow.com/video_4983984_different-types-grains.html
Video Links
http://www.ehow.com/video_4983984_different-types-grains.html
Understanding the Bigger Picture of Dietary Guidelines
Dietary guidelines help people to stay on a healthful track by drawing attention to the overall scope of their diet and lifestyle. © Dreamstime
The first US dietary recommendations were set by the National Academy of Sciences in 1941. The recommended dietary allowances (RDA) were first established out of concern that
America’s overseas World War II troops were not consuming enough daily nutrients to maintain good health. The first Food and Nutrition Board was created in 1941, and in the same year set recommendations for the adequate intakes of caloric energy and eight essential nutrients.
These were disseminated to officials responsible for food relief for armed forces and civilians supporting the war effort. Since 1980, the dietary guidelines have been reevaluated and updated every five years by the advisory committees of the US Department of Agriculture
(USDA) and the US Department of Health and Human Services (HHS). The guidelines are continually revised to keep up with new scientific evidence-based conclusions on the importance of nutritional adequacy and physical activity to overall health. While dietary recommendations set prior to 1980 focused only on preventing nutrient inadequacy, the current dietary guidelines have the additional goals of promoting health, reducing chronic disease, and decreasing the prevalence of overweight and obesity.
Why Are Guidelines Needed?
Instituting nation-wide standard policies provides consistency across organizations and allows health-care workers, nutrition educators, school boards, and elder-care facilities to improve nutrition and subsequently the health of their respective
populations. At the same time, the goal of the 2010 Dietary Guidelines is to provide packaged informative guidelines that will help any interested person in obtaining optimal nutritional balance and health. The seventh edition of the Dietary Guidelines was released in 2010 and focuses mainly on combating the obesity
epidemic. USDA secretary Tom Vilsack says, “The bottom line is that most Americans need to trim their waistlines to reduce the risk of developing diet-related chronic disease. Improving our eating habits is not only good for every individual and family, but also for our country.” The Dietary Guidelines are formulated by the Food and Nutrition Board of the Institute of Medicine (IOM) from
the review of thousands of scientific journal articles by a consensus panel consisting of more than two thousand nutrition experts with the overall mission of improving the health of the nation.1
The major theme of the 2010 Dietary
Guidelines for Americans is an adequate diet combined with proper exercise. © Dreamstime
Major Themes of the 2010 Dietary Guidelines
The 2010 Dietary Guidelines consists of four major action steps for the American public to improve the overall health of the country. These steps are as follows:
We will discuss the highlights of each chapter of the 2010 Dietary Guidelines; however if you are interested in reading more, visit the USDA website, http://www.cnpp.usda.gov/DGAs2010 - PolicyDocument.htm.
How should you develop a healthy eating plan to best achieve your goals of losing weight, gaining weight, or maintaining weight? We will start with some basics and move on to healthy eating patterns.
To achieve the goal of reducing caloric intake, the 2010 Dietary Guidelines promote the following:
Foods and Food Components to Reduce
High consumptions of certain foods, such as those high in saturated or trans fat, sodium, added sugars, and refined grains may contribute to the increased incidence of chronic disease.
Additionally, excessive consumption of these foods replaces the intake of more nutrient-dense foods.
Table 14.4 A Little Less of These, Please!
Dietary Constituent | Health Implications | Recommendations |
Excess sodium | High blood pressure | Limit intake to 2,300 mg daily |
Too much saturated fat | Cardiovascular disease | Limit intake to < 10 percent of total calories |
Trans fats | Cardiovascular disease | Minimal, if any consumption |
Excess cholesterol | Atherosclerosis | Limit intake to below 300 mg daily |
SoFAS (solid fats and added sugars) | Obesity, Type 2 diabetes | Avoid if possible |
Too much alcohol | Impaired liver function, impaired motor function | No more than one drink per day for women; No more than two drinks per day for men |
The average person consumes 3,400 milligrams of sodium per day, mostly in the form of table salt. The 2010 Dietary Guidelines recommend that Americans reduce their daily sodium intake to less than 2,300 milligrams. If you are over the age of fifty-one, are African American, or have cardiovascular risk factors, such as high blood pressure or diabetes, sodium intake should be reduced even further to 1,500 milligrams. The Dietary Guidelines also recommend that less than 10 percent of calories come from saturated fat, and that fat calories should be obtained by eating foods high in unsaturated fatty acids. Cholesterol intake should be decreased to below 300 milligrams per day and trans fatty acid consumption kept to a bare minimum. The Dietary Guidelines stress the importance of limiting the consumption of foods with refined grains and added sugars, and introduce the new term, SoFAS, which is an acronym for solid fats and added sugars. Both of these are to be avoided in a healthy diet plan.3 Moreover, if alcohol is consumed, it should be consumed only in moderation, which for women it is not more than one drink per day and for men is not more than two drinks per day. The macronutrients protein, carbohydrates, and fats contribute considerably to total caloric intake. The IOM has made recommendations for different age groups on the percentage of total calories that should be obtained from each macronutrient class.
Table 14.5 Recommendations for Macronutrient Intake as Percentage of Total Calories
Age Group | Protein (%) | Carbohydrates (%) | Fat (%) |
Children (1–3) | 5–20 | 45–65 | 30–40 |
Children and Adolescents (4–18) | 10–30 | 45–65 | 25–35 |
Adults (>19) | 10–35 | 45–65 | 20–35 |
Source: 2010 Dietary Guidelines.
Foods and Nutrients to Increase
The typical American diet lacks sufficient amounts of vegetables, fruits, whole grains, and high- calcium foods, causing concern for deficiencies in certain nutrients important for maintaining health. The 2010 Dietary Guidelines provide the following suggestions on food choices to achieve a healthier diet:
 Building Healthy Eating Patterns
Fresh vegetables and olive oil are examples of foods emphasized in the DASH and Mediterranean diets. © Thinkstock
The 2010 Dietary Guidelines recommend that people make an effort to reduce their caloric consumption, reduce the intake of nutrient-poor foods, and increase the intake of nutrient- dense foods. To accomplish these tasks it is necessary to incorporate moderation and variety. The goal is not only choosing specific foods for your diet, but also the development of a healthy eating pattern. Several studies provide good evidence that certain dietary patterns increase overall health and decrease the risk of chronic disease. The Dietary Approaches to Stop Hypertension trial, or DASH, reports that men and women who consumed more than eight servings per day of fruits and vegetables had lower blood pressures than a control group that consumed under four servings per day of fruits and vegetables.4 Other studies investigating the benefits of the DASH diet have also found it to be protective against cardiovascular disease and decrease overall mortality. Another well-known diet is the Mediterranean diet. In general, the Mediterranean diet is described as one that emphasizes fruits, vegetables, whole grains, and nuts, and olive oil as a replacement for butter. Few meats and high-fat dairy products are eaten. Observational studies have linked the Mediterranean diet to reduced cardiovascular disease and decreased mortality. Vegetarian diets, which emphasize many of the same foods as the DASH and Mediterranean diets have also been linked to a decrease in incidences of some chronic diseases.
References and Links
1Johnson, T.D. “Online Only: New Dietary Guidelines Call for Less Salt, Fewer Calories, More Exercise.” Nation’s Health 41, no. 2 (March 2011): E6. http://thenationshealth.aphapublications.org/content/41/2/E6.full.
2 2008 Physical Activity Guidelines for Americans.
http://www.cnpp.usda.gov/Publications/DietaryGuidelines/2010/PolicyDoc/Chapter1.pdf
3Nelson, J. and K. Zeratsky. “Dietary Guidelines Connect SoFAS and Weight Gain.” Mayo Clinic, Nutrition-Wise
(blog). August 25, 2010. http://www.mayoclinic.com/health/dietary-guidelines/MY01417.
4Sacks, F.M, et al., “Effects on Blood Pressure of Reduced Dietary Sodium and the Dietary Approaches to Stop Hypertension (DASH) Diet.” N Engl J Med. 344, no. 1 (January 2001): 3–10. http://www.nejm.org/doi/full/10.1056/NEJM200101043440101.
National Goals for Nutrition and Health: Healthy People 2020
Required Video 14.2
Preparing for the Next Decade: A 2020 Vision for Healthy People http://www.youtube.com/v/zZG94c7xQmE
The Healthy People 2020 program, launched in 2010, is a ten-year national program instituted by the US government with objectives aimed toward improving the health of all Americans.
Similar to the 2010 Dietary Guidelines, it has been established to promote longer lives free of preventable disease, disability, injury, and premature death. With a revived intent on
identifying, measuring, tracking, and reducing health disparities through a “determinants of health approach,” Healthy People 2020 will strive to create the social and physical environments that promote good health for all and to promote quality of life, healthy
development, and healthy behaviors across all life stages. This means that the understanding of what makes and keeps people healthy is consistently refined. The determinants of health approach reflects the evidence from outside factors that greatly affect the health of individuals.1 It takes into consideration the circumstances in which people are born, live, work, and age. It also reflects the conditions that shape their circumstances such as money, power, and resources at the local, national, and global levels. Social determinants of health are primarily accountable for the lack of fair health opportunities and the unjust differences in health status that exist within and between countries.2
Helping People Make Healthy Choices
It is not just ourselves, the food industry, and federal government that shape our choices of food and physical activity, but also our sex, genetics, disabilities, income, religion, culture, education, lifestyle, age, and environment. All of these factors must be addressed by organizations and individuals that seek to make changes in dietary habits. The socioeconomic model incorporates all of these factors and is used by health-promoting organizations, such as the USDA and the HHS to determine multiple avenues through which to promote healthy eating patterns, to increase levels of physical activity, and to reduce the risk of chronic disease for all Americans. Lower economic prosperity influences diet specifically by lowering food quality, decreasing food choices, and decreasing access to enough food. As a result of the recent financial crisis in America the number of people who struggle to have enough to eat is rising and approaching fifty million. In response to these recent numbers, USDA Secretary Tom Vilsack said, “These numbers are a wake-up call…for us to get very serious about food security and hunger, about nutrition and food safety in this country.”3
The socioeconomic model helps organizations and the government to plan and promote effective healthy-eating programs tailored to specific populations. © Networkgraphics
Required Video 14.3
Determinants of Health Approach in Healthy People 2020 http://www.youtube.com/v/5Lul6KNIw_8
Goals for Nutrition and Weight Status While Healthy People 2020 has many goals and objectives, we are going to focus on the two goals for nutrition and weight status. They are to promote health and reduce the risk of developing chronic diseases by encouraging Americans to consume healthful diets and to achieve and maintain healthy body weights. Nutrition criteria are reflective of a solid scientific foundation for health and weight management. Emphasis is on modifying individual behavior patterns and habits, and having policies and environments that
will support these behaviors in various settings, such as schools and local community-based organizations.
One of the ways that Healthy People 2020 strives to promote good health and nutrition is by bringing together multiple agencies and groups dedicated to achieving the Healthy People 2020 nationwide objectives.
© Shutterstock
Healthy People 2020 has defined their mission as:
Consuming nutrient-dense foods and limiting portion sizes of food will contribute to weight management. Avoiding excessive amounts of anything allows room for many food types in the diet. © Dreamstime
Healthy People 2020 has set key recommendations as follows:
Tools for Change
If you wait many hours between meals, there is a good chance you will overeat. To refrain from overeating try consuming small meals at frequent intervals throughout the day as opposed to two or three large meals. Eat until you are satisfied, not until you feel “stuffed.” Eating slowly and savoring your food allows you to both enjoy what you eat and have time to realize that you are full before you get overfull. Your stomach is about the size of your fist but it expands if you eat excessive amounts of food at one sitting. Eating smaller meals will diminish the size of your appetite over time so you will feel satisfied with smaller amounts of food.
Benefits of Following the Healthy People 2020 Goals
Nutrition and weight status are important to children’s growth and development. In addition, healthy eating habits will decrease risks for developing chronic health conditions such as obesity, malnutrition, anemia, cardiovascular disease, high blood pressure, dyslipidemia (poor lipid profiles), Type 2 diabetes, osteoporosis, dental disease, constipation, diverticular disease, and certain types of cancer.5
Following the 2010 Dietary Guidelines will promote nutrition, weight loss, and weight maintenance as well as the reduction of chronic disease.
© Networkgraphics
Meeting the recommended intake for energy needs by adopting a balanced eating regimen as promoted by the USDA’s My Food Plate tool will assist people in losing and maintaining weight and in improving overall health.
Objectives Related to the Healthy People 2020 Goals
Seven out of every ten deaths in the United States are caused by chronic diseases, such as heart disease, cancer, and diabetes, and three-quarters of the country’s health spending goes toward the cost of treating these diseases. Helping people lose weight, maintain a healthy weight, and prevent chronic disease by improving dietary habits requires providing education about food and nutrition, assuring access to healthier food options, and promoting the desire and ability to become physically active. Some of the Healthy People 2020 program’s related objectives are discussed below.
Guidelines for Americans, and reflect the strong scientific evidence supporting the benefits of physical activity. More than 80 percent of the current US population, from youth to adults, is not meeting these guidelines. Healthy People 2020 highlights the way that one’s level of physical activity is affected by environmental factors such as the availability of safe sidewalks, bike lanes, trails, and parks. It also highlights the legislative policies that improve access to facilities that promote physical activity. Understanding that personal, social, economic, and environmental barriers to physical activity all have a part in determining a population’s physical activity level, is an important part of being able to provide interventions that foster physical activity. Consistent physical activity is necessary for preventing chronic disease, improving bone health, decreasing body fat, and preventing an early death.
Required Video 14.4
Active versus Sedentary Lifestyles. http://www.youtube.com/v/2oDi1n4Cdso
chronic diseases are linked to unhealthy dietary patterns. Excessive consumption of SoFAS, in combination with the lack of plant-based foods, may contribute to higher rates of developing chronic diseases.
Healthy children will lead to a healthy adult population with less disease, lower healthcare costs, and increased longevity. © Shutterstock
For more information on Healthy People 2020 and its related objectives for nutrition and weight status, please visit the website http://www.healthypeople.gov/2020.
References & Links
1US Department of Health and Human Services. “About Healthy People.” Last updated March 29, 2012. http://www.healthypeople.gov/2020/about/default.aspx
2World Health Organization. “Social Determinants of Health.” © 2012. http://www.who.int/social_determinants/en/.
3Amy Goldstein, “Hunger a Growing Problem in America, USDA Reports,” Washington Post, 17 November 2009. http://www.washingtonpost.com/wp-dyn/content/article/2009/11/16/AR2009111601598.html.
4US Department of Health and Human Services. “Nutrition and Weight Status.” HealthyPeople.gov. Last updated May 1, 2012. http://healthypeople.gov/2020/topicsobjectives2020/overview.aspx?topicid=29
5National Digestive Disease Information Clearinghouse, a service of National Institute of Diabetes and Digestive and Kidney Diseases, National Institutes of Health. “Am I at Risk for Type 2 Diabetes?” NIH Publication No. 09-4805 (November 2008). Last updated December 6, 2011. http://diabetes.niddk.nih.gov/dm/pubs/riskfortype2/.
6Adhikari, B. et al. “Smoking-Attributable Mortality, Years of Potential Life Lost, and Productivity Losses—United States, 2000–2004.” MMWR CDC Surveill Summ 57, no. 45 (November 14, 2008): 1226–8. http://www.cdc.gov/mmwr/preview/mmwrhtml/mm5745a3.htm.
Video Links
Preparing for the Next Decade: A 2020 Vision for Healthy People. http://www.youtube.com/v/zZG94c7xQmE Determinants of Health Approach in Healthy People 2020. http://www.youtube.com/v/5Lul6KNIw_8
Active versus Sedentary Lifestyles. http://www.youtube.com/v/2oDi1n4Cdso
Recommendations for Optimal Health
For many years, the US government has been encouraging Americans to develop healthful dietary habits. In 1992, the food pyramid was introduced, and in 2005 it was updated. This was the symbol of healthy eating patterns for all Americans. However, some felt it was difficult to understand, so in 2011, the pyramid was replaced with ChooseMyPlate.
The ChooseMyPlate program uses a tailored approach to give people the needed information to help design a healthy diet. The plate is divided according to the amount of food and nutrients you should consume for each meal. Each food group is identified with a different color, showing the food variety that all plates must have. Aside from educating people about the type of food that is best to support optimal health, the new food plan offers the advice that it is okay to enjoy food, just eat less of it.1
Required Video 14.5
Introducing the New Food Icon: MyPlate http://www.youtube.com/v/SEFmSk08LIE
Building a Healthy Plate: Choose Nutrient-Rich Foods
Planning a healthy diet using the MyPlate approach is not difficult. According to the icon, half of your plate should have fruits and vegetables, one-quarter should have whole grains, and one- quarter should have protein. Dairy products should be low-fat or non-fat. The ideal diet gives you the most nutrients within the fewest calories. This means choosing nutrient-rich foods.
Fill half of your plate with red, orange, and dark green vegetables and fruits, such as kale, collard greens, tomatoes, sweet potatoes, broccoli, apples, oranges, grapes, bananas, blueberries, and strawberries in main and side dishes. Vary your choices to get the benefit of as many different vegetables and fruits as you can. You may choose to drink fruit juice as a replacement for eating fruit. (As long as the juice is 100 percent fruit juice and only half your fruit intake is replaced with juice, this is an acceptable exchange.) For snacks, eat fruits, vegetables, or unsalted nuts.
Fill a quarter of your plate with whole grains such as 100 percent whole-grain cereals, breads, crackers, rice, and pasta. Half of your daily grain intake should be whole grains. Read the ingredients list on food labels carefully to determine if a food is comprised of whole grains.
Identify which vegetables and fruits are in season and local to your area. By consuming in- season, local foods you cut down on transportation costs (emission and financial) and you are likely to get fresher produce. You also support your local farms by purchasing their produce.
Make sure at least half of your daily grain intake comes from whole-grain foods. © Shutterstock
Select a variety of protein foods to improve nutrient intake and promote health benefits. Each week, be sure to include a nice array of protein sources in your diet, such as nuts, seeds, beans, legumes, poultry, soy, and seafood. The recommended consumption amount for seafood for adults is two 4-ounce servings per week. When choosing meat, select lean cuts. Be conscious to prepare meats using little or no added saturated fat, such as butter.
Remember to vary your selections of protein. Lentils contain good amounts of protein and make great meals. Try using lentils or beans as a meat substitute each week. © Thinkstock
If you enjoy drinking milk or eating milk products, such as cheese and yogurt, choose low-fat or nonfat products. Low-fat and nonfat products contain the same amount of calcium and other
essential nutrients as whole-milk products, but with much less fat and calories. Calcium, an important mineral for your body, is also available in lactose-free and fortified soy beverage and rice beverage products. You can also get calcium in vegetables and other fortified foods and beverages.
Oils are essential for your diet as they contain valuable essential fatty acids, but the type you choose and the amount you consume is important. Be sure the oil is plant-based rather than based on animal fat. You can also get oils from many types of fish, as well as avocados, and unsalted nuts and seeds. Although oils are essential for health, they do contain about 120 calories per tablespoon. It is vital to balance oil consumption with total caloric intake. The Nutrition Facts label provides the information to help you make healthful decisions.
In short, substituting vegetables and fruit in place of unhealthy foods is a good way to make a nutrient-poor diet healthy again. Vegetables are full of nutrients and antioxidants that help promote good health and reduce the risk for developing chronic diseases such as stroke, heart disease, high blood pressure, Type 2 diabetes, and certain types of cancer. Regularly eating fresh fruits and vegetables will boost your overall health profile.
Discretionary Calories
When following a balanced, healthful diet with many nutrient-dense foods, you may consume enough of your daily nutrients before you reach your daily calorie limit. The remaining calories are discretionary (to be used according to your best judgment). To find out your discretionary calorie allowance, add up all the calories you consumed to achieve the recommended nutrient intakes and then subtract this number from your recommended daily caloric allowance. For example, someone who has a recommended 2,000-calorie per day diet may eat enough nutrient-dense foods to meet requirements after consuming only 1,814 calories. The remaining 186 calories are discretionary. These calories may be obtained from eating an additional piece of fruit, adding another teaspoon of olive oil on a salad or butter on a piece of bread, adding sugar or honey to cereal, or consuming an alcoholic beverage.2
The amount of discretionary calories increases with physical activity level and decreases with age. For most physically active adults, the discretionary calorie allowance is, at most, 15 percent of the recommended caloric intake. By consuming nutrient-dense foods, you afford yourself a discretionary calorie allowance.
Table 14.6 Sample Menu Plan Containing 2,000 Calories
Meal | Calories | Total Meal/Snack Calories |
Breakfast | ||
1 scrambled egg | 92 | |
with sliced mushrooms and spinach | 7 | |
½ whole-wheat muffin | 67 | |
1 tsp. margarine-like spread | 15 | |
1 orange | 65 | |
8 oz. low-sodium tomato juice | 53 | 299 |
Snack | ||
6 oz. fat-free flavored yogurt | 100 | |
with ½ c. raspberries | 32 | 132 |
Lunch | ||
1 sandwich on pumpernickel bread | 160 | |
with smoked turkey deli meat, | 30 | |
4 slices tomato | 14 | |
2 lettuce leaves | 3 | |
1 tsp. mustard | 3 | |
1 oz. baked potato chips | 110 | |
½ c. blueberries, with 1 tsp. sugar | 57 | |
8 oz. fat-free milk | 90 | 467 |
Snack | ||
1 banana | 105 | |
7 reduced-fat high-fiber crackers | 120 | 225 |
Dinner | ||
1 c. Greek salad (tomatoes, cucumbers, feta) | 150 | |
with 5 Greek olives, | 45 | |
with 1.5 tsp. olive oil | 60 | |
3 oz. grilled chicken breast | 150 | |
½ c. steamed asparagus | 20 | |
with 1 tsp. olive oil, | 40 | |
with 1 tsp. sesame seeds | 18 | |
½ c. cooked wild rice | 83 | |
with ½ c. chopped kale | 18 | |
1 whole-wheat dinner roll | 4 | |
with 1 tsp. almond butter | 33 | 691 |
Total calories from all meals and snacks = 1,814 | Discretionary calorie allowance: 186 | |
Healthy Eating Index
To assess whether the American diet is conforming to the 2010 Dietary Guidelines, the Center for Nutrition Policy and Promotion (CNPP), a division of the USDA, uses a standardized tool called the Healthy Eating Index (HEI).3 The first HEI was developed in 1995 and revised in 2006.
This tool is a simple scoring system of dietary components. The data for scoring diets is taken from national surveys of particular population subgroups, such as children from low-income families or Americans over the age of sixty-five. Diets are broken down into several food categories including milk, whole fruits, dark green and orange vegetables, whole grains, and saturated fat, and then a score is given based on the amount consumed. For example, a score of ten is given if a 2,000-kilocalorie diet includes greater than 2.6 cups of milk per day. If less than 10 percent of total calories in a diet are from saturated fat, a score of eight is given. All of the scores are added up from the different food categories and the diets are given a HEI score. Using this standardized diet-assessment tool at different times, every ten years for instance, the CNPP can determine if the eating habits of certain groups of the American population are getting better or worse. The HEI tool provides the federal government with information to make policy changes to better the diets of American people. For more information on the HEI, visit this website: http://www.cnpp.usda.gov/healthyeatingindex.htm.
References & Links
1US Department of Agriculture. Accessed July 22, 2012. http://www.choosemyplate.gov/. 2US Department of Agriculture. “MyPyramid Education Framework.” Accessed July 22, 2012. http://www.choosemyplate.gov
3US Department of Agriculture. “Healthy Eating Index.” Last modified March 14, 2012. http://www.cnpp.usda.gov/healthyeatingindex.htm.
Video Link
Introducing the New Food Icon: MyPlate. http://www.youtube.com/v/SEFmSk08LIE
Understanding Daily Reference Intakes
Dietary Reference Intakes (DRI) are the recommendation levels for specific nutrients and consist of a number of different types of recommendations. This DRI system is used in both the United States and Canada.
Daily Reference Intakes: A Brief Overview
“Dietary Reference Intakes” (DRI) is an umbrella term for four reference values:
Estimated Average Requirements (EAR)
The DRIs are not minimum or maximum nutritional requirements and are not intended to fit everybody. They are to be used as guides only for the majority of the healthy population.1 DRIs are important not only to help the average person determine whether their intake of a particular nutrient is adequate, they are also used by health-care professionals and policy makers to determine nutritional recommendations for special groups of people who may need help reaching nutritional goals. This includes people who are participating in programs such as the Special Supplemental Food Program for Women, Infants, and Children. The DRI is not appropriate for people who are ill or malnourished, even if they were healthy previously.
The DRIs are inclusive of all four reference values. © Networkgraphics
Determining Dietary Reference Intakes
Each DRI value is derived in a different way. See below for an explanation of how each is determined:
Understanding the Difference
There is a distinct difference between a requirement and a recommendation. For instance, the DRI for vitamin D is a recommended 600 international units each day. However, in order to find out your true personal requirements for vitamin D, a blood test is necessary. The blood test will provide an accurate reading from which a medical professional can gauge your required daily vitamin D amounts. This may be considerably more or less than the DRI, depending on what your level actually is.
Figure 14.1 DRI Graph2
This graph illustrates the risks of nutrient inadequacy and nutrient excess as we move from a low intake of a nutrient to a high intake. Starting on the left side of the graph, you can see that when you have a very low intake of a nutrient, your risk of nutrient deficiency is high. As your nutrient intake increases, the chances that you will be deficient in that nutrient decrease. The point at which 50 percent of the population meets their nutrient need is the EAR, and the point at which 97 to 98 percent of the population meets their needs is the RDA. The UL is the highest level at which you can consume a nutrient without it being too much—as nutrient intake increases beyond the UL, the risk of health problems resulting from that nutrient increases.
Table 14.7 AMDR Values for Adults3
Nutrient | Value (percentage of Calories) |
Fat | 20.0–35.0 |
Carbohydrate | 45.0–65.0 |
Protein | 10.0–35.0 |
Polyunsaturated fatty acids | 5.0–10.0 |
Linolenic acid | 0.6–1.2 |
Tips for Using the Dietary Reference Intakes to Plan Your Diet
You can use the DRIs to help assess and plan your diet. Keep in mind when evaluating your nutritional intake that the values established have been devised with an ample safety margin and should be used as guidance for optimal intakes. In addition, the values are meant to assess
and plan average intake over time; that is, you do not need to meet these recommendations every single day—meeting them on average over several days is sufficient.
References and Links
1Deng, S., B. J. West, and C. J. Jensen. “A Quantitative Comparison of Phytochemical Components in Global Noni Fruits and Their Commercial Products.” Food Chemistry 122, no. 1 (September 1, 2010): 267–70. http://www.sciencedirect.com/science/article/pii/S0308814610001111.
2Institute of Medicine. © 2012 National Academy of Sciences. All Rights Reserved. http://www.iom.edu
3Source: Food and Nutrition Board of the Institute of Medicine. Dietary Reference Intakes for Energy, Carbohydrate, Fiber, Fat, Fatty Acids, Cholesterol, Protein, and Amino Acids. (Washington, DC: National Academies Press, 2002).
Discovering Nutrition Facts
The Labels on Your Food
Understanding the significance of dietary guidelines and how to use DRIs in planning your nutrient intakes can make you better equipped to select the right foods the next time you go to the supermarket.
In the United States, the Nutrition Labeling and Education Act passed in 1990 and came into effect in 1994. In Canada, mandatory labeling came into effect in 2005. As a result, all packaged foods sold in the United States and Canada must have nutrition labels that accurately reflect the contents of the food products. There are several mandated nutrients and some optional ones that manufacturers or packagers include. Table 14.8 lists the mandatory and optional inclusions.
Table 2.8 Mandatory and Optional Inclusions on Nutrition Labels1
Mandatory Inclusion | Optional Inclusion |
Total Calories | Calories from saturated fats |
Calories from fat | Polyunsaturated fat |
Total fat | Monounsaturated fat |
Saturated fat | Potassium |
Cholesterol | Soluble fiber |
Total carbohydrates | Sugar alcohol |
Dietary fiber | Other carbohydrates |
Sugars | Percent of vitamin A present as beta-carotene |
Vitamins A and C | Other essential vitamins and minerals |
Calcium | |
Iron |
There are other types of information that are required by law to appear somewhere on the consumer packaging. They include:
The Nutrition Facts panel provides a wealth of information about the nutritional content of the product. The information also allows shoppers to compare products. Because the serving sizes are included on the label, you can see how much of each nutrient is in each serving to make the comparisons. Knowing how to read the label is important because of the way some foods are presented. For example, a bag of peanuts at the grocery store may seem like a healthy snack to eat on the way to class. But have a look at that label. Does it contain one serving, or multiple servings? Unless you are buying the individual serving packages, chances are the bag you picked up is at least eight servings, if not more.
According to the 2010 health and diet survey released by the FDA, 54 % of first-time buyers of a product will check the food label and will use this information to evaluate fat, calorie, vitamin, and sodium content.3 The survey also notes that more Americans are using food labels and are showing an increased awareness of the connection between diet and health. Having reliable food labels is a top priority of the FDA, which has a new initiative to prepare guidelines for the food industry to construct “front of package” labeling that will make it even easier for Americans to choose healthy foods. Stay tuned for the newest on food labeling by visiting the FDA website: http://www.fda.gov/Food/LabelingNutrition/default.htm.
Required Video 14.6
The Food Label and You http://www.fda.gov/Food/ResourcesForYou/Consumers/NFLPM/default.htm
Reading the Label
The first part of the Nutrition Facts panel gives you information on the serving size and how many servings are in the container. For example, a label on a box of crackers might tell you that
twenty crackers equals one serving and that the whole box contains 10 servings. All other values listed thereafter, from the calories to the dietary fiber, are based on this one serving. On the panel, the serving size is followed by the number of calories and then a list of selected
nutrients. You will also see “Percent Daily Value” on the right-hand side. This helps you determine if the food is a good source of a particular nutrient or not.
The Daily Value (DV) represents the recommended amount of a given nutrient based on the RDI of that nutrient in a 2,000-kilocalorie diet. The percentage of Daily Value (percent DV) represents the proportion of the total daily recommended amount that you will get from one serving of the food. For example, in the food label in Figure 14.2 "Determining Your Nutrient Allowances per Day", the percent DV of calcium for one serving of macaroni-and-cheese is 20 percent, which means that one serving of macaroni and cheese provides 20 percent of the daily recommended calcium intake. Since the DV for calcium is 1,000 milligrams, the food producer determined the percent DV for calcium by taking the calcium content in milligrams in each serving, and dividing it by 1,000 milligrams, and then multiplying it by 100 to get it into percentage format. Whether you consume 2,000 calories per day or not you can still use the percent DV as a target reference.
Figure 14.2 Determining Your Nutrient Allowances per Day.4
Generally, a percent DV of 5 is considered low and a percent DV of 20 is considered high. This means, as a general rule, for fat, saturated fat, trans fat, cholesterol, or sodium, look for foods with a low percent DV. Alternatively, when concentrating on essential mineral or vitamin intake, look for a high percent DV. To figure out your fat allowance remaining for the day after consuming one serving of macaroni-and-cheese, look at the percent DV for fat, which is 18 percent, and subtract it from 100 percent. To know this amount in grams of fat, read the footnote of the food label to find that the recommended maximum amount of fat grams to consume per day for a 2,000 kilocalories per day diet is 65 grams. Eighteen percent of sixty-five equals about 12 grams. This means that 53 grams of fat are remaining in your fat allowance.
Remember, to have a healthy diet the recommendation is to eat less than this amount of fat grams per day, especially if you want to lose weight.
Table 2.9 DVs Based on a Caloric Intake of 2,000 Calories (For Adults and Children Four or More Years of Age)5
Food Component | DV |
Total fat | 65 g |
Saturated fat | 20 g |
Cholesterol | 300 mg |
Sodium | 2,400 mg |
Potassium | 3,500 mg |
Total carbohydrate | 300 g |
Dietary fiber | 25 g |
Protein | 50 g |
Vitamin A | 5,000 IU |
Vitamin C | 60 mg |
Calcium | 1,000 mg |
Iron | 18 mg |
Vitamin D | 400 IU |
Vitamin E | 30 IU |
Vitamin K | 80 micrograms µg |
Thiamin | 1.5 mg |
Riboflavin | 1.7 mg |
Niacin | 20 mg |
Vitamin B6 | 2 mg |
Folate | 400 µg |
Vitamin B12 | 6 µg |
Biotin | 300 µg |
Pantothenic acid | 10 mg |
Phosphorus | 1,000 mg |
Iodine | 150 µg |
Magnesium | 400 mg |
Zinc | 15 mg |
Selenium | 70 µg |
Copper | 2 mg |
Manganese | 2 mg |
Chromium | 120 µg |
Molybdenum | 75 µg |
Chloride | 3,400 mg |
Of course, this is a lot of information to put on a label and some products are too small to accommodate it all. In the case of small packages, such as small containers of yogurt, candy, or fruit bars, permission has been granted to use an abbreviated version of the Nutrition Facts panel. To learn additional details about all of the information contained within the Nutrition Facts panel, see the following website: http://www.fda.gov/Food/ResourcesForYou/Consumers/NFLPM/ucm274593.htm
Required Video 14.7
How to Read Food Labels
http://videos.howstuffworks.com/fit-tv/14212-diet-doctor-how-to-read-food-labels-video.htm
Claims on Labels
In addition to mandating nutrients and ingredients that must appear on food labels, any nutrient-content claims must meet certain requirements. For example, a manufacturer cannot claim that a food is fat-free or low-fat if it is not, in reality, fat-free or low-fat. Low-fat indicates that the product has three or fewer grams of fat; low salt indicates there are fewer than 140 milligrams of sodium, and low-cholesterol indicates there are fewer than 20 milligrams of cholesterol and two grams of saturated fat. See Table 2.10 "Common Label Terms Defined" for some examples.6
Table 2.10 Common Label Terms Defined7
Term | Explanation |
Lean | Fewer than a set amount of grams of fat for that particular cut of meat |
High | Contains more than 20% of the nutrient’s DV |
Good source | Contains 10 to 19% of nutrient’s DV |
Light/lite | Contains ⅓ fewer calories or 50% less fat; if more than half of calories come from fat, then fat content must be reduced by 50% or more |
Organic | Contains 95% organic ingredients |
Health Claims
Often we hear news of a particular nutrient or food product that contributes to our health or may prevent disease. A health claim is a statement that links a particular food with a reduced risk of developing disease. As such, health claims such as “reduces heart disease,” must be evaluated by the FDA before it may appear on packaging. Prior to the passage of the NLEA
products that made such claims were categorized as drugs and not food. All health claims must be substantiated by scientific evidence in order for it to be approved and put on a food label. To avoid having companies making false claims, laws also regulate how health claims are presented on food packaging. In addition to the claim being backed up by scientific evidence, it may never claim to cure or treat the disease. For a detailed list of approved health claims, visit: http://www.fda.gov/Food/LabelingNutrition/LabelClaims/HealthClaimsMeeting SignificantScientificAgreementSSA/default.htm#Approved_Health_Claims.
Qualified Health Claims
While health claims must be backed up by hard scientific evidence, qualified health claims have supportive evidence, which is not as definitive as with health claims. The evidence may suggest that the food or nutrient is beneficial. Wording for this type of claim may look like this: “Supportive but not conclusive research shows that consumption of EPA and DHA omega-3 fatty acids may reduce the risk of coronary artery disease. One serving of [name of food] provides [X] grams of EPA and DHA omega-3 fatty acids.8
Structure/Function Claims
Some companies claim that certain foods and nutrients have benefits for health even though no scientific evidence exists. In these cases, food labels are permitted to claim that you may benefit from the food because it may boost your immune system, for example. There may not be claims of diagnosis, cures, treatment, or disease prevention, and there must be a disclaimer that the FDA has not evaluated the claim.9
Allergy Warnings
Food manufacturers are required by the FDA to list on their packages if the product contains any of the eight most common ingredients that cause food allergies. These eight common
allergens are as follows: milk, eggs, peanuts, tree nuts, fish, shellfish, soy, and wheat. The FDA does not require warnings that cross contamination may occur during packaging, however most manufacturers include this advisory as a courtesy. For instance, you may notice a label that states, “This product is manufactured in a factory that also processes peanuts.” If you have food allergies, it is best to avoid products that may have been contaminated with the allergen.
References & Links
1Source: US Food and Drug Administration. “Food Labeling Guide.” Last updated February 10, 2012. http://www.fda.gov.
2Source: US Food and Drug Administration. “Food Labeling.” http://www.fda.gov/Food/GuidanceComplianceRegulatoryInformation/GuidanceDocuments/FoodLabelingNutritio n/FoodLabelingGuide/default.htm
3Source: US Food and Drug Administration. “Survey Shows Gain in Food-Label Use, Health/Diet Awareness.” March 2, 2010. http://www.fda.gov/ForConsumers/ConsumerUpdates/ucm202611.htm#FoodLabelHighlights.
4Source: FDA. “How to Understand and Use the Nutrition Facts Panel.” Last updated February 15, 2012. http://www.fda.gov/food/labelingnutrition/consumerinformation/ucm078889.htm#dvs
5Source: US Food and Drug Administration. http://www.fda.gov/Food/GuidanceComplianceRegulatoryInformation/GuidanceDocuments/FoodLabelingNutritio n/FoodLabelingGuide/ucm064928.htm.
6US Food and Drug Administration. “Additional Requirements for Nutrient Content Claims.” Appendix B in Food Labeling Guide (October 2009). http://www.fda.gov/Food/GuidanceComplianceRegulatoryInformation/GuidanceDocuments/FoodLabelingNutritio n/FoodLabelingGuide/ucm064916.htm.
7Source: US Food and Drug Administration. “Food Labeling Guide.” Last updated February 10, 2012. http://www.fda.gov.
8US Food and Drug Administration. “FDA Announces Qualified Health Claims for Omega-3 Fatty Acids.” September 8, 2004. http://www.fda.gov/SiteIndex/ucm108351.htm.
9US Food and Drug Administration. “Claims That Can Be Made for Conventional Foods and Dietary Supplements.” September 2003. http://www.fda.gov/Food/LabelingNutrition/LabelClaims/ucm111447.htm.
Video Links
The Food Label and You: http://www.fda.gov/Food/ResourcesForYou/Consumers/NFLPM/default.htm How to Read Food Labels:
http://videos.howstuffworks.com/fit-tv/14212-diet-doctor-how-to-read-food-labels-video.htm
When Enough Is Enough
Estimating Portion Size
Have you ever heard the expression, “Your eyes were bigger than your stomach?” This means that you thought you wanted a lot more food than you could actually eat. Amounts of food can be deceiving to the eye, especially if you have nothing to compare them to. It is very easy to heap a pile of mashed potatoes on your plate, particularly if it is a big plate, and not realize that you have just helped yourself to three portions instead of one.
The food industry makes following the 2010 Dietary Guidelines a challenge. In many restaurants and eating establishments, portion sizes have increased, use of SoFAS has increased, and consequently the typical meal contains more calories than it used to. In addition, our sedentary lives make it difficult to expend enough calories during normal daily activities. In fact, more than one-third of adults are not physically active at all.
As food sizes and servings increase, it is important to limit the portions of food consumed on a regular basis.
Dietitians have come up with some good hints to help people tell how large a portion of food they really have. Some suggest using common items such as a deck of cards while others advocate using your hand as a measuring rule. See Table 14.11 "Determining Food Portions" for some examples.
Table 14.11 Determining Food Portions1
Food Product | Amount | Object Comparison | Hand Comparison |
Pasta, rice | ½ c. | Tennis ball | Cupped hand |
Fresh vegetables | 1 c. | Baseball | |
Cooked vegetables | ½ c. | Cupped hand | |
Meat, poultry, fish | 3 oz. | Deck of cards | Palm of your hand |
Milk or other beverages | 1 c. | Fist | |
Salad dressing | 1 Tbsp. | Thumb | |
Oil | 1 tsp. | Thumb tip |
Required Video 14.8
Managing a Healthy Diet: Judging Healthy Portion Sizes http://www.youtube.com/v/R3qGNNa4GEw
MyPlate Planner
Estimating portions can be done using the MyPlate Planner. Recall that the MyPlate symbol is divided according to how much of each food group should be included with each meal. Note the MyPlate Planner Methods of Use:
Carbohydrates | Meats/Proteins | Fats | Free Foods |
Choose three servings with each meal. | Choose one to three servings with each meal. | Choose one to two servings with each meal. | Use as desired. |
Examples of one serving: | Examples of one serving: | Examples of one serving: | Examples: |
Breads and Starches
|
|
cheese | Foods with less than 20 calories per serving.*
|
Fruits
|
Milk
|
References & Links
1American Cancer Society. “Controlling Portion Sizes.” Last revised January 12, 2012. http://www.cancer.org/Healthy/EatHealthyGetActive/TakeControlofYourWeight/controlling-portion-sizes
Video Links
Managing a Healthy Diet: Judging Healthy Portion Sizes: http://www.youtube.com/v/R3qGNNa4GEw
Nutrition and the Media
A motivational speaker once said, “A smart person believes half of what they read. An intelligent person knows which half to believe.” In this age of information where instant Internet access is just a click away, it is easy to be misled if you do not know where to go for reliable nutrition information. There are a few websites that can be consistently relied upon for accurate material that is updated regularly.
Using Eyes of Discernment
Right information or wrong information? How can you know?
© Shutterstock
“New study shows that margarine contributes to arterial plaque.” “Asian study reveals that two cups of coffee per day can have detrimental effects on the nervous system.” How do you react when you read news of this nature? Do you boycott margarine and coffee? When reading nutrition-related claims, articles, websites, or advertisements always remember that one study does not substantiate a fact. One study neither proves nor disproves anything. Readers who may be looking for complex answers to nutritional dilemmas can quickly misconstrue such statements and be led down a path of misinformation. Listed below are ways that you can develop discerning eyes when reading nutritional news.
come from less trustworthy sources (such as non peer-reviewed journals or websites) or that are not published.
When reading information on websites, remember the following criteria for discerning if the site is valid:
Trustworthy Sources
Now let us consider some reputable organizations and websites from which you can obtain valid nutrition information.
Organizations Active in Nutrition Policy and Research
Chapter 15: Diet and Health
From https://www.cdc.gov/chronicdisease/index.htm. Accessed on December 12, 2017
Nutritional needs for certain chronic and infectious diseases may be different from that of the normal, balanced person since many diseases are caused by lifestyle choices including poor nutrition. This chapter will address nutrition and disease, cardiovascular disease, hypertension, diabetes mellitus, cancer, and nutritional recommendations for chronic diseases.
Subsections:
Chronic Disease Overview
From https://www.cdc.gov/chronicdisease/index.htm. Accessed on December 12, 2017
According to the Centers for Disease Control, chronic diseases are the leading causes of death and disability in the United States. Chronic diseases and conditions—such as heart disease, stroke, cancer, type 2 diabetes, obesity, chronic lung diseases, and arthritis—are among the most common, costly, and preventable of all health problems.
Chronic diseases and conditions—such as heart disease, stroke, cancer, type 2 diabetes, obesity, and arthritis—are among the most common, costly, and preventable of all health problems.
Health Risk Behaviors that Cause Chronic Diseases:
Health risk behaviors are unhealthy behaviors you can change are listed below; most American adults have more than one of these risk factors:
Four of these risk factors - lack of exercise or physical activity, poor nutrition, tobacco use, and drinking too much alcohol are health risk behaviors that cause much of the illness, suffering, and early death related to chronic diseases and conditions. Consider the following statistics:
The Cost of Chronic Diseases and Health Risk Behaviors:
In the United States, chronic diseases and conditions and the health risk behaviors that cause them account for most health care costs.
$2.05 a drink, in 2010. Most of these costs were due to binge drinking and resulted from losses in workplace productivity, health care expenses, and crimes related to excessive drinking.23
References & Links
2011. http://www.cdc.gov/diabetes/pubs/pdf/ndfs_2011.pdf[PDF – 2.66 MB] Accessed
December 20, 2013.
Drinking. https://www.cdc.gov/alcohol/fact-sheets/binge-drinking.htm. Accessed June 1, 2017.
Projections. http://costprojections.cancer.gov/. Accessed December 23, 2013.
Diabetes. http://www.diabetes.org/advocacy/news-events/cost-of-diabetes.html. Accessed December 23, 2013.
Statistics. http://www.cdc.gov/arthritis/data_statistics/cost.htm. Accessed December 23, 2013.
Links
National Center for Chronic Disease Prevention and Health Promotion
Diet and Heart Disease
Adapted from https://www.cdc.gov/chronicdisease/index.htm. Accessed December 12, 2017
Heart disease is the leading cause of death in the United States, killing more than 600,000 people each year.1
Heart disease is the leading cause of death in the United States for both men and women and for people of most ethnicities in the United States, including whites, African Americans, and Hispanics1. For American Indians or Alaska Natives and Asians or Pacific Islanders, heart disease is second only to cancer. Approximately 610,000 Americans die of heart disease each year.
That’s one in every four deaths in this country from heart disease.1
The term “heart disease” refers to several types of heart conditions. The most common type is coronary artery disease, which can cause a heart attack. Other kinds of heart disease may involve the valves in the heart, or the heart may not pump well and cause heart failure. Some people are born with heart problems that lead to heart attack.
Key Definitions:
Signs and Symptoms of Heart Attack:
Anyone can develop heart disease (including children). Heart attacks occur when plaque builds up in the arteries, causing the arteries to narrow over time. This narrowing of the arteries reduces blood flow to the heart, eventually causing a heart attack. Cells in the heart muscle that do not receive enough oxygenated blood begin to die and the more time that passes without restored blood flow, the greater the damage to the heart. Symptoms of a heart attack vary depending on the type of heart disease. For many suffering a heart attack, the first sign is chest discomfort. Some heart attack sufferers may experience several symptoms. The National Heart Attack Alert Program notes these major signs of a heart attack:
Required Web Link
Know the Signs and Symptoms of a Heart Attack
If you think that you or someone you know is having a heart attack, you should call 911 immediately.
High blood pressure, high cholesterol, and smoking are key risk factors for heart disease. About half of Americans (47%) have at least one of these three risk factors.
Several other medical conditions and lifestyle choices can also put people at a higher risk for heart disease, including:
Preventing Heart Disease:
By living a healthy lifestyle, you can help keep your blood pressure, cholesterol, and sugar normal and lower your risk for heart disease and heart attack. A healthy lifestyle includes the following:
Healthy Diet:
Choosing healthy meal and snack options can help you avoid heart disease and its complications. Be sure to eat plenty of fresh fruits and vegetables and avoid or limit all processed foods.
Eating foods low in saturated fats, trans fat, and cholesterol and high in fiber can help prevent high cholesterol. Limiting sugar in your diet can lower you blood sugar level to prevent or help control diabetes.
Healthy Weight:
Being overweight or obese increases your risk for heart disease. To determine if your weight is in a healthy range, doctors often calculate your body mass index (BMI) by your height and weight. BMI can be an accurate reflection of a person’s body fat composition for some, but for others it can be an inaccurate measurement, because those with significant muscle mass may have a higher BMI calculation because of the density of muscle versus fat (so they will have a heavier weight even if their body fat is in a healthy range). Body composition analysis (total amount of body fat versus blood, muscle, bone, organs, etc.) is a much more accurate determination of obesity.
Physical Activity:
Physical activity can help you maintain a healthy weight and lower your blood pressure, cholesterol, and sugar levels. For adults, the Surgeon General recommends 2 hours and 30 minutes of moderate-intensity exercise, like brisk walking or bicycling, every week. Children and adolescents should get 1 hour of physical activity every day.
Cigarette Smoking:
Cigarette smoking greatly increases your risk for heart disease. If you don’t smoke, don’t start. If you do smoke, quitting will lower your risk for heart disease. Your doctor can suggest ways to help you quit.
Alcohol Consumption:
Avoid drinking too much alcohol, which can raise your blood pressure. Men should have no more than two drinks per day, and women should limit their alcohol intake to no more than one drink daily.
References:
Required Web Link
Diet Can Reverse Heart Disease
Links:
Diet and High Blood Pressure
Adapted from: Zimmerman and Snow. “An Introduction to Nutrition” v. 1.0. Accessed on December 4, 2017. https://2012books.lardbucket.org/books/an-introduction-to-nutrition/
Also includes selected sections from: Lindshield, B. L. Kansas State University Human Nutrition (FNDH 400) Flexbook. Accessed on December 4, 2017. goo.gl/vOAnR
High Blood Pressure
Blood pressure is the force of blood pushing against the walls of your arteries, which carry blood from your heart to other parts of your body, and back to the heart. Blood pressure normally rises and falls throughout the day. But if it stays high for a long time, it can damage your heart and lead to health problems.
High blood pressure is a common and dangerous condition, putting you at risk for heart disease and stroke, two of the leading causes of death in in the United States.1
About 1 of every 3 American adults—or about 75 million people—have high blood pressure. Only about half (54%) of these people have their high blood pressure under control.1
High blood pressure is called the “silent killer” because it often has no warning signs or symptoms, and many people do not know they have it. That’s why it is important to check your blood pressure regularly.
The good news is that you can take steps to prevent high blood pressure or to control it if your blood pressure is already high.
Preventing High Blood Pressure:
By living a healthy lifestyle, you can help keep your blood pressure in a healthy range and lower your risk for heart disease and stroke. A healthy lifestyle includes:
References
1. National Center for Chronic Disease Prevention and Health Promotion, Division for Heart Disease and Stroke Prevention
Diet and Diabetes
From: https://www.cdc.gov/diabetes/basics/diabetes.html Accessed on December 12,2017
Also includes selected sections from: Lindshield, B. L. Kansas State University Human Nutrition (FNDH 400) Flexbook. Accessed on December 4, 2017. goo.gl/vOAnR
Diabetes:
Diabetes was previously discussed in chapter 4, so this chapter will focus on health risks associated with diabetes and how to prevent and manage diabetes.
Diabetes is a chronic disease that affects how your body turns food into energy.
Most of the food you eat is broken down into sugar (glucose) and released into your bloodstream. Your pancreas makes a hormone called insulin, which acts like a key to let the blood sugar into your body’s cells for use as energy.
If you have diabetes, your body either doesn’t make enough insulin or can’t use the insulin it makes as well as it should. When there isn’t enough insulin, or the cells stop responding to insulin, too much sugar stays in your bloodstream, which over time can cause serious health problems, such as heart disease, kidney disease, and loss of vision.
Diabetes by the Numbers
Types of Diabetes:
Required Web Link
https://www.youtube.com/wa tch?v=A7SbwIp2eek
There are three main types of diabetes: type 1, type 2, and gestational diabetes (diabetes while pregnant).
Type 1 diabetes is caused by an autoimmune reaction that stops your body from making insulin. About 5% of the people who have diabetes have this type. Symptoms of type 1 diabetes often develop quickly. It’s usually diagnosed in children, teens, and young adults. If you have type 1 diabetes, you’ll need to take insulin every day.
With Type 2 diabetes, your body doesn’t use insulin well and is unable to keep blood sugar at normal levels. Most people with diabetes have this type. It usually develops over many years and is usually diagnosed in adults (though increasingly in children, teens, and young adults due to the high rates of overweight and obesity in children). Type 2 diabetes can be prevented, delayed, and reversed with healthy lifestyle changes, such as losing weight if you’re overweight, healthy eating, and getting regular physical activity.
Gestational diabetes develops in pregnant women who have never had diabetes. If you have gestational diabetes, your baby could be at higher risk for health complications. Gestational diabetes usually goes away after your baby is born but increases your risk for type 2 diabetes later in life. Your baby is more likely to become obese as a child or teen, and more likely to develop type 2 diabetes later in life too.
Prediabetes:
In the United States, 84.1 million adults—more than 1 in 3—have prediabetes, and 90% of them don’t know they have it. Prediabetes is a serious health condition where blood sugar levels are
higher than normal, but not high enough yet to be diagnosed as diabetes. Prediabetes increases your risk for type 2 diabetes, heart disease, and stroke.
Diet for Diabetes:
Avoid foods high in saturated fats or trans fats, sugar, and artificial additives such as:
Eat more fiber found in all plant foods such as fruits, vegetables, beans, peas, legumes, and whole-grains.
Eat a variety of fruits and vegetables every day. Choose fresh, frozen, canned, or dried fruit and 100% fruit juices most of the time. Eat plenty of veggies like these:
Physical Activity:
Physical activity can help you control your blood glucose, weight, and blood pressure, as well as raise your “good” cholesterol and lower your “bad” cholesterol. It can also help prevent heart and blood flow problems, reducing your risk of heart disease and nerve damage, which are often problems for people with diabetes.
Experts recommend moderate-intensity physical activity for at least 30 minutes on 5 or more days of the week. Some examples of moderate-intensity physical activity are walking briskly, mowing the lawn, dancing, swimming, or bicycling.
References
Links
From https://www.cdc.gov/nccdphp/dnpao/index.html; https://www.cdc.gov/chronicdisease/
Also includes selected sections from: Lindshield, B. L. Kansas State University Human Nutrition (FNDH 400) Flexbook. Accessed on December 12, 2017. goo.gl/vOAnR
Cancer:
Cancer is a term used for diseases in which abnormal cells divide without control. Cancer cells can spread to other parts of the body through the blood and lymph systems. There are more than 100 kinds of cancer.
Cigarette Smoking:
Lung cancer is the leading cause of cancer death, and cigarette smoking causes almost all cases. Compared to nonsmokers, current smokers are about 25 times more likely to die from lung cancer. Smoking causes about 80% to 90% of lung cancer deaths. Smoking also causes cancer of
the mouth and throat, esophagus, stomach, colon, rectum, liver, pancreas, larynx, trachea, bronchus, kidney and renal pelvis, urinary bladder, and cervix, and causes acute myeloid leukemia. 1 2
Secondhand Smoke:
Adults who are exposed to secondhand smoke at home or at work increase their risk of developing lung cancer by 20% to 30%. Concentrations of many cancer-causing and toxic chemicals are higher in secondhand smoke than in the smoke inhaled by smokers. 3
Protecting Your Skin:
Skin cancer is the most common kind of cancer in the United States. Exposure to ultraviolet rays from the sun and tanning beds appears to be the most important environmental factor involved with developing skin cancer. To help prevent skin cancer while still having fun outdoors, protect yourself by seeking shade, applying sunscreen, and wearing sun-protective clothing, a hat, and sunglasses.
Limit Alcohol Intake:
Drinking alcohol raises the risk of some cancers. Drinking any kind of alcohol can contribute to cancers of the mouth and throat, larynx, esophagus, colon and rectum, liver, and breasts. The less alcohol you drink, the lower the risk of cancer.
Studies around the world have shown that drinking alcohol regularly increases the risk of getting mouth, voice box, and throat cancers.
A large number of studies provide strong evidence that drinking alcohol is a risk factor for primary liver cancer, and more than 100 studies have found an increased risk of breast cancer with increasing alcohol intake. The link between alcohol consumption and colorectal (colon) cancer has been reported in more than 50 studies. 4
Healthy Weight:
Research has shown that being overweight or obese substantially raises a person’s risk of getting endometrial, breast, prostate, and colorectal cancers. 4 5
Diet and Cancer Prevention:
A healthy lifestyle involves many choices. Among them, choosing a balanced diet. According to the Dietary Guidelines for Americans 2015-2020, a healthy eating plan:
References
Link
Let Food Be Your Medicine
1U.S. Department of Health and Human Services. The Health Consequences of Smoking—50 Years of Progress: A Report of the Surgeon General, 2014.
2International Agency for Research on Cancer. IARC monographs on the evaluation of
carcinogenic risks to humans: Volume 100E: Personal Habits and Indoor Combustions. Lyon, France: International Agency for Research on Cancer; 2012.
3U.S. Department of Health and Human Services. The Health Consequences of Involuntary
Exposure to Tobacco Smoke: A Report of the Surgeon General—6 Major Conclusions of the Surgeon General Report. Atlanta, GA: U.S. Department of Health and Human Services, Centers for Disease Control and Prevention, National Center for Chronic Disease Prevention and Health Promotion, Office on Smoking and Health, 2006.
4Baan R, Straif K, Grosse Y, Secretan B, El Ghissassi F, Bouvard V, Altieri A, Cogliano V; WHO International Agency for Research on Cancer Monograph Working Group. Carcinogenicity of alcoholic beverages.[PDF-58KB] Lancet Oncology 2007;8:292–293.
5National Institutes of Health, National Heart, Lung, and Blood Institute Obesity Education
Initiative. Clinical Guidelines on the Identification, Evaluation, and Treatment of Overweight and Obesity in Adults.
Links
Diet and Obesity
Adapted from:
http://www.merckmanuals.com/professional/nutritional-disorders/obesity-and-the-metabolic-syndrome/obesity. Accessed December 12, 2017.
Also contains material from https://www.cdc.gov/obesity/adult/causes.html Accessed December 12, 2017
Obesity:
Overweight and obesity have become one of America’s national epidemics. According to the National Institutes of Health, over two-thirds of American adults are overweight, and one in three is obese. Obesity puts people at risk for a host of health problems, including Type 2 diabetes, heart disease, high cholesterol, hypertension, osteoarthritis, and some forms of cancer. The more overweight a person is, the greater his or her risk of developing life- threatening complications. There is no single cause of obesity and no single way to treat it.
Obesity results from a combination of causes and contributing factors, including individual factors such as behavior and genetics. Behaviors can include dietary patterns, physical activity, inactivity, medication use, and other exposures. Additional contributing factors in our society include the food and physical activity environment, education and skills, and food marketing and promotion.
Obesity is a serious concern because it is associated with poorer mental health outcomes, reduced quality of life, and the leading causes of death in the U.S. and worldwide, including diabetes, heart disease, stroke, and some types of cancer. However, a healthy, nutritious diet is generally the first step, including consuming more fruits and vegetables, whole grains, and lean meats and dairy products.
Healthy behaviors include a healthy diet pattern and regular physical activity. Energy balance of the number of calories consumed from foods and beverages with the number of calories the body uses for activity plays a role in preventing excess weight gain. A healthy diet pattern follows the Dietary Guidelines for Americans which emphasizes eating whole grains, fruits, vegetables, lean protein, low-fat and fat-free dairy products and drinking water. The Physical Activity Guidelines for Americans recommends adults do at least 150 minutes of moderate
intensity activity or 75 minutes of vigorous intensity activity, or a combination of both, along with 2 days of strength training per week.
Having a healthy diet pattern and regular physical activity is also important for long term health benefits and prevention of chronic diseases such as Type 2 diabetes and heart disease.
Obesity is having excess body weight and is influenced by a combination of factors, which usually results in consuming more calories than the body needs. These factors may include:
The body mass index (BMI) is used to define overweight and obesity. BMI is weight (in kilograms) divided by height (in meters squared).
For Asians and some other ethnic groups, the BMIs that are considered normal and overweight are slightly lower.
BMI does not distinguish between muscle (lean) and fat tissue. Thus, based on BMI alone, some people may be labeled obese when their percentage of body fat is very low. For example, some people, such as body builders, have a high BMI because they have a large amount of muscle (which weighs more than fat), even though they have very little fat. Such people are not considered obese.
Obesity has become increasingly common throughout the world. In the United States, obesity is very common. More than one third (36.5%) of adults are obese, and more than 25% of children and adolescents are overweight or obese. Also, severe obesity has become more common.
Obesity is much easier to prevent than treat. Once people gain excess weight, the body resists losing weight. For example, when people diet or reduce the number of calories they consume, the body compensates by increasing appetite and reducing the number of calories burned during rest.
Height Weight (Pounds)
Determining Body Mass Index
0
100 | 110 | 120 | 130 | 140 | 150 | 160 | 170 | 180 | 190 | 200 | 210 | 220 | 230 | 24 | |
4'10" | 21 | 23 | 25 | 27 | 29 | 31 | 33 | 36 | 38 | 40 | 42 | 44 | 46 | 48 | 50 |
4'11" | 20 | 22 | 24 | 26 | 28 | 30 | 32 | 34 | 36 | 38 | 40 | 42 | 45 | 47 | 49 |
5'0" | 20 | 21 | 23 | 25 | 27 | 29 | 31 | 33 | 35 | 37 | 39 | 41 | 43 | 45 | 47 |
5'1" | 19 | 21 | 23 | 25 | 26 | 28 | 30 | 32 | 34 | 36 | 38 | 40 | 42 | 43 | 45 |
5'2" | 18 | 20 | 22 | 24 | 26 | 27 | 29 | 31 | 33 | 35 | 37 | 38 | 40 | 43 | 44 |
5'3" | 18 | 19 | 21 | 23 | 25 | 27 | 28 | 30 | 32 | 34 | 35 | 37 | 39 | 41 | 43 |
5'4" | 17 | 19 | 21 | 22 | 24 | 26 | 27 | 29 | 31 | 33 | 34 | 36 | 38 | 39 | 41 |
5'5" | 17 | 18 | 20 | 22 | 23 | 25 | 27 | 28 | 30 | 32 | 33 | 35 | 37 | 38 | 40 |
5'6" | 16 | 18 | 19 | 21 | 23 | 24 | 26 | 27 | 29 | 31 | 32 | 34 | 36 | 37 | 39 |
5'7" | 16 | 17 | 19 | 20 | 22 | 23 | 25 | 27 | 28 | 30 | 31 | 33 | 34 | 36 | 38 |
5'8" | 15 | 17 | 18 | 20 | 21 | 23 | 24 | 26 | 27 | 29 | 30 | 32 | 33 | 35 | 36 |
5'9" | 15 | 16 | 18 | 19 | 21 | 22 | 24 | 25 | 27 | 28 | 30 | 31 | 32 | 34 | 35 |
5'10" | 14 | 16 | 17 | 19 | 20 | 22 | 23 | 24 | 26 | 27 | 29 | 30 | 32 | 33 | 34 |
5'11" | 14 | 15 | 17 | 18 | 20 | 21 | 22 | 24 | 25 | 26 | 28 | 29 | 31 | 32 | 33 |
6'0" | 13 | 15 | 16 | 18 | 19 | 20 | 22 | 23 | 24 | 26 | 27 | 28 | 30 | 31 | 33 |
6'1" | 13 | 15 | 16 | 17 | 18 | 20 | 21 | 22 | 24 | 25 | 26 | 28 | 29 | 30 | 32 |
6'2" | 12 | 14 | 15 | 17 | 18 | 19 | 21 | 22 | 23 | 24 | 26 | 27 | 28 | 30 | 31 |
6'3" | 12 | 14 | 15 | 16 | 17 | 19 | 20 | 21 | 22 | 24 | 25 | 26 | 27 | 29 | 30 |
6'4" | 12 | 13 | 15 | 16 | 17 | 18 | 19 | 21 | 22 | 23 | 24 | 26 | 27 | 28 | 29 |
6'5" | 12 | 13 | 14 | 15 | 17 | 18 | 19 | 20 | 21 | 23 | 24 | 25 | 26 | 27 | 29 |
6'6" | 12 | 13 | 14 | 15 | 16 | 17 | 19 | 20 | 21 | 22 | 23 | 24 | 25 | 27 | 28 |
Categories of weight are defined as follows:
| |||||||||||||||
Height Weight (Pounds)
- Overweight = 25 to 29.9 (23 to 29.9 for Asians)
- Obese = 30 to 39.9
- Obese, severe (morbid obesity) = 40 or higher
Figure 15.1
Causes
Obesity results from a combination of factors, including the reduced opportunity for physical activity, the increased availability of high-calorie foods, and the presence of genes that make obesity more likely. But ultimately, obesity results from consuming more calories than the body needs over a long period of time.
Excess calories are stored in the body as fat (adipose tissue). The number of calories needed varies from person to person, depending on age, sex, activity level, and metabolic rate. A person’s resting (basal) metabolic rate—the amount of calories the body burns while at rest—is determined by the amount of muscle (lean) tissue a person has and the person's total body weight. The more muscle people have, the higher their metabolic rate.
Changes in the bacteria that are normally present in the digestive system (called gut flora) may increase the risk of obesity. Normally, these bacteria help the body by helping it digest food (among other things). Changes in the number and types of bacteria in the digestive system may change how the body processes food.
Physical inactivity
In developed countries, lack of physical activity is common and contributes to the increase in obesity. Opportunities for physical activity have been engineered away by technological advances, such as elevators, cars, and remote controls. More time is spent doing sedentary activities, such as using the computer, watching television, and playing video games. Also, people’s jobs have become more sedentary as office or desk jobs have replaced manual labor. Sedentary people use fewer calories than more active people and thus require fewer calories in the diet. If caloric intake is not reduced accordingly, people gain weight.
Diet
The diet in developed countries is energy dense. That is, it consists of foods that have a large number of calories in a relatively small amount (volume). Most of these foods contain more processed carbohydrates, more fat, and less fiber. Fats, by nature, are energy dense. Fat has 9 calories per gram, but carbohydrates and proteins have 4 calories per gram.
Convenience foods, such as energy-dense snacks offered at vending machines and fast food restaurants, contribute to the increase in obesity. High-calorie beverages, including soda, juices, many coffee drinks, and alcohol, also contribute significantly. For example, a 12-ounce soda or bottle of beer has 150 calories, and a 12-ounce coffee beverage (containing dairy and sugar) or fruit smoothie can have 500 or more calories. High-fructose corn syrup (used to sweeten many bottled beverages) is often singled out as being particularly likely to cause obesity. Larger portion sizes at restaurants and in packaged foods and beverages encourage people to overeat. Also, restaurant and packaged foods are often prepared in ways that add calories. As a result, people may consume more calories than they realize.
Genes
Obesity tends to run in families. However, families share not only genes but also environment, and separating the two influences is difficult. Genes can affect how quickly the body burns calories at rest and during exercise. They can also affect appetite and thus how much food is consumed. Genes may have a greater effect on where body fat accumulates, particularly fat around the waist and in the abdomen, than on how much body fat accumulates.
Many genes influence weight, but each gene has only a very small effect. Obesity rarely results when only one gene is abnormal.
Rarely, mutations in the following genes result in obesity:
the ob gene prevents leptin production and results in severe obesity in a very small number of children. In these cases, administration of leptin reduces weight to a normal amount.
Certain characteristics can increase the risk of becoming overweight or obese. They include the following:
Pregnancy and menopause
Gaining weight during pregnancy is normal and necessary. However, pregnancy can be the beginning of weight problems if women do not return to their pre-pregnancy weight. About 15% of women permanently gain 20 pounds or more with each pregnancy. Having several children close together may compound the problem. Breastfeeding can help women return to their pre-pregnancy weight.
If a pregnant woman is obese or smokes, weight regulation in the child may be disturbed, contributing to weight gain during childhood and later.
After menopause, many women gain weight. This weight gain may result from reduced activity. Hormonal changes may cause fat to be redistributed and accumulate around the waist. Fat in this location increases the risk of health problem.
Aging
Obesity becomes more common as people age. As people age, body composition may change as muscle tissue decreases. The result is a higher percentage of body fat and a lower basal metabolic rate (because muscle burns more calories).
Other Lifestyle Factors
Sleep deprivation or lack of sleep (usually considered less than 6 to 8 hours per night) can result in weight gain. Sleeplessness results in hormonal changes that increase appetite and cravings for energy-dense foods.
Stopping smoking usually results in weight gain. Nicotine decreases appetite and increases the metabolic rate. When nicotine is stopped, people may eat more food, and their metabolic rate decreases, so that fewer calories are burned. As a result, body weight may increase by 5 to 10%.
Hormones
Hormonal disorders rarely cause obesity. The following are among the most common:
Drugs
Many drugs used to treat common disorders promote weight gain. These drugs include some drugs used to treat psychiatric disorders including depression, some drugs used to treat seizures, some drugs used to treat high blood pressure (antihypertensives, such as beta- blockers), corticosteroids, and some drugs used to treat diabetes mellitus.
Complications
Being obese increases the risk of many health problems. Virtually every organ system can be affected. These weight-related health problems can cause symptoms, such as shortness of breath, difficulty breathing during activity, snoring, skin abnormalities including stretch marks, and joint and back pain.
Obesity increases the risk of the following:
of insulin (called insulin resistance), abnormal levels of cholesterol and other fats in the blood, and high blood pressure
Required Web Link
Obesity and Cancer
Obstructive sleep apnea can develop if excess fat in the neck compresses the airway during sleep. Breathing stops for a few moments, as often as hundreds of times a night. This disorder is often undiagnosed. It can cause loud snoring and excessive daytime sleepiness and increases the risk of high blood pressure, abnormal heart rhythms, metabolic syndrome, heart attacks, heart failure, and strokes.
Obesity can increase the risk of early death. The more severe the obesity, the higher the risk. In the United States, 300,000 deaths a year are attributed to obesity. It is the second most common cause of preventable death (cigarette smoking is the most common).
Obesity can lead to social, economic, and psychologic problems. For example, obese people may be underemployed or unemployed, or they may have a poor body image and low self- esteem.
Diagnosis
Obesity is diagnosed by determining the BMI. However, BMI has some limitations. The BMI does not take sex and age into consideration and makes only a few adjustments based on ethnic group. For Asians and some other ethnic groups, the BMI that is considered overweight is slightly lower.
Also, the BMI does not distinguish between lean and fat tissue. Therefore, doctors may be unsure whether a high BMI is due to muscle (for example, in body builders) or excessive fat. In such cases, they determine body composition (the percentage of body fat and muscle).
Waist circumference is sometimes measured to determine obesity. This measurement helps identify and quantify abdominal (visceral) obesity, which is fat that accumulates around the
waist and in the abdomen. Abdominal obesity is much more harmful than fat that is distributed throughout the body under the skin (subcutaneous fat).
Body composition can be determined using the following:
Required Web Link
CDC: The Obesity Epidemic
Treatment
The main treatment for obesity is changes in lifestyle, which includes changes in diet, increased physical activity, and changes in behavior. Some people may also need to take drugs or to
have weight-loss (bariatric) surgery. Losing as little as 5 to 10% of body weight can help reduce the risk or severity of weight-related health problems, such as diabetes, high blood pressure, and high cholesterol levels.
Successful weight loss requires motivation and a sense of readiness. People who are most successful have realistic goals and recognize that healthy weight loss can be achieved only with lifelong lifestyle changes rather than a magic bullet or fad diet that cannot be sustained.
Seeking the support of health care practitioners such as dieticians or doctors can be beneficial. Support from family members is also crucial.
Programs that require regular contact, such as Weight Watchers, increase accountability and can increase the likelihood of success. Typically, weekly meetings are conducted by counselors and supplemented with instructional and guidance materials.
Changes in diet
Healthy, balanced eating for weight loss requires reducing the number of calories consumed and choosing a wide range of foods that provide good nutrition. Reducing the number of calories consumed by 500 to 1,000 calories a day may be expected to result in a weight loss of 1 to 2 pounds per week, which is a healthy rate of weight loss. This approach usually means consuming 1,200 to 1,500 calories a day. However, the body may adjust to the decrease in calories (for example, by decreasing the metabolic rate). Thus, weight loss may be less than expected. Still, consuming a high-fiber diet plus reducing the number of calories by about 600 calories a day and substituting some carbohydrate for protein appears to be the best way to lose weight and keep it off. Weight can be lost more rapidly with a very low- calorie diet, but such diets should be supervised by a doctor.
The following changes in diet are recommended:
Eating foods with a low glycemic and foods that contain fish oils (including deep-sea fish such as salmon and tuna) or monounsaturated fats derived from plants (such as olive oil) may reduce the risk of heart disorders and diabetes.
No-fat or low-fat dairy products, which provide vitamin D, should be included to help prevent a deficiency of this vitamin.
Using meal replacements, regularly or once in a while, can help some people lose weight and keep it off.
Physical activity
Increasing physical activity can help people lose weight in a healthy way and keep it off. Physical activity includes not only exercise (that is, structured physical activity) but also lifestyle activities, such as taking the stairs instead of the elevator, gardening, and walking instead of
driving when possible. Lifestyle activities can burn a considerable number of calories. People who do not exercise while dieting are more likely to regain the weight they lose.
To get the most benefit from exercise, people should do strength training (with weights or another form of resistance) about 3 days of the week. Strength training increases the amount of muscle tissue, which increases the metabolic rate, so that the body burns more calories when at rest.
Changes in behavior
Ultimately, for weight loss to be effective and long-lasting, people must change their behavior. Weight-loss programs that help people change their behavior are the most effective. To change behavior, people need certain skills, such as
Problem solving involves identifying and planning ahead for situations that make unhealthy eating more likely (such as going out to dinner or traveling) or that reduce the opportunity for physical activity (such as driving cross country).
To manage stress, people can learn to identify stressful situations and develop ways to manage the stress that do not involve eating—for example, by going for a walk, meditating, or taking deep breaths.
To monitor themselves, people may keep a food log, including the number of calories in the foods, and weigh themselves regularly. They may record where and when they eat, what their mood is when they eat, and who is with them. With this information, they can observe and record patterns of behavior and eating and may be able to avoid situations that lead to weight gain or unhealthy eating.
Contingency management involves providing rewards (other than food) for behavior that contributes to weight loss or maintenance. For example, if people walk more or eat less of certain foods, they may reward themselves by getting new clothes or going to a movie.
Rewards may also come from other people—for example, praise from family members or members of a support group.
To control stimuli that can trigger unhealthy eating, people can learn to identify obstacles to healthy eating and an active lifestyle. Then they can develop strategies to overcome them. For example, people may avoid going by a fast food restaurant on their way to work or not keep sweets in the house. To develop an active lifestyle, they may take up an active hobby (such as
gardening), walk more, make a habit of taking the stairs instead of elevators, or park at the far end of parking lots (resulting in a longer walk).
Internet resources, applications for mobile devices, and other technological devices may also help people develop an active lifestyle and maintain weight loss. Applications can help people set a weight-loss goal, monitor their progress, track food consumption, and record physical activity.
For people who are obese or overweight and have weight-related disorders, drugs can be useful. Drugs are most effective when used with changes in diet, increased physical activity, and structured programs that include changes in behavior.
Some weight-loss drugs are intended to be used for a short time. Others are intended to be used for a long time.
References and links
Video Links
Links:
https://www.cdc.gov/obesity/index.html
Chapter 16: Pregnancy and Nutrition
Adapted from: Zimmerman and Snow. “An Introduction to Nutrition” v. 1.0. Accessed on December 4, 2017. https://2012books.lardbucket.org/books/an-introduction-to-nutrition/s16-02-pregnancy-and-nutrition.html
It is crucial to consume healthy foods at every phase of life, beginning in the womb. Good nutrition is vital for any pregnancy and not only helps an expectant mother remain healthy, but also impacts the development of the fetus and ensures that the baby thrives in infancy and beyond. During pregnancy, a woman’s needs increase for certain nutrients more than for others. If these nutritional needs are not met, infants could suffer from low birth weight (a birth weight less than 5.5 pounds, which is 2,500 grams), among other developmental problems.
Therefore, it is crucial to make careful dietary choices.
The Early Days of Pregnancy
For medical purposes, pregnancy is measured from the first day of a woman’s last menstrual period until childbirth, and typically lasts about forty weeks. Major changes begin to occur in the earliest days, often weeks before a woman even knows that she is pregnant. During this period, adequate nutrition supports cell division, tissue differentiation, and organ development. As each week passes, new milestones are reached. Therefore, women who are trying to conceive should make proper dietary choices to ensure the delivery of a healthy baby. Fathers- to-be should also consider their eating habits. A sedentary lifestyle and a diet low in fresh fruits and vegetables may affect male fertility. Men who drink too much alcohol may also damage the quantity and quality of their sperm.
For both men and women, adopting healthy habits also boosts general well-being and makes it possible to meet the demands of parenting. 1
Tools for Change
A pregnancy may happen unexpectedly. Therefore, it is important for all women of childbearing age to get 400 micrograms of folate per day prior to pregnancy and 600 micrograms per day during pregnancy. Folate, which is also known as folic acid, is crucial for the production of DNA and RNA and the synthesis of cells. A deficiency can cause megaloblastic anemia, or the development of abnormal red blood cells, in pregnant women. It can also have a profound effect on the unborn baby. Typically, folate intake has the greatest impact during the first eight weeks of pregnancy, when the neural tube closes. The neural tube develops into the fetus’s brain, and adequate folate reduces the risk of brain abnormalities or neural tube defects, which occur in one in a thousand pregnancies in North America each year. This vital nutrient also supports the spinal cord and its protective coverings. Inadequate folic acid can result in birth defects, such as spina bifida, which is the failure of the spinal column to close. The name “folate” is derived from the Latin word folium for leaf, and leafy green vegetables such as spinach and kale are excellent sources of it. Folate is also found in legumes, liver, and oranges. Additionally, since 1998, food manufacturers have been required to add folate to cereals and other grain products. 2
Weight Gain during Pregnancy
During pregnancy, a mother’s body changes in many ways. One of the most notable and significant changes is weight gain. If a pregnant woman does not gain enough weight, her unborn baby will be at risk. Poor weight gain, especially in the third trimester, could result not only in low birth weight, but also infant mortality and intellectual disabilities. Therefore, it is vital for a pregnant woman to maintain a healthy weight, and her weight prior to pregnancy has a major effect. Infant birth weight is one of the best indicators of a baby’s future health.
Pregnant women of normal weight should gain between 25 and 35 pounds in total through the entire pregnancy. The precise amount that a mother should gain usually depends on her beginning body mass index (BMI). See Table 17.1 "Body Mass Index and Pregnancy" below for The Institute of Medicine (IOM) recommendations.
Table 17.1 Body Mass Index and Pregnancy
Pre-pregnancy BMI | Weight Category | Recommended Weight Gain |
Below 18.5 | Underweight | 28–40 lbs. |
18.5–24.9 | Normal | 25–35 lbs. |
25.0–29.9 | Overweight | 15–25 lbs. |
Above 30.0 | Obese (all classes) | 11–20 lbs. |
The weight an expectant mother gains during pregnancy is almost all lean tissue, including the placenta and fetus. Weight gain is not the only major change. A pregnant woman also will find that her breasts enlarge and that she has a tendency to retain water. 3
Starting weight below or above the normal range can lead to different complications. Pregnant women with a pre-pregnancy BMI below twenty are at a higher risk of a preterm delivery and an underweight infant. Pregnant women with a pre-pregnancy BMI above thirty have an
increased risk of the need for a cesarean section during delivery. Therefore, it is optimal to have a BMI in the normal range prior to pregnancy.
Generally, women gain 2 to 5 pounds in the first trimester. After that, it is best not to gain more than one pound per week. Some of the new weight is due to the growth of the fetus, while some is due to changes in the mother’s body that support the pregnancy. Weight gain often breaks down in the following manner: 6 to 8 pounds of fetus, 1 to 2 pounds for the placenta (which supplies nutrients to the fetus and removes waste products), 2 to 3 pounds for the amniotic sac (which contains fluids that surround and cushion the fetus), 1 to 2 pounds in the breasts, 1 to 2 pounds in the uterus, 3 to 4 pounds of maternal blood, 3 to 4 pounds maternal fluids, and 8 to 10 pounds of extra maternal fat stores that will be needed for breastfeeding and delivery. Women who are pregnant with more than one fetus are advised to gain even more weight to ensure the health of their unborn babies.
The pace of weight gain is also important. If a woman puts on weight too slowly, her physician may recommend nutrition counseling. If she gains weight too quickly, especially in the third trimester, it may be the result of edema, or swelling due to excess fluid accumulation. Rapid weight gain may also result from increased calorie consumption or a lack of exercise.
Weight Loss after Pregnancy
During labor, new mothers lose some of the weight they gained during pregnancy with the delivery of their child. In the following weeks, they continue to shed weight as they lose accumulated fluids and their blood volume returns to normal. Some studies have hypothesized that breastfeeding also helps a new mother lose some of the extra weight, although research is ongoing. 4
New mothers who gain a healthy amount of weight and participate in regular physical activity during their pregnancies also have an easier time shedding weight post-pregnancy. However, women who gain more weight than needed for a pregnancy typically retain that excess weight
as body fat. If those few pounds increase a new mother’s BMI by a unit or more, that could lead to complications such as hypertension or Type 2 diabetes in future pregnancies or later in life.
Nutritional Requirements
As a mother’s body changes, so do her nutritional needs. Pregnant women must consume more calories and nutrients in the second and third trimesters than other adult women. However, the average recommended daily caloric intake can vary depending on activity level and the mother’s normal weight. Also, pregnant women should choose a high-quality, diverse diet, consume fresh foods, and prepare nutrient-rich meals. Steaming is the best way to cook vegetables. Vitamins are destroyed by overcooking, whereas uncooked vegetables and fruits have the highest vitamin content. It is also standard for pregnant women to take prenatal supplements to ensure adequate intake of the needed micronutrients.
Energy
During the first trimester, a pregnant woman has the same energy requirements as normal and should consume the same number of calories as usual—about 1,800 calories for a woman living a sedentary lifestyle, about 2,000 calories for a woman who is moderately active, and about 2,200 for a woman who is active. However, as the pregnancy progresses, a woman must increase her caloric intake. According to the IOM, she should consume an additional 340 calories per day during the second trimester, and an additional 450 calories per day during the third trimester. This is partly due to an increase in metabolism, which rises during pregnancy and contributes to increased energy needs. A woman can easily meet these increased needs by consuming more nutrient-dense foods. For example, an additional 340 calories could include a medium-sized banana (about 100 calories), a cup of nonfat yogurt with fruit on the bottom (about 140 calories), and a slice of whole-wheat toast (about 75 calories).
Carbohydrates
The recommended daily allowance, or RDA, of carbohydrates during pregnancy is about 175 to 265 grams per day to fuel fetal brain development. The best food sources for pregnant women include whole-grain breads and cereals, brown rice, root vegetables, legumes, and fruits. These and other unrefined carbohydrates provide nutrients, phytochemicals, antioxidants, and fiber. These foods also help to build the placenta and supply energy for the growth of the unborn baby. Refined carbohydrates, such as white bread, cookies and other baked desserts, pretzels, and chips are nutritionally deficient and should be kept to a minimum.
Protein
During pregnancy, extra protein is needed for the synthesis of new maternal and fetal tissues. Protein builds muscle and other tissues, enzymes, antibodies, and hormones in both the mother and the unborn baby. Additional protein also supports increased blood volume and the production of amniotic fluid. The RDA of protein during pregnancy is 71 grams per day, which is 25 grams above the normal recommendation. However, in most instances, there is no need for a pregnant woman to make an effort to increase protein intake as long as she has a normal appetite, because even nonpregnant women in North America typically eat that much protein. Protein should be derived from healthy sources, such as lean red meat, white-meat poultry, legumes, nuts, seeds, eggs, and fish. Low-fat milk and other dairy products also provide protein, along with calcium and other nutrients.
Fat
There are no specific recommendations for fats in pregnancy, apart from following normal dietary guidelines. Fats should make up 25 to 35 percent of daily calories, and those calories should come from healthy fats, such as avocados. Foods with unhealthy fats, including French fries and other fast food, should be avoided. Also, it is not recommended for pregnant women to be on a very low-fat diet, since it would be hard to meet the needs of essential fatty acids and fat-soluble vitamins. Fatty acids are important during pregnancy because they support the baby’s brain and eye development. In particular, the brain depends on omega-3 and omega-6
fatty acids, such as the kind found in salmon and sunflower or safflower oil, for function, structure, and growth. Fats can also help the placenta grow and may help to prevent premature birth and low birth weight.
Fiber
Ideally, a pregnant woman should eat 25 to 30 grams of dietary fiber per day. There are two types of fiber, and pregnant women should consume both. Insoluble fiber acts as a natural laxative, which softens stools and speeds the elimination of waste material through the colon to avoid constipation. Sources of insoluble fiber include whole grains, fruits, vegetables, dried peas, and beans. Soluble fiber has little effect on the intestines, however it helps to lower blood-cholesterol levels and regulate blood glucose. Sources of soluble fiber include fruits, vegetables, and beans, along with oats, barley, and other fiber-filled whole grains.
Fluids
Fluid intake must also be monitored. According to the IOM, pregnant women should drink 2.3 liters (about 10 cups) of liquids per day to provide enough fluid for blood production. It is also important to drink liquids during physical activity or when it is hot and humid outside, to replace fluids lost to perspiration. The combination of a high-fiber diet and lots of liquids also helps to eliminate waste. 5
Vitamins and Minerals
Pregnancy requires certain conditionally essential nutrients, which are nutrients that are supplied only under special conditions, such as stress, illness, or aging. The daily requirements for nonpregnant women change with the onset of a pregnancy. Taking a daily prenatal supplement or multivitamin helps to meet many nutritional needs. However, most of these requirements should be fulfilled with a healthy diet. The following table compares the normal levels of required vitamins and minerals to the levels needed during pregnancy. For pregnant women, the RDA of nearly all vitamins and minerals increases.
Table 17.2 Recommended Nutrient Intakes during Pregnancy
Nutrient | Nonpregnant Women | Pregnant Women |
Vitamin A (mcg) | 700.0 | 770.0 |
Vitamin B6 (mg) | 1.5 | 1.9 |
Vitamin B12 (mcg) | 2.4 | 2.6 |
Vitamin C (mg) | 75.0 | 85.0 |
Vitamin D (mcg) | 5.0 | 5.0 |
Vitamin E (mg) | 15.0 | 15.0 |
Calcium (mg) | 1,000.0 | 1,000.0 |
Folate (mcg) | 400.0 | 600.0 |
Iron (mg) | 18.0 | 27.0 |
Magnesium (mg) | 320.0 | 360.0 |
Niacin (B3) (mg) | 14.0 | 18.0 |
Phosphorus | 700.0 | 700.0 |
Riboflavin (B2) (mg) | 1.1 | 1.4 |
Thiamine (B1) (mg) | 1.1 | 1.4 |
Zinc (mg) | 8.0 | 11.0 |
The micronutrients involved with building the skeleton—vitamin D, calcium, phosphorus, and magnesium—are crucial during pregnancy to support fetal bone development. Although the levels are the same as those for nonpregnant women, many women do not typically consume adequate amounts and should make an extra effort to meet those needs.
There is an increased need for all B vitamins during pregnancy. Adequate vitamin B6 supports the metabolism of amino acids, while more vitamin B12 is needed for the synthesis of red blood cells and DNA. Additional zinc is crucial for cell development and protein synthesis. The need for vitamin A also increases, and extra iron intake is important because of the increase in blood supply during pregnancy and to support the fetus and placenta. Iron is the one micronutrient that is almost impossible to obtain in adequate amounts from food sources only. Therefore, even if a pregnant woman consumes a healthy diet, there still is a need to take an iron
supplement, in the form of ferrous salts. Also remember that folate needs increase during pregnancy to 600 micrograms per day to prevent neural tube defects. This micronutrient is crucial for fetal development because it helps produce the extra blood a woman’s body requires during pregnancy.
For most other minerals, recommended intakes are similar to those for nonpregnant women, although it is crucial for pregnant women to make sure to meet the RDAs to reduce the risk of birth defects. In addition, pregnant mothers should avoid exceeding any recommendations.
Taking megadose supplements can lead to excessive amounts of certain micronutrients, such as vitamin A and zinc, which may produce toxic effects that can also result in birth defects.
Guide to Eating during Pregnancy
While pregnant women have an increased need for energy, vitamins, and minerals, energy increases are proportionally less than other macronutrient and micronutrient increases. So, nutrient-dense foods, which are higher in proportion of macronutrients and micronutrients relative to calories, are essential to a healthy diet. Examples of nutrient-dense foods include fruits, vegetables, whole grains, peas, beans, reduced-fat dairy, and lean meats. Pregnant women should be able to meet almost all of their increased needs via a healthy diet. However, expectant mothers should take a prenatal supplement to ensure an adequate intake of iron and folate. Here are some additional dietary guidelines for pregnant women: 6
Foods to Avoid
A number of substances can harm a growing fetus. Therefore, it is vital for women to avoid them throughout a pregnancy. Some are so detrimental that a woman should avoid them even if she suspects that she might be pregnant. For example, consumption of alcoholic beverages results in a range of abnormalities that fall under the umbrella of fetal alcohol spectrum disorders. They include learning and attention deficits, heart defects, and abnormal facial features. Alcohol enters the unborn baby via the umbilical cord and can slow fetal growth, damage the brain, or even result in miscarriage. The effects of alcohol are most severe in the first trimester, when the organs are developing. As a result, there is no safe amount of alcohol that a pregnant woman can consume. Although pregnant women in the past may have participated in behavior that was not known to be risky at the time, such as drinking alcohol or smoking cigarettes, today we know that it is best to avoid those substances completely to protect the health of the unborn baby.
Pregnant women should also limit caffeine intake, which is found not only in coffee, but also tea, colas, cocoa, chocolate, and some over-the-counter painkillers. Some studies suggest that very high amounts of caffeine have been linked to babies born with low birth weights.
The American Journal of Obstetrics and Gynecology released a report, which found that women who consume 200 milligrams or more of caffeine a day (which is the amount in 10 ounces of coffee or 25 ounces of tea) increase the risk of miscarriage. 7 Consuming large quantities of caffeine affects the pregnant mother as well, leading to irritability, anxiety, and insomnia. Most experts agree that small amounts of caffeine each day are safe (about one 8-ounce cup of coffee a day or less). 8 However, that amount should not be exceeded.
Foodborne Illness
For both mother and child, foodborne illness can cause major health problems. For example, the foodborne illness caused by the bacteria Listeria monocytogenes can cause spontaneous abortion and fetal or newborn meningitis. According to the CDC, pregnant women are twenty
times more likely to become infected with this disease, which is known as listeriosis, than nonpregnant, healthy adults. Symptoms include headaches, muscle aches, nausea, vomiting, and fever. If the infection spreads to the nervous system, it can result in a stiff neck, convulsions, or a feeling of disorientation. 9
Foods more likely to contain the bacteria are unpasteurized dairy products, especially soft cheeses, and also smoked seafood, hot dogs, paté, cold cuts, and uncooked meats. To avoid consuming contaminated foods, women who are pregnant or breastfeeding should take the following measures:
Food Contaminants
It is always important to avoid consuming contaminated food to prevent food poisoning. This is especially true during pregnancy. Heavy metal contaminants, particularly mercury, lead, and cadmium, pose risks to pregnant mothers. As a result, vegetables should be washed thoroughly or have their skins removed to avoid heavy metals.
Pregnant women can eat fish, ideally 8 to 12 ounces of different types each week. Expectant mothers are able to eat cooked shellfish such as shrimp, farm-raised fish such as salmon, and a maximum of 6 ounces of albacore, or white, tuna. However, they should avoid fish with high methyl mercury levels, such as shark, swordfish, tilefish, and king mackerel. Pregnant women should also avoid consuming raw shellfish to avoid foodborne illness. The Environmental Defense Fund eco-rates fish to provide guidelines to consumers about the safest and most
environmentally friendly choices. You can find ratings for fish and seafood at http://www.edf.org.
Physical Activity during Pregnancy
For most pregnant women, physical activity is a must and is recommended in the 2010 Dietary Guidelines for Americans. Regular exercise of moderate intensity, about thirty minutes per day most days of the week, keeps the heart and lungs healthy. It also helps to improve sleep and boosts mood and energy levels. In addition, women who exercise during pregnancy report fewer discomforts and may have an easier time losing excess weight after childbirth. Brisk walking, swimming, or an aerobics class geared toward expectant mothers are all great ways to get exercise during a pregnancy. Healthy women who already participate in vigorous activities, such as running, can continue doing so during pregnancy provided they discuss an exercise plan with their physicians.
However, pregnant women should avoid pastimes that could cause injury, such as soccer, football, and other contact sports, or activities that could lead to falls, such as horseback riding and downhill skiing. It may be best for pregnant women not to participate in certain sports, such as tennis, that require you to jump or change direction quickly. Scuba diving should also be avoided because it might result in the fetus developing decompression sickness. This potentially fatal condition results from a rapid decrease in pressure when a diver ascends too quickly. 10
Common Discomforts during Pregnancy
Pregnancy can lead to certain discomforts, from back strain to swollen ankles. Also, a pregnant woman is likely to experience constipation because increased hormone levels can slow digestion and relax muscles in the bowels. Constipation and pressure from growth of the uterus can result in hemorrhoids, which are another common discomfort. 11
Getting mild to moderate exercise and drinking enough fluids can help prevent both conditions. Also, eating a high-fiber diet softens the stools and reduces the pressure on hemorrhoids.
Heartburn can occur during the early months of pregnancy due to an increase in the hormone progesterone, and during the later months due to the expanding size of the fetus, which limits stomach contraction. Avoiding chocolate, mint, and greasy foods, and remaining upright for an hour after meals can help pregnant women avoid heartburn. In addition, it can be helpful to drink fluids between meals, instead of with food.
Other common complaints can include leg cramps and bloating. Regular exercise can help to alleviate these discomforts. A majority of pregnant women develop gastrointestinal issues, such as nausea and vomiting. Many also experience food cravings and aversions. All of these can impact a pregnant woman’s nutritional intake and it is important to protect against adverse effects.
Nausea and Vomiting
Nausea and vomiting are gastrointestinal issues that strike many pregnant women, typically in the first trimester. Nausea tends to occur more frequently than vomiting. These conditions are often referred to as “morning sickness,” although that’s something of a misnomer because nausea and vomiting can occur all day long, although it is often the worst in the first part of the day.
Increased levels of the pregnancy hormone human chorionic gonadotropin may cause nausea and vomiting, although that is speculative. Another major suspect is estrogen because levels of this hormone also rise and remain high during pregnancy. Given that a common side effect of estrogen-containing oral contraceptives is nausea this hormone likely has a role. Nausea usually subsides after sixteen weeks, possibly because the body becomes adjusted to higher estrogen levels.
It can be useful for pregnant women to keep a food diary to discover which foods trigger nausea, so they can avoid them in the future. Other tips to help avoid or treat nausea and vomiting include the following:
A severe form of nausea and vomiting is a condition known as hyperemesis gravidarum. It is marked by prolonged vomiting, which can result in dehydration and require hospitalization. This disorder is relatively rare and impacts only 0.3 to 2 percent of all pregnant women. 12
Food Cravings and Aversions
Food aversions and cravings do not have a major impact unless food choices are extremely limited. The most common food aversions are milk, meats, pork, and liver. For most women, it is not harmful to indulge in the occasional craving, such as the desire for pickles and ice cream. However, a medical disorder known as pica is willingly consuming foods with little or no nutritive value, such as dirt, clay, and laundry starch. In some places this is a culturally accepted practice. However, it can be harmful if these substances take the place of nutritious foods or contain toxins.
Complications during Pregnancy
Expectant mothers may face different complications during the course of their pregnancy. They include certain medical conditions that could greatly impact a pregnancy if left untreated, such as gestational hypertension and gestational diabetes, which have diet and nutrition implications.
Gestational Hypertension
Gestational hypertension is a condition of high blood pressure during the second half of pregnancy. Also referred to as pregnancy-induced hypertension, this condition affects about 6 to 8 percent of all pregnant women. First-time mothers are at a greater risk, along with women who have mothers or sisters who had gestational hypertension, women carrying multiple fetuses, women with a prior history of high blood pressure or kidney disease, and women who are overweight or obese when they become pregnant.
Hypertension can prevent the placenta from getting enough blood, which would result in the baby getting less oxygen and nutrients. This can result in low birth weight, although most women with gestational hypertension can still deliver a healthy baby if the condition is detected and treated early. Some risk factors can be controlled, such as diet, while others cannot, such as family history. If left untreated, gestational hypertension can lead to a serious complication called preeclampsia, which is sometimes referred to as toxemia. This disorder is marked by elevated blood pressure and protein in the urine and is associated with swelling. To prevent preeclampsia, the WHO recommends increasing calcium intake for women consuming diets low in that micronutrient, administering a low dosage of aspirin (75 milligrams), and increasing prenatal checkups. 13
Gestational Diabetes
About 4 percent of pregnant women suffer from a condition known as gestational diabetes, which is abnormal glucose tolerance during pregnancy. The body becomes resistant to the hormone insulin, which enables cells to transport glucose from the blood. Gestational diabetes is usually diagnosed around twenty-four to twenty-six weeks, although it is possible for the condition to develop later into a pregnancy. Signs and symptoms of this disease include extreme hunger, thirst, or fatigue. If blood sugar levels are not properly monitored and treated, the baby might gain too much weight and require a cesarean delivery. Diet and regular physical activity can help to manage this condition. Most patients who suffer from gestational diabetes also require daily insulin injections to boost the absorption of glucose from the bloodsteam and promote the storage of glucose in the form of glycogen in liver and muscle cells. Gestational
diabetes usually resolves after childbirth, although some women who suffer from this condition develop Type 2 diabetes later in life, particularly if they are overweight.
KE Y TAKEAWAY S
References:
1. Mayo Clinic. “Healthy Sperm: Improving Your Fertility.” © 1998–2012 Mayo Foundation for Medical Education and Research. Accessed February 21, 2012. http://www.mayoclinic.com/health/fertility/MC00023.
2. MedlinePlus, a service of the National Institutes of Health. “Folic Acid.” © 1995– 2012 Therapeutic Research Faculty, publishers of Natural Medicines Comprehensive Database, Prescriber’s Letter, Pharmacist’s Letter. Last reviewed August 7,
2011. http://www.nlm.nih.gov/medlineplus/druginfo/natural/1017.html.
2012 Baby Your Baby. http://www.babyyourbaby.org/pregnancy/during.
2009. http://www.womenshealth.gov/publications/our-publications/pregnancy-
dos -donts.pdf.
Gynecol 2008;198:279.e1-279.e8.
Association. http://www.americanpregnancy.org/pregnancycomplications/listeri
a.html.
26. http://www.nlm.nih.gov/medlineplus/magazine/issues/winter08/articles/wi nter08pg26.html
2012. http://whqlibdoc.who.int/publications/2011/9789241548335_eng.pdf.
Tables and links:
2009. http://www.iom.edu/~/media/Files/Report%20Files/2009/Weight-Gain-During- Pregnancy-Reexamining-the-Guidelines/Resource%20Page%20-
%20Weight%20Gain%20During%20Pregnancy.pdf.
Chapter 17: Nutrition: Infancy Through Adolescence
Adapted from: Zimmerman and Snow. “An Introduction to Nutrition” v. 1.0. and accessed at https://2012books.lardbucket.org/books/an-introduction-to-nutrition/
Infancy (Birth to Age One)
LEARNING OBJECTIVES
Diet and nutrition have a major impact on a child’s development from infancy into the adolescent years. A healthy diet not only affects growth, but also immunity, intellectual capabilities, and emotional well-being. One of the most important jobs of parenting is making sure that children receive an adequate amount of needed nutrients to provide a strong foundation for the rest of their lives.
The term infant is derived from the Latin word infans, which means “unable to speak.” Healthy infants grow steadily, but not always at an even pace. For example, during the first year of life, height increases by 50 percent, while weight triples. Physicians and other health professionals can use growth charts to track a baby’s development process. Because infants cannot stand, length is used instead of height to determine the rate of a child’s growth. Other important developmental measurements include head circumference and weight. All of these must be tracked and compared against standard measurements for an infant’s age. Nationally accepted growth charts are based on data collected by the National Center for Health Statistics. These charts allow for tracking trends over time and comparing with other infants among percentiles within the United States. Growth charts may provide warnings that a child has a medical problem or is malnourished. Insufficient weight or height gain during infancy may indicate a condition known as failure-to-thrive (FTT), which is characterized by poor growth. FTT can happen at any age, but in infancy, it typically occurs after six months. Some causes include poverty, lack of enough food, feeding inappropriate foods, and excessive intake of fruit juice.
Nutritional Requirements
Requirements for macronutrients and micronutrients on a per-kilogram basis are higher during infancy than at any other stage in the human life cycle. These needs are affected by the rapid cell division that occurs during growth, which requires energy and protein, along with the nutrients that are involved in DNA synthesis. During this period, children are entirely dependent on their parents or other caregivers to meet these needs. For almost all infants six months or younger, breast milk is the best source to fulfill nutritional
requirements. An infant may require feedings eight to twelve times a day or more in the beginning. After six months, infants can gradually begin to consume solid foods to help meet nutrient needs.
Energy
Energy needs relative to size are much greater in an infant than an adult. A baby’s resting metabolic rate is two times that of an adult. The RDA to meet energy needs changes as an infant matures and puts on more weight. The IOM uses a set of equations to calculate the total energy expenditure and resulting energy needs. For example, the equation for the first three months of life is (89 x weight [kg] −100) + 175 kcal.
Based on these equations, the estimated energy requirement for infants from zero to six months of age is 472 to 645 kilocalories per day for boys and 438 to 593 kilocalories per day for girls. For infants ages six to twelve months, the estimated requirement is 645 to 844 kilocalories per day for boys and 593 to 768 kilocalories per day for girls. From the age one to age two, the estimated requirement rises to 844–1,050 kilocalories per day for boys and 768–997 kilocalories per day for girls.Food and Nutrition Board, Institute of Medicine. Dietary Reference Intakes for Energy, Carbohydrate, Fiber, Fat, Fatty Acids, Cholesterol, Protein, and Amino Acids, Institute of Medicine of the National Academies (Washington, D.C.: The National Academies Press, 2005), 169–70. How often an infant wants to eat will also change over time due to growth spurts, which typically occur at about two weeks and six weeks of age, and again at about three months and six months of age.
Macronutrients
The dietary recommendations for infants are based on the nutritional content of human breast milk. Carbohydrates make up about 45 to 65 percent of the caloric content in breast milk, which amounts to a RDA of about 130 grams. Almost all of the carbohydrate in human milk is lactose, which infants digest and tolerate well. In fact, lactose intolerance is practically nonexistent in infants. Protein makes up about 5 to 20 percent of the caloric content of breast milk, which amounts to 13 grams per day. Infants have a high need for protein to support growth and development, though excess protein (which is only a concern with bottle-feeding) can cause dehydration, diarrhea, fever, and acidosis in premature infants. About 30 to 40 percent of the caloric content in breast milk is made up of fat. A high-fat diet is necessary to encourage the development of neural pathways in the brain and other parts of the body. However, saturated fats and trans fatty acids inhibit this growth. Infants who are over the age of six months, which means they are no longer exclusively breastfed, should not consume foods that are high in these types of fats.
Micronutrients
Almost all of the nutrients that infants require can be met if they consume an adequate amount of breast milk. There are a few exceptions, though. Human milk is low in vitamin D, which is needed for calcium absorption and building bone, among other things.
Therefore, breastfed children often need to take a vitamin D supplement in the form of drops. Infants at the highest risk for vitamin D deficiency are those with darker skin and no exposure to sunlight. Breast milk is also low in vitamin K, which is required for blood clotting, and deficits could lead to bleeding or hemorrhagic disease. Babies are born with limited vitamin K, so supplementation may be needed initially and some states require a vitamin K injection after birth. Also, breast milk is not high in iron, but the iron in breast milk is well absorbed by infants. After four to six months, however, an infant needs an additional source of iron other than breast milk.
Fluids
Infants have a high need for fluids, 1.5 milliliters per kilocalorie consumed compared to
1.0 milliliters per kilocalorie consumed for adults. This is because children have larger body surface area per unit of body weight and a reduced capacity for perspiration. Therefore, they are at greater risk of dehydration. However, parents or other caregivers can meet an infant’s fluid needs with breast milk or formula. As solids are introduced, parents must make sure that young children continue to drink fluids throughout the day.
Breastfeeding
After the birth of the baby, nutritional needs must be met to ensure that an infant not only survives, but thrives from infancy into childhood. Breastfeeding provides the fuel a newborn needs for rapid growth and development. As a result, the WHO recommends that breastfeeding be done exclusively for the first six months of an infant’s life. New mothers must also pay careful consideration to their own nutritional requirements to help their bodies recover in the wake of the pregnancy. This is particularly true for women who breastfeed their babies, which calls for an increased need in certain nutrients.
Lactation
Lactation is the process that makes breastfeeding possible, and is the synthesis and secretion of breast milk. Early in a woman’s pregnancy, her mammary glands begin to prepare for milk production. Hormones play a major role in this, particularly during the second and third trimesters. At that point, levels of the hormone prolactin increase to stimulate the growth of the milk duct system, which initiates and maintains milk production. Levels of the hormone oxytocin also rise to promote the release of breast milk when the infant suckles, which is known as the milk ejection reflex. However, levels of the hormone progesterone need to decrease for successful milk production, because progesterone inhibits milk secretion. Shortly after birth, the expulsion of the placenta triggers progesterone levels to fall, which activates lactation. King, J. “Contraception and Lactation: Physiology of Lactation.” Journal of Midwifery and Women’s Health 52, no. 6 (2007): 614–20. © 2007 Elsevier Science, Inc.
New mothers need to adjust their caloric and fluid intake to make breastfeeding possible. The RDA is 330 additional calories during the first six months of lactation and 400 additional calories during the second six months of lactation. The energy needed to support breastfeeding comes from both increased intake and from stored fat. For
example, during the first six months after her baby is born, the daily caloric cost for a lactating mother is 500 calories, with 330 calories derived from increased intake and 170 calories derived from maternal fat stores. This helps explain why breastfeeding may promote weight loss in new mothers. Lactating women should also drink 3.1 liters of liquids per day (about 13 cups) to maintain milk production, according to the IOM. As is the case during pregnancy, the RDA of nearly all vitamins and minerals increases for women who are breastfeeding their babies. The following table compares the recommended vitamins and minerals for lactating women to the levels for non-pregnant and pregnant women:
Recommended Nutrient Intakes during Pregnancy
Nutrient | Non-pregnant Women | Pregnant Women | Lactating Women |
Vitamin A (mcg) | 700 | 770 | 1300 |
Vitamin B6 (mg) | 1.5 | 1.9 | 2.0 |
Vitamin B12 (mcg) | 2.4 | 2.6 | 2.8 |
Vitamin C (mg) | 75 | 85 | 120 |
Vitamin D (mcg) | 5 | 5 | 5 |
Vitamin E (mg) | 15 | 15 | 19 |
Calcium (mg) | 1000 | 1000 | 1000 |
Folate (mcg) | 400 | 600 | 500 |
Iron (mg) | 18 | 27 | 9 |
Magnesium (mg) | 320 | 360 | 310 |
Niacin (mg) | 14 | 18 | 17 |
Phosphorus (mg) | 700 | 700 | 700 |
Riboflavin (mg) | 1.1 | 1.5 | 1.6 |
Thiamin (mg) | 1.1 | 1.4 | 1.4 |
Zinc (mg) | 8 | 11 | 12 |
Source: Institute of Medicine, http://www.iom.edu.
Calcium requirements do not change during breastfeeding because of more efficient absorption, which is the case during pregnancy, too. However, the reasons for this differ. During pregnancy, there is enhanced absorption within the gastrointestinal tract. During lactation, there is enhanced retention by the kidneys. The RDA for phosphorus, fluoride, and molybdenum also remains the same.
Components of Breast Milk
Human breast milk not only provides adequate nutrition for infants, it also helps to protect newborns from disease. In addition, breast milk is rich in cholesterol, which is needed for brain development. It is helpful to know the different types and components of breast milk, along with the nutrients they provide to enable an infant survive and thrive.
Colostrum
Colostrum is produced immediately after birth, prior to the start of milk production, and lasts for several days after the arrival of the baby. Colostrum is thicker than breast milk, and is yellowish or creamy in color. This protein-rich liquid fulfills an infant’s nutrient needs during those early days. Although low in volume, colostrum is packed with concentrated nutrition for newborns. This special milk is high in fat-soluble vitamins, minerals, and immunoglobulins (antibodies) that pass from the mother to the baby.
Immunoglobulins provide passive immunity for the newborn and protect the baby from bacterial and viral diseases.American Pregnancy Association. “Breastfeeding: Overview.” Last updated January 2012. http://www.americanpregnancy.org/firstyearoflife/breastfeedingoverview.htm
Transitional Milk
Two to four days after birth, colostrum is replaced by transitional milk. Transitional milk is a creamy liquid that lasts for approximately two weeks and includes high levels of fat, lactose, and water-soluble vitamins. It also contains more calories than colostrum. After a new mother begins to produce transitional milk, she typically notices a change in the volume and type of liquid secreted and an increase in the weight and size of her breasts.American Pregnancy Association. “Breastfeeding: Overview.” Last updated January 2012. http://www.americanpregnancy.org/ firstyearoflife/breastfeedingoverview.htm.
Mature Milk
Mature milk is the final fluid that a new mother produces. In most women, it begins to secrete at the end of the second week postchildbirth. There are two types of mature milk that appear during a feeding. Foremilk occurs at the beginning and includes water, vitamins, and protein. Hind-milk occurs after the initial release of milk and contains higher levels of fat, which is necessary for weight gain. Combined, these two types of milk ensure that a baby receives adequate nutrients to grow and develop properly.American Pregnancy Association. “Breastfeeding: Overview.” Last updated January 2012. http://www.americanpregnancy.org/ firstyearoflife/breastfeedingoverview.htm.
About 90 percent of mature milk is water, which helps an infant remain hydrated. The other 10 percent contains carbohydrates, proteins, and fats, which support energy and growth. Similar to cow’s milk, the main carbohydrate of mature breast milk is lactose. Breast milk contains vital fatty acids, such as docosahexaenoic acid (DHA) and arachidonic acid (ARA). In terms of protein, breast milk contains more whey than casein (which is the reverse of cow’s milk). Whey is much easier for infants to digest than casein. Complete protein, which means all of the essential amino acids, is also present in breast milk. Complete protein includes lactoferrin, an iron-gathering compound that helps to absorb iron into an infant’s bloodstream.
In addition, breast milk provides adequate vitamins and minerals. Although absolute amounts of some micronutrients are low, they are more efficiently absorbed by infants. Other essential components include digestive enzymes that help a baby digest the breast milk. Human milk also provides the hormones and growth factors that help a newborn to develop.
Diet and Milk Quality
A mother’s diet can have a major impact on milk production and quality. As during pregnancy, lactating mothers should avoid illegal substances and cigarettes. Some legal drugs and herbal products can be harmful as well, so it is helpful to discuss them with a health-care provider. Some mothers may need to avoid certain things, such as spicy foods, that can produce gas in sensitive infants. Lactating women can drink alcohol, though they must avoid breastfeeding until the alcohol has completely cleared from their milk. Typically, this takes two to three hours for 12 ounces of beer, 5 ounces of wine, or
1.5 ounces of liquor, depending on a woman’s body weight. Harms, R., MD. “Breast- Feeding and Alcohol: Is It Okay to Drink?” © 1998–2012 Mayo Foundation for Medical Education and Research. Accessed February 21, 2012. http://www.mayoclinic.com/health/breast-feeding-andalcohol/AN02131. Precautions are necessary because exposure to alcohol can disrupt an infant’s sleep schedule.
Benefits of Breastfeeding
Breastfeeding has a number of benefits, both for the mother and for the child. Breast milk contains immunoglobulins, enzymes, immune factors, and white blood cells. As a result, breastfeeding boosts the baby’s immune system and lowers the incidence of diarrhea, along with respiratory diseases, gastrointestinal problems, and ear infections. Breastfed babies also are less likely to develop asthma and allergies, and breastfeeding lowers the risk of sudden infant death syndrome. In addition, human milk encourages the growth of healthy bacteria in an infant’s intestinal tract. All of these benefits remain in place after an infant has been weaned from breast milk. Some studies suggest other possible long- term effects. For example, breast milk may improve an infant’s intelligence and protect against Type 1 diabetes and obesity, although research is ongoing in these areas.Healthy Children.org. “Breastfeeding Benefits Your Baby’s Immune System.” © 2012 American Academy of Pediatrics. Accessed February 21, 2012. http://www.healthychildren.org/English/ages-stages/baby/breastfeeding/pages/ Breastfeeding-Benefits-Your-Baby%27s-Immune-System.aspx.
Breastfeeding has a number of other important benefits. It is easier for babies to digest breast milk than bottle formula, which contains proteins made from cow’s milk that require an adjustment period for infant digestive systems. Breastfed infants are sick less often than bottle-fed infants. Breastfeeding is more sustainable and results in less plastic waste and other trash. Breastfeeding can also save families money because it does not incur the same cost as purchasing formula. Other benefits include that breast milk is always ready. It does not have to be mixed, heated, or prepared. Also, breast milk is sterile and is always at the right temperature.
In addition, the skin-to-skin contact of breastfeeding promotes a close bond between mother and baby, which is an important emotional and psychological benefit. The practice also provides health benefits for the mother. Breastfeeding helps a woman’s bones stay strong, which protects against fractures later in life. Studies have also shown that breastfeeding reduces the risk of breast and ovarian cancers.National Cancer Institute. “Reproductive History and Breast Cancer Risk.” Accessed February 6, 2012. http://www.cancer.gov/cancertopics/factsheet/Risk/ reproductive-history.
The Baby-Friendly Hospital Initiative In 1991, the WHO and UNICEF launched the Baby-Friendly Hospital Initiative (BFHI), which works to ensure that all maternities, including hospitals and freestanding facilities, become centers of breastfeeding support. A maternity can be denoted as “baby-friendly” when it does not accept substitutes to human breast milk and has implemented ten steps to support breastfeeding. These steps include having a written policy on breastfeeding communicated to health-care staff on a routine basis, informing all new mothers about the benefits and management of breastfeeding, showing new mothers how to breastfeed their infants, and how to maintain lactation, and giving newborns no food or drink other than breast milk, unless medically indicated. Since the BFHI began, more than fifteen thousand facilities in 134 countries, from Benin to Bangladesh, have been deemed “baby friendly.” As a result, more mothers are breastfeeding their newborns and infant health has improved, in both the developed world and in developing nations, United Nations Children’s Fund. “The Baby-Friendly Hospital Initiative.” Accessed June 8, 2012. http://www.unicef.org/programme/ breastfeeding/baby.htm.
Barriers to Breastfeeding
Although breast milk is ideal for almost all infants, there are some challenges that nursing mothers may face when starting and continuing to breastfeed their infants. These obstacles include painful engorgement or fullness in the breasts, sore and tender nipples, lack of comfort or confidence in public, and lack of accommodation to breastfeed or express milk in the workplace.
One of the first challenges nursing mothers face is learning the correct technique. It may take a little time for a new mother to help her baby properly latch on to her nipples.
Improper latching can result in inadequate intake, which could slow growth and development. However, International Board Certified Lactation Consultants (IBCLCs), OB nurses, and registered dietitians are all trained to help new mothers learn the proper technique. Education, the length of maternity leave, and laws to protect public breastfeeding, among other measures, can all help to facilitate breastfeeding for many lactating women and their newborns.
Contraindications to Breastfeeding
Although there are numerous benefits to breastfeeding, in some cases there are also risks that must be considered. In the developed world, a new mother with HIV should not
breastfeed, because the infection can be transmitted through breast milk. These women typically have access to bottle formula that is safe, and can be used as a replacement for breast milk. However, in developing nations where HIV infection rates are high and acceptable infant formula can be difficult to come by, many newborns would be deprived of the nutrients they need to develop and grow. Also, inappropriate or contaminated bottle formulas cause 1.5 million infant deaths each year. As a result, the WHO recommends that women infected with HIV in the developing world should nurse their infants while taking antiretroviral medications to lower the risk of transmission.World Health Organization. “Infant and Young Child Feeding.” July 2010. http://www.who.int/mediacentre/factsheets/fs342/en/ index.html
Breastfeeding also is not recommended for women undergoing radiation or chemotherapy treatment for cancer. Additionally, if an infant is diagnosed with galactosemia, meaning an inability to process the simple sugar galactose, the child must be on a galactose-free diet, which excludes breast milk. This genetic disorder is a very rare condition, however, and only affects 1 in thirty- to sixty thousand newborns.Genetics Home Reference, a service of the US National Library of Medicine. “Galactosemia.” July 9, 2012. http://ghr.nlm.nih.gov/condition/ galactosemia. When breastfeeding is contraindicated for any reason, feeding a baby formula enables parents and caregivers to meet their newborn’s nutritional needs.
Bottle-Feeding
Most women can and should breastfeed when given sufficient education and support. However, as discussed, a small percentage of women are unable to breastfeed their infants, while others choose not to. For parents who choose to bottle-feed, infant formula provides a balance of nutrients. However, not all formulas are the same and there are important considerations that parents and caregivers must weigh. Standard formulas use cow’s milk as a base. They have 20 calories per fluid ounce, similar to breast milk, with vitamins and minerals added. Soy-based formulas are usually given to infants who develop diarrhea, constipation, vomiting, colic, or abdominal pain, or to infants with a cow’s milk protein allergy. Hypoallergenic protein hydrolysate formulas are usually given to infants who are allergic to cow’s milk and soy protein. This type of formula uses hydrolyzed protein, meaning that the protein is broken down into amino acids and small peptides, which makes it easier to digest. Preterm infant formulas are given to low birth weight infants, if breast milk is unavailable. Preterm infant formulas have 24 calories per fluid ounce and are given until the infant reaches a desired weight.
Infant formula comes in three basic types:
However, it requires the least amount of preparation. Ready-to-use formulas are also convenient for traveling. Most babies need about 2.5 ounces of formula per pound of body weight each day. Therefore, the average infant should consume about 24 fluid ounces of breast milk or formula per day. When preparing formula, parents and caregivers should carefully follow the safety guidelines, since an infant has an immature immune system. All equipment used in formula preparation should be sterilized.
Prepared, unused formula should be refrigerated to prevent bacterial growth. Parents should make sure not to use contaminated water to mix formula in order to prevent foodborne illnesses. Follow the instructions for powdered and concentrated formula carefully—formula that is over-diluted would not provide adequate calories and protein, while over-concentrated formula provides too much protein and too little water which can impair kidney function.
It is important to note again that both the American Academy of Pediatrics and the WHO state that breast milk is far superior to infant formula. This table compares the advantages of giving a child breast milk to the disadvantages of using bottle formula.
Breast Milk versus Bottle Formula
Breast Milk | Bottle Formula |
Antibodies and lactoferrin in breast milk protect infants. | Formula does not contain immunoprotective factors. |
The iron in breast milk is absorbed more easily. | Formula contains more iron than breast milk, but it is not absorbed as easily. |
The feces that babies produce do not smell because breastfed infants have different bacteria in the gut. | The feces that bottle-fed infants produce tends to have a foul-smelling odor. |
Breast milk is always available and is always at the correct temperature. | Formula must be prepared, refrigerated for storage, and warmed before it is given to an infant. |
Breastfed infants are less likely to have constipation. | Bottle-fed infants are more likely to have constipation. |
Breastfeeding ostensibly is free, though purchasing a pump and bottles to express milk does require some expense. | Formula must be purchased and is expensive. |
Breast milk contains the fatty acids DHA and ARA, which are vital for brain and vision development. | Some formulas contain DHA and ALA. |
Source: American Pregnancy Association. “Breastfeeding versus Bottle Feeding.” November 5, 2012. http://www.americanpregnancy.org/firstyearoflife/ breastfeedingandbottle.html. V
Introducing Solid Foods
Infants should be breastfed or bottle-fed exclusively for the first six months of life according to the WHO. (The American Academy of Pediatrics recommends breast milk or bottle formula exclusively for at least the first four months, but ideally for six
months.). Infants should not consume solid foods prior to six months because solids do not contain the right nutrient mix that infants need. Also, eating solids may mean drinking less breast milk or bottle formula. If that occurs, an infant may not consume the right quantities of various nutrients. If parents try to feed an infant who is too young or is not ready, their tongue will push the food out, which is called an extrusion reflex. After six months, the suck-swallow reflexes are not as strong, and infants can hold up their heads and move them around, both of which make eating solid foods more feasible.
Solid baby foods can be bought commercially or prepared from regular food using a food processor, blender, food mill, or grinder at home. Usually, an infant cereal can be offered from a spoon between four to six months. By nine months to a year,
infants are able to chew soft foods and can eat solids that are well chopped or mashed. Infants who are fed solid foods too soon are susceptible to developing food allergies.
Therefore, as parents and caregivers introduce solids, they should feed their child only one new food at a time (starting with rice cereal, followed by fruits or vegetables), to help identify allergic responses or food intolerances. An iron supplement or iron-fortified cereal is also recommended at this time.
Learning to Self-Feed
With the introduction of solid foods, young children begin to learn how to handle food and how to feed themselves. At six to seven months, infants can use their whole hand to pick up items (this is known as the palmer grasp). They can lift larger items, but picking up smaller pieces of food is difficult. At eight months, a child might be able to use a pincer grasp, which uses fingers to pick up objects. After the age of one, children slowly begin to use utensils to handle their food. Unbreakable dishes and cups are essential, since very young children may play with them or throw them when they become bored with their food.
Feeding Problems during Infancy
Parents and caregivers should be mindful of certain diet-related problems that may arise during infancy. Certain foods are choking hazards, including foods with skins or foods that are very small, such as grapes. Other examples of potential choking hazards include raw carrots and apples, raisins, and hard candy. Parents should also avoid adding salt or seasonings to an infant’s food.
Heating an infant’s food presents a risk of accidental injury or burns, which may occur if the food is heated unevenly or excessively. Keep in mind that an infant cannot communicate that the food is too hot. Also, parents and caregivers should never leave a baby alone at mealtime, because an infant can accidentally choke on pieces of food that are too big or have not been adequately chewed. Raw honey and corn syrup both contain spores of Clostridium botulinum. They produce a poisonous toxin in a baby’s intestines, which can cause the foodborne illness botulism. After the age of one, it is safe to give an
infant honey or corn syrup. However, honey as an ingredient in food, such as in cereal, is safe for all ages because it has been adequately heat-treated.
Overnutrition
Overnutrition during infancy is a growing problem. Overfed infants may develop dietary habits and metabolic characteristics that last a lifetime. According to the American Journal of Clinical Nutrition, the consequences of overnutrition and growth acceleration in infancy include long-term obesity, along with Type 2 diabetes and cardiovascular disease later in life.Singhal, A. et al. “Nutrition in Infancy and LongTerm Risk of Obesity: Evidence from Two Randomized Control Trials.” Am J Clin Nutr 92 (2010): 1133–44. Therefore, parents and other caregivers should restrain from overfeeding, and ideally give their infants breast milk to promote health and wellbeing.
Food Allergies
Food allergies impact four to six percent of young children in America. Common food allergens that can appear just before or after the first year include peanut butter, egg whites, wheat, cow’s milk, and nuts. For infants, even a small amount of a dangerous food can prove to be life-threatening. If there is a family history of food allergies, it is a good idea to delay giving a child dairy products until one year of age, eggs until two years of age, and shellfish, fish, and nuts until three years of age.
However, lactating women should not make any changes to their diets. Research shows that nursing mothers who attempt to ward off allergies in their infants by eliminating certain foods may do more harm than good. According to the American Academy of Allergy, Asthma, and Immunology, mothers who avoided certain dairy products showed decreased levels in their breast milk of an immunoglobulin specific to cow’s milk. This antibody is thought to protect against the development of allergies in children. Even when an infant is at higher risk for food allergies, there is no evidence that alterations in a mother’s diet make a difference.Gever, J. “Nursing Mom’s Diet No Guard Against Baby Allergies.” Medpage Today. © 2012 Everyday Health, Inc. March 7, 2012. http://www.medpagetoday.com/ MeetingCoverage/AAAAIMeeting/31527?utm_content=&utm_medium=email&utm
_campaign=DailyHeadlines&utm_source=WC&eun=g330425d0r&userid=330425& email=mzimmerman@cox.netµ_id=.
Early Childhood Caries
Primary teeth are at risk for a disorder known as early childhood caries15 from breast milk, formula, juice, or other drinks fed through a bottle. Liquids can build up in a baby’s mouth, and the natural or added sugars lead to decay. Early childhood caries is caused not only by the kinds of liquids given to an infant, but also by the frequency and length of time that fluids are given. Giving a child a bottle of juice or other sweet liquids several
times each day, or letting a baby suck on a bottle longer than a mealtime, either when awake or asleep, can also cause early childhood caries. In addition, this practice affects the development and position of the teeth and the jaw. The risk of early childhood caries continues into the toddler years as children begin to consume more foods with a high sugar content. Therefore, parents should avoid giving their children sugary snacks and beverages.
Gastroesophageal Reflux
Small amounts of spitting up during a feeding is normal. However, there is cause for concern if it is too difficult to feed an infant due to gastroesophageal reflux16. This condition occurs when stomach muscles open at the wrong times and allow milk or food to back up into the esophagus. Symptoms of gastroesophagel reflux in infants include severe spitting up, projectile vomiting, arching of the back as though in pain, refusal to eat or pulling away from the breast during feedings, gagging or problems with swallowing, and slow weight gain. For most infants, making adjustments in feeding practices addresses the issue. For example, a parent can feed their baby in an upright position, wait at least an hour after eating for play time, burp more often, or give a child smaller, more frequent feedings.
Diarrhea and Constipation
Diarrhea is often caused by a gastrointestinal infection and can dehydrate an infant. It is characterized by stool frequency and consistency that deviates substantially from the norm. If an infant has had several bouts of this condition, they will need to replace lost fluids and electrolytes. A common recommendation is to give a child an oral rehydration solution. Because of the immunoprotective factors in breast milk, breastfed infants are less likely to contract gastrointestinal viral illness and experience diarrhea.
Infant constipation—which is the passage of hard, dry bowel movements, but not necessarily the absence of daily bowel movements—is another common problem. This condition frequently begins when a baby transitions from breast milk to formula or begins eating solid foods. Pediatricians can provide the best guidance for handling the problem. Common recommendations include applying a small amount of water-based lubricant to an infant’s anus to ease the passage of hard stools, and feeding an infant on solid foods pureed pears or prunes, or providing barley cereal in place of rice cereal.Mayo Clinic. “Infant and Toddler Health.” March 16, 2011. © 1998–2012 Mayo Foundation for Medical Education and Research. http://www.mayoclinic.com/health/infant-and-toddler-health/MY00362. Parents can also offer their child a little more water in between feedings to help alleviate the condition.
Colic
Colic is a common problem during infancy, characterized by crankiness and crying jags. It is defined as crying that lasts longer than three hours per day for at least three days per week and for at least three weeks (which is commonly known as the “rule of 3’s”), and is
not caused by a medical problem. About one-fifth of all infants develop colic, usually between the second and third weeks. Crying spells can occur around the clock, but often worsen in the early evening. Also, colicky babies may have stomachs that are enlarged or distended with gas.
There is no definitive explanation for colic. Often, colic occurs when a child is unusually sensitive to stimulation. In breastfeeding babies, colic can be a sign of sensitivity to the mother’s diet. Lactating mothers can try to eliminate caffeine, chocolate, and any other potentially irritating foods from their meals.Medline Plus, a service of the US National Library of Medicine. “Colic and Crying.” Last updated August 2, 2011. http://www.nlm.nih.gov/medlineplus/ency/article/000978.htm. However, since colic usually subsides over time, any improvement that occurs with food elimination may conincide with the natural healing process.
Parents and caregivers who are feeding bottle formula to colicky babies should talk with pediatricians about replacing it with a protein hydrolysate formula.American Academy of Pediatrics. “Colic.” HealthyChildren.org. © American Academy of Pediatrics. Last updated May 12, 2011. http://www.healthychildren.org/English/ ages-stages/baby/crying- colic/pages/Colic.aspx. Whether breastfeeding or bottlefeeding, it is also important not to overfeed infants, which could make them uncomfortable and more likely to have crying fits. In general, it is best to wait between two and three hours from the start of one feeding to the start of the next. If food sensitivity is the cause, colic should cease within a few days of making changes. Eventually, the problem goes away. Symptoms usually begin to dissipate after six weeks and are gone by twelve weeks.Medline Plus, a service of the US National Library of Medicine. “Colic and Crying.” Last updated August 2, 2011. http://www.nlm.nih.gov/medlineplus/ency/article/000978.htm.
Newborn Jaundice Newborn jaundice is another potential problem during infancy. This condition can occur within a few days of birth and is characterized by yellowed skin or yellowing in the whites of the eyes, which can be harder to detect in dark-skinned babies. Jaundice typically appears on the face first, followed by the chest, abdomen, arms, and legs. This disorder is caused by elevated levels of bilirubin in a baby’s bloodstream.
Bilirubin is a substance created by the breakdown of red blood cells and is removed by the liver. Jaundice develops when a newborn’s liver does not efficiently remove bilirubin from the blood. There are several types of jaundice associated with newborns:
Newborn jaundice is more common in a breastfed baby and tends to last a bit longer. If jaundice is suspected, a pediatrician will run blood tests to measure the amount of bilirubin in an infant’s blood. Treatment often involves increasing the number of feedings to increase bowel movements, which helps to excrete bilirubin. Within a few weeks, as the baby begins to mature and red blood cell levels diminish, jaundice typically subsides with no lingering effects.American Pregnancy Association. “Breastfeeding and Jaundice.” © 2000–2012 American Pregnancy Association. Accessed February 21, 2012. http://www.americanpregnancy.org/ firstyearoflife/breastfeedingandjaundice.htm.
Nutrition in the Toddler Years
LEARNING OBJECTIVES
By the age of two, children have advanced from infancy and are on their way to becoming school-aged children. Their physical growth and motor development slows compared to the progress they made as infants. However, toddlers experience enormous intellectual, emotional, and social changes. Of course, food and nutrition continue to play an important role in a child’s development. During this stage, the diet completely shifts from breastfeeding or bottle-feeding to solid foods along with healthy juices and other liquids. Parents of toddlers also need to be mindful of certain nutrition-related issues that may crop up during this stage of the human life cycle. For example, fluid requirements relative to body size are higher in toddlers than in adults because children are at greater risk of dehydration. Toddlers should drink about 1.3 liters of fluids per day, ideally liquids that are low in sugar.
The Toddler Years (Ages Two to Three)
During this phase of human development, children are mobile and grow more slowly than infants, but are much more active. The toddler years pose interesting challenges for parents or other caregivers, as children learn how to eat on their own and begin to develop personal preferences. However, with the proper diet and guidance, toddlers can continue to grow and develop at a healthy rate.
Nutritional Requirements
MyPlate may be used as a guide for the toddler’s diet (http://www.choosemyplate.gov/preschoolers.html). A toddler’s serving sizes should be
approximately one-quarter that of an adult’s. One way to estimate serving sizes for young children is one tablespoon for each year of life. For example, a two-year-old child would be served 2 tablespoons of fruits or vegetables at a meal, while a four-year-old would be given 4 tablespoons, or a quarter cup. Here is an example of a toddler-sized meal:
Energy
The energy requirements for ages two to three are about 1,000 to 1,400 calories a day. In general, a toddler needs to consume about 40 calories for every inch of height. For example, a young child who measures 32 inches should take in an average of 1,300 calories a day. However, the recommended caloric intake varies with each child’s level of activity. Toddlers require small, frequent, nutritious snacks and meals to satisfy energy requirements. The amount of food a toddler needs from each food group depends on daily calorie needs. See the following table for some examples:
Serving Sizes for Toddlers
Food Group | Daily Serving | Examples |
Grains | About 3 ounces of grains per day, ideally whole grains |
pasta |
Proteins | 2 ounces of meat, poultry, fish, eggs, or legumes |
cup of cooked beans |
Fruits | 1 cup of fresh, frozen, canned, and/or dried fruits, or 100 percent fruit juice |
|
Vegetables | 1 cup of raw and/or cooked vegetables |
or tomato sauce) |
Dairy Products | 2 cups per day |
plus 1 cup of yogurt |
Source: Academy of Nutrition and Dietetics. “It‘s about Eating Right: Size-Wise Nutrition for Toddlers.” © 1995–2012, Academy of Nutrition and Dietetics, all rights reserved. http://www.eatright.org/public/content.aspx?id=8055.
Macronutrients
For carbohydrate intake, the Acceptable Macronutrient Distribution Range (AMDR) is 45 to 65 percent of daily calories (113 to 163 grams for 1,000 daily calories). Toddlers’ needs increase to support their body and brain development. Brightlycolored unrefined carbohydrates, such as peas, orange slices, tomatoes, and bananas are not only nutrient- dense, they also make a plate look more appetizing and appealing to a young child. The RDA of protein is 5 to 20 percent of daily calories (13 to 50 grams for 1,000 daily calories). The AMDR for fat for toddlers is 30 to 40 percent of daily calories (33 to 44 grams for 1,000 daily calories). Essential fatty acids are vital for the development of the eyes, along with nerve and other types of tissue. However, toddlers should not consume foods with high amounts of trans fats and saturated fats. Instead, young children require the equivalent of 3 teaspoons of healthy oils, such as canola oil, each day.
Micronutrients
As a child grows bigger, the demands for micronutrients increase. These needs for vitamins and minerals can be met with a balanced diet, with a few exceptions. As toddlers mature, they become more comfortable handling dishes and utensils. © Thinkstock According to the American Academy of Pediatrics, toddlers and children of all ages need 600 international units of vitamin D per day. Vitamin D-fortified milk and cereals can help to meet this need. However, toddlers who do not get enough of this micronutrient should receive a supplement. Pediatricians may also prescribe a fluoride supplement for toddlers who live in areas with fluoride-poor water. Iron deficiency is also a major concern for children between the ages of two and three. You will learn about
iron-deficiency anemia later in this section.
Learning How to Handle Food
As children grow older, they enjoy taking care of themselves, which includes self- feeding. During this phase, it is important to offer children foods that they can handle on their own and that help them avoid choking and other hazards. Examples include fresh fruits that have been sliced into pieces, orange or grapefruit sections, peas or potatoes that have been mashed for safety, a cup of yogurt, and whole-grain bread or bagels cut into pieces. Even with careful preparation and training, the learning process can be messy. As a result, parents and other caregivers can help children learn how to feed themselves by providing the following:
Feeding Problems in the Toddler Years
During the toddler years, parents may face a number of problems related to food and nutrition. Possible obstacles include difficulty helping a young child overcome a fear of new foods, or fights over messy habits at the dinner table. Even in the face of problems and confrontations, parents and other caregivers must make sure their preschooler has nutritious choices at every meal. For example, even if a child stubbornly resists eating vegetables, parents should continue to provide them. Before long, the child may change their mind, and develop a taste for foods once abhorred. It is important to remember this is the time to establish or reinforce healthy habits.
Nutritionist Ellyn Satter states that feeding is a responsibility that is split between parent and child. According to Satter, parents are responsible for what their infants eat, while infants are responsible for how much they eat. In the toddler years and beyond, parents are responsible for what children eat, when they eat, and where they eat, while children are responsible for how much food they eat and whether they eat. Satter states that the role of a parent or a caregiver in feeding includes the following:
High-Risk Choking
Foods Certain foods are difficult for toddlers to manage and pose a high risk of choking. Big chunks of food should not be given to children under the age of four. Also, globs of peanut butter can stick to a younger child’s palate and choke them. Popcorn and nuts should be avoided as well, because toddlers are not able to grind food and reduce it to a consistency that is safe for swallowing. Certain raw vegetables, such as baby carrots, whole cherry tomatoes, whole green beans, and celery are also serious choking hazards. However, there is no reason that a toddler cannot enjoy well-cooked vegetables cut into bite-size pieces.
Picky Eaters
The parents of toddlers are likely to notice a sharp drop in their child’s appetite. Children at this stage are often picky about what they want to eat. They may turn their heads away after eating just a few bites. Or, they may resist coming to the table at mealtimes. They also can be unpredictable about what they want to consume for specific meals or at particular times of the day. Although it may seem as if toddlers should increase their food intake to match their level of activity, there is a good reason for picky eating. A child’s
growth rate slows after infancy, and toddlers ages two and three do not require as much food.
Food Jags
For weeks, toddlers may go on a food jag and eat one or two preferred foods—and nothing else. It is important to understand that preferences will be inconsistent as a toddler develops eating habits. This is one way that young children can assert their individuality and independence. However, parents and caregivers should be concerned if the same food jag persists for several months, instead of several weeks. Options for addressing this problem include rotating acceptable foods while continuing to offer diverse foods, remaining low-key to avoid exacerbating the problem, and discussing the issue with a pediatrician. Also, children should not be forced to eat foods that they do not want. It is important to remember that food jags do not have a long-term effect on a toddler’s health, and are usually temporary situations that will resolve themselves.
Toddler Obesity
Another potential problem during the early childhood years is toddler obesity. According to the US Department of Health and Human Services, in the past thirty years, obesity rates have more than doubled for all children, including infants and toddlers.Head Start, US Department of Health and Human Services. “Prevention of Overweight and Obesity in Infants and Toddlers.” 2005. Accessed February 21, 2012. http://eclkc.ohs.acf.hhs.gov/hslc/tta-system/family Almost 10 percent of infants and toddlers weigh more than they should considering their length, and slightly more than 20 percent of children ages two to five are overweight or obese.Institute of Medicine of the National Academies. “Early Childhood Obesity Prevention Policies.” June 23, 2011. http://www.iom.edu/Reports/2011/Early-Childhood - Obesity-Prevention-Policies.aspx Obesity during early childhood tends to linger as a child matures and cause health problems later in life.
There are a number of reasons for this growing problem. One is a lack of time. Parents and other caregivers who are constantly on the go may find it difficult to fit home-cooked meals into a busy schedule and may turn to fast food and other conveniences that are quick and easy, but not nutritionally sound. Another contributing factor is a lack of access to fresh fruits and vegetables. This is a problem particularly in low-income neighborhoods where local stores and markets may not stock fresh produce or may have limited options. Physical inactivity is also a factor, as toddlers who live a sedentary lifestyle are more likely to be overweight or obese. Another contributor is a lack of breastfeeding support. Children who were breastfed as infants show lower rates of obesity than children who were bottle-fed.
To prevent or address toddler obesity parents and caregivers can do the following:
Early Childhood Caries
Early childhood caries remains a potential problem during the toddler years. The risk of early childhood caries continues as children begin to consume more foods with a high sugar content. According to the National Health and Nutrition Examinaton Survey, children between ages of two and five consume about 200 calories of added sugar per day.US Department of Health and Human Services. “Consumption of Added Sugar among US Children and Adolescents.” NCHS Data Brief, No. 87 (March 2012).
Therefore, parents with toddlers should avoid processed foods, such as snacks from vending machines, and sugary beverages, such as soda. Parents also need to instruct a child on brushing their teeth at this time to help a toddler develop healthy habits and avoid tooth decay.
Iron-Deficiency Anemia
An infant who switches to solid foods, but does not eat enough iron-rich foods, can develop iron-deficiency anemia. This condition occurs when an iron-deprived body cannot produce enough hemoglobin, a protein in red blood cells that transports oxygen throughout the body. The inadequate supply of hemoglobin for new blood cells results in anemia. Iron-deficiency anemia causes a number of problems including weakness, pale skin, shortness of breath, and irritability. It can also result in intellectual, behavioral, or motor problems. In infants and toddlers, iron-deficiency anemia can occur as young children are weaned from iron-rich foods, such as breast milk and iron-fortified formula. They begin to eat solid foods that may not provide enough of this nutrient. As a result, their iron stores become diminished at a time when this nutrient is critical for brain growth and development.
There are steps that parents and caregivers can take to prevent iron-deficiency anemia, such as adding more iron-rich foods to a child’s diet, including lean meats, fish, poultry, eggs, legumes, and iron-enriched whole-grain breads and cereals. A toddler’s diet should provide 7 to 10 milligrams of iron daily. Although milk is critical for the bone-building calcium that it provides, intake should not exceed the RDA to avoid displacing foods rich with iron. Children may also be given a daily supplement, using infant vitamin drops with iron or ferrous sulfate drops. If iron deficiency anemia does occur, treatment includes a dosage of 3 milligrams per kilogram once daily before breakfast, usually in the form of a ferrous sulfate syrup. Consuming vitamin C, such as orange juice, can also help to improve iron absorption.Kazal Jr., L. A., MD. “Prevention of Iron Deficiency in Infants and Toddlers.” American Academy of Family Physicians 66, no. 7 (October 1, 2002):
1217—25. http://www.aafp.org/afp/2002/1001/p1217.html.
Toddler Diarrhea
As with adults, a variety of conditions or circumstances may give a toddler diarrhea. Possible causes include bacterial or viral infections, food allergies, or lactose intolerance, among other medical conditions. Excessive fruit juice consumption (more than one 6- ounce cup per day) can also lead to diarrhea.American Academy of Pediatrics, Committee on Nutrition 1999–2000. “The Use and Misuse of Fruit Juice in Pediatrics.” Pediatrics 119, no. 2 (February 2007): 405. doi:10.1542/peds.2006-3222. Diarrhea presents a special concern in young children because their small size makes them more vulnerable to dehydration. Parents should contact a pediatrician if a toddler has had diarrhea for more than twenty-four hours, if a child is also vomiting, or if they exhibit signs of dehydration, such as a dry mouth or tongue, or sunken eyes, cheeks, or abdomen. Preventing or treating dehydration in toddlers includes the replacement of lost fluids and electrolytes (sodium and potassium). Oral rehydration therapy, or giving special fluids by mouth, is the most effective measure.
Developing Habits
Eating habits develop early in life. They are typically formed within the first few years and it is believed that they persist for years, if not for life. So it is important for parents and other caregivers to help children establish healthy habits and avoid problematic ones. Children begin expressing their preferences at an early age. Parents must find a balance between providing a child with an opportunity for selfexpression, helping a child develop healthy habits, and making sure that a child meets all of their nutritional needs. Following Ellyn Satter’s division of responsibility in feeding (see above) can help a child eat the right amount of food, learn mealtime behavior, and grow at a healthy and predictable rate. Bad habits and poor nutrition have an accrual effect. The foods you consume in your younger years will impact your health as you age, from childhood into the later stages of life. As a result, good nutrition today means optimal health tomorrow.
Nutrition in Childhood
Learning Objectives
Nutritional needs change as children leave the toddler years. From ages four to eight, school-aged children grow consistently, but at a slower rate than infants and toddlers. They also experience the loss of deciduous, or “baby,” teeth and the arrival of permanent teeth, which typically begins at age six or seven. As new teeth come in, many children have some malocclusion, or malposition, of their teeth, which can affect their ability to
chew food. Other changes that affect nutrition include the influence of peers on dietary choices and the kinds of foods offered by schools and afterschool programs, which can make up a sizable part of a child’s diet. Food-related problems for young children can include tooth decay, food sensitivities, and malnourishment. Also, excessive weight gain early in life can lead to obesity into adolescence and adulthood.
Childhood (Ages Four to Eight):
At this life stage, a healthy diet facilitates physical and mental development and helps to maintain health and wellness. School-aged children experience steady, consistent growth, with an average growth rate of 2–3 inches (5–7 centimeters) in height and 4.5–6.5 pounds (2–3 kilograms) in weight per year. In addition, the rate of growth for the extremities is faster than for the trunk, which results in more adult-like proportions. Long-bone growth stretches muscles and ligaments, which results in many children experiencing “growing pains,” at nighttime in particular.Elaine U. Polan, RNC, MS and Daphne R. Taylor, RN, MS, Journey Across the Life Span: Human Development and Health
Promotion (Philadelphia: F. A. Davis Company, 2003), 150–51.
Energy
Children’s energy needs vary, depending on their growth and level of physical activity. Energy requirements also vary according to gender. Girls ages four to eight require 1,200 to 1,800 calories a day, while boys need 1,200 to 2,000 calories daily, and, depending on their activity level, maybe more. Also, recommended intakes of macronutrients and most micronutrients are higher relative to body size, compared with nutrient needs during adulthood. Therefore, children should be provided nutrient-dense food at meal- and snack-time. However, it is important not to overfeed children, as this can lead to childhood obesity, which is discussed in the next section. Parents and other caregivers can turn to the MyPlate website for guidance: http://www.choosemyplate.gov/.
Macronutrients
For carbohydrates, the Acceptable Macronutrient Distribution Range (AMDR) is 45–65 percent of daily calories (which is a recommended daily allowance of 135–195 grams for 1,200 daily calories). Carbohydrates high in fiber should make up the bulk of intake. The AMDR for protein is 10–30 percent of daily calories (30–90 grams for 1,200 daily calories). Children have a high need for protein to support muscle growth and development. High levels of essential fatty acids are needed to support growth (although not as high as in infancy and the toddler years). As a result, the AMDR for fat is 25–35 percent of daily calories (33–47 grams for 1,200 daily calories). Children should get 17– 25 grams of fiber per day.
Micronutrients
Micronutrient needs should be met with foods first. Parents and caregivers should select a variety of foods from each food group to ensure that nutritional requirements are met.
Because children grow rapidly, they require foods that are high in iron, such as lean meats, legumes, fish, poultry, and iron-enriched cereals. Adequate fluoride is crucial to support strong teeth. One of the most important micronutrient requirements during childhood is adequate calcium and vitamin D intake. Both are needed to build dense bones and a strong skeleton. Children who do not consume adequate vitamin D should be given a supplement of 10 micrograms (400 international units) per day. The table shows the micronutrient recommendations for school-aged children. (Note that the recommendations are the same for boys and girls. As we progress through the different stages of the human life cycle, there will be some differences between males and females regarding micronutrient needs.)
Micronutrient Levels during Childhood
Nutrient | Children, Ages 4–8 |
Vitamin A (mcg) | 400.0 |
Vitamin B6 (mcg) | 600.0 |
Vitamin B12 (mcg) | 1.2 |
Vitamin C (mg) | 25.0 |
Vitamin D (mcg) | 5.0 |
Vitamin E (mg) | 7.0 |
Vitamin K (mcg) | 55.0 |
Calcium (mg) | 800.0 |
Folate (mcg) | 200.0 |
Iron (mg) | 10.0 |
Magnesium (mg) | 130.0 |
Niacin (B3) (mg) | 8.0 |
Phosphorus (mg) | 500.0 |
Riboflavin (B2) (mcg) | 600.0 |
Selenium (mcg) | 30.0 |
Thiamine (B1) (mcg) | 600.0 |
Zinc (mg) | 5.0 |
Source: Institute of Medicine. http://www.iom.edu.
Factors Influencing Intake
A number of factors can influence children’s eating habits and attitudes toward food. Family environment, societal trends, taste preferences, and messages in the media all impact the emotions that children develop in relation to their diet. Television commercials can entice children to consume sugary products, fatty fast-foods, excess calories, refined ingredients, and sodium. Therefore, it is critical that parents and caregivers direct children toward healthy choices.
One way to encourage children to eat healthy foods is to make meal- and snack-time fun and interesting. Parents should include children in food planning and preparation, for example selecting items while grocery shopping or helping to prepare part of a meal, such as making a salad. At this time, parents can also educate children about kitchen safety. It might be helpful to cut sandwiches, meats, or pancakes into small or interesting shapes. In addition, parents should offer nutritious desserts, such as fresh fruits, instead of calorie-laden cookies, cakes, salty snacks, and ice cream. Also, studies show that children who eat family meals on a frequent basis consume more nutritious foods.Dakota County, Minnesota. “Research on the Benefits of Family Meals.” © 2006. Last revised April 30, 2012. http://www.co.dakota.mn.us/Departments/PublicHealth/Projects/ResearchFamilyM eals.htm.
Children and Malnutrition
Malnutrition is a problem many children face, in both developing nations and the developed world. Even with the wealth of food in North America, many children grow up malnourished, or even hungry. The US Census Bureau characterizes households into the following groups:
Millions of children grow up in food-insecure households with inadequate diets due to both the amount of available food and the quality of food. In the United States, about 20 percent of households with children are food insecure to some degree. In half of those, only adults experience food insecurity, while in the other half both adults and children are considered to be food insecure, which means that children did not have access to adequate, nutritious meals at times.Coleman-Jensen, A. et al. “Household Food Security in the United States in 2010.” US Department of Agriculture, Economic Research Report, no. ERR-125 (September 2011).
Growing up in a food-insecure household can lead to a number of problems. Deficiencies in iron, zinc, protein, and vitamin A can result in stunted growth, illness, and limited development. Federal programs, such as the National School Lunch Program, the School Breakfast Program, and Summer Feeding Programs, work to address the risk of hunger and malnutrition in school-aged children. They help to fill the gaps and provide children living in food-insecure households with greater access to nutritious meals.
The National School Lunch Program
Beginning with preschool, children consume at least one of their meals in a school setting. Many children receive both breakfast and lunch outside of the home. Therefore, it is important for schools to provide meals that are nutritionally sound. In the United States, more than thirty-one million children from low-income families are given meals provided by the National School Lunch Program. This federally-funded program offers low-cost or free lunches to schools, and also snacks to afterschool facilities. School districts that take part receive subsidies from the US Department of Agriculture (USDA) for every meal they serve. School lunches must meet the 2010 Dietary Guidelines for Americans and need to provide one-third of the RDAs for protein, vitamin A, vitamin C, iron, and calcium. However, local authorities make the decisions about what foods to serve and how they are prepared.US Department of Agriculture. “National School Lunch Program Fact Sheet.” 2011. Accessed March 5,
2012. http://www.fns.usda.gov/cnd/lunch/AboutLunch/NSLPFactSheet.pdf. The Healthy School Lunch Campaign works to improve the food served to children in school and to promote children’s short- and long-term health by educating government officials, school officials, food-service workers, and parents. Sponsored by the Physicians Committee for Responsible Medicine, this organization encourages schools to offer more low-fat, cholesterol-free options in school cafeterias and in vending machines.Physicians Committee for Responsible Medicine. “Healthy School Lunches.” Accessed March 5, 2012. http://healthyschoollunches.org/.
Children and Vegetarianism
Another issue that some parents face with school-aged children is the decision to encourage a child to become a vegetarian or a vegan. Some parents and caregivers decide to raise their children as vegetarians for health, cultural, or other reasons. Preteens and teens may make the choice to pursue vegetarianism on their own, due to concerns about animals or the environment. No matter the reason, parents with vegetarian children must take care to ensure vegetarian children get healthy, nutritious foods that provide all the necessary nutrients.
Types of Vegetarian Diets
There are several types of vegetarians, each with certain restrictions in terms of diet:
Children who consume some animal products, such as eggs, cheese, or other forms of dairy, can meet their nutritional needs. For a child following a strict vegan diet, planning is needed to ensure adequate intake of protein, iron, calcium, vitamin B12, and vitamin D. Legumes and nuts can be eaten in place of meat, soy milk fortified with calcium and vitamins D and B12 can replace cow’s milk.
Food Allergies and Food Intolerance
Recent studies show that three million children under age eighteen are allergic to at least one type of food.American Academy of Allergy, Asthma and Immunology. “Allergy Statistics.” Accessed on March 5, 2012. http://www.aaaai.org/about-the- aaaai/newsroom/allergy-statistics.aspx. Some of the most common allergenic foods include peanuts, milk, eggs, soy, wheat, and shellfish. An allergy occurs when a protein in food triggers an immune response, which results in the release of antibodies, histamine, and other defenders that attack foreign bodies. Possible symptoms include itchy skin, hives, abdominal pain, vomiting, diarrhea, and nausea. Symptoms usually develop within minutes to hours after consuming a food allergen. Children can outgrow a food allergy, especially allergies to wheat, milk, eggs, or soy.
Anaphylaxis is a life-threatening reaction that results in difficulty breathing, swelling in the mouth and throat, decreased blood pressure, shock, or even death. Milk, eggs, wheat, soybeans, fish, shellfish, peanuts, and tree nuts are the most likely to trigger this type of response. A dose of the drug epinephrine is often administered via a “pen” to treat a person who goes into anaphylactic shock.National Institutes of Health, US Department of Health and Human Services. “Food Allergy Quick Facts.” Accessed March 5,
2012. http://www.niaid.nih.gov/topics/foodallergy/understanding/pages/quickfacts.aspx.
Some children experience a food intolerance, which does not involve an immune response. A food intolerance is marked by unpleasant symptoms that occur after consuming certain foods. Lactose intolerance, though rare in very young children, is one example. Children who suffer from this condition experience an adverse reaction to the lactose in milk products. It is a result of the small intestine’s inability to produce enough of the enzyme lactase, which is produced by the small intestine. Symptoms of lactose intolerance usually affect the GI tract and can include bloating, abdominal pain, gas, nausea, and diarrhea. An intolerance is best managed by making dietary changes and avoiding any foods that trigger the reaction.National Digestive Disease Information Clearinghouse, a service of National Institute of Diabetes and Digestive and Kidney Diseases, National Institutes of Health. “Lactose Intolerance.” NIH Publication No. 09– 2751 (June 2009). Last updated April 23,
2012. http://digestive.niddk.nih.gov/ddiseases/pubs/lactoseintolerance/.
The Threat of Lead Toxicity
There is a danger of lead toxicity, or lead poisoning, among school-aged children. Lead is found in plumbing in old homes, in lead-based paint, and occasionally in the soil.
Contaminated food and water can increase exposure and result in hazardous lead levels in
the blood. Children under age six are especially vulnerable. They may consume items tainted with lead, such as chipped, lead-based paint. Another common exposure is lead dust in carpets, with the dust flaking off of paint on walls. When children play or roll around on carpets coated with lead, they are in jeopardy. Lead is indestructible, and once it has been ingested it is difficult for the human body to alter or remove it. It can quietly build up in the body for months, or even years, before the onset of symptoms. Lead toxicity can damage the brain and central nervous system, resulting in impaired thinking, reasoning, and perception.
Treatment for lead poisoning includes removing the child from the source of contamination and extracting lead from the body. Extraction may involve chelation therapy, which binds with lead so it can be excreted in urine. Another treatment protocol, EDTA therapy, involves administering a drug called ethylenediaminetetraacetic acid to remove lead from the bloodstream of patients with levels greater than 45 mcg/dL.Mayo Foundation for Medical Education and Research. “Lead poisoning.” ©1998–2012 Accessed March 5, 2012. http://www.mayoclinic.com/health/lead-
poisoning/FL00068. Fortunately, lead toxicity is highly preventable. It involves identifying potential hazards, such as lead paint and pipes, and removing them before children are exposed to them.
Puberty and Nutrition
LEARNING OBJECTIVES
Puberty is the beginning of adolescence. The onset of puberty brings a number of changes, including the development of primary and secondary sex characteristics, growth spurts, an increase in body fat, and an increase in bone and muscle development. All of these changes must be supported with adequate intake and healthy food choices.
The Onset of Puberty (Ages Nine to Thirteen)
This period of physical development is divided into two phases. The first phase involves height increases from 20 to 25 percent. Puberty is second to the prenatal period in terms of rapid growth as the long bones stretch to their final, adult size. Girls grow 2–8 inches (5–20 centimeters) taller, while boys grow 4–12 inches (10–30 centimeters) taller. The second phase involves weight gain related to the development of bone, muscle, and fat tissue. Also in the midst of puberty, the sex hormones trigger the development of reproductive organs and secondary sexual characteristics, such as pubic hair. Girls also develop “curves,” while boys become broader and more muscular.Beverly
McMillan, Illustrated Atlas of the Human Body (Sydney, Australia: Weldon Owen, 2008), 258.
Energy
The energy requirements for preteens differ according to gender, growth, and activity level. For ages nine to thirteen, girls should consume about 1,400 to 2,200 calories per day and boys should consume 1,600 to 2,600 calories per day. Physically active preteens who regularly participate in sports or exercise need to eat a greater number of calories to account for increased energy expenditures.
Macronutrients
For carbohydrates, the AMDR is 45 to 65 percent of daily calories (which is a recommended daily allowance of 158–228 grams for 1,400–1,600 daily calories). Carbohydrates that are high in fiber should make up the bulk of intake. The AMDR for protein is 10 to 30 percent of daily calories (35–105 grams for 1,400 daily calories for girls and 40–120 grams for 1,600 daily calories for boys). The AMDR for fat is 25 to 35 percent of daily calories (39–54 grams for 1,400 daily calories for girls and 44–62 grams for 1,600 daily calories for boys), depending on caloric intake and activity level.
Micronutrients
Key vitamins needed during puberty include vitamins D, K, and B12. Adequate calcium intake is essential for building bone and preventing osteoporosis later in life. Young females need more iron at the onset of menstruation, while young males need additional iron for the development of lean body mass. Almost all of these needs should be met with dietary choices, not supplements (iron is an exception). The table below shows the micronutrient recommendations for young adolescents.
Micronutrient Levels during Puberty
Nutrient | Preteens, Ages 9–13 |
Vitamin A (mcg) | 600.0 |
Vitamin B6 (mg) | 1.0 |
Vitamin B12 (mcg) | 1.8 |
Vitamin C (mg) | 45.0 |
Vitamin D (mcg) | 5.0 |
Vitamin E (mg) | 11.0 |
Vitamin K (mcg) | 60.0 |
Calcium (mg) | 1,300.0 |
Folate (mcg) | 300.0 |
Iron (mg) | 8.0 |
Nutrient | Preteens, Ages 9–13 |
Magnesium (mg) | 240.0 |
Niacin (B3) (mg) | 12.0 |
Phosphorus (mg) | 1,250.0 |
Riboflavin (B2) (mcg) | 900.0 |
Selenium (mcg) | 40.0 |
Thiamine (B1) (mcg) | 900.0 |
Zinc (mg) | 8.0 |
Source: Institute of Medicine. http://www.iom.edu.
Childhood Obesity
Children need adequate caloric intake for growth, and it is important not to impose very restrictive diets. However, exceeding caloric requirements on a regular basis can lead to childhood obesity, which has become a major problem in North America. Nearly one of three US children and adolescents are overweight or obese.Let’s Move. “Learn the Facts.” Accessed March 5, 2012. http://www.letsmove.gov/learn-facts/epidemic- childhood-obesity. In Canada, approximately 26 percent of children and adolescents are overweight or obese.Childhood Obesity Foundation. “Statistics.” Accessed March 5, 2012. http://www.childhoodobesityfoundation.ca/statistics.
There are a number of reasons behind this problem, including:
Children who suffer from obesity are more likely to become overweight or obese adults. Obesity has a profound effect on self-esteem, energy, and activity level. Even more importantly, it is a major risk factor for a number of diseases later in life, including cardiovascular disease, Type 2 diabetes, stroke, hypertension, and certain cancers.World Health Organization. “Obesity and Overweight Fact Sheet.” Last revised March
2011. http://www.who.int/mediacentre/factsheets/fs311/en/.
A percentile for body mass index (BMI) specific to age and sex is used to determine if a child is overweight or obese. This is more appropriate than the BMI categories used for adults because the body composition of children varies as they develop, and differs between boys and girls. If a child gains weight inappropriate to growth, parents and
caregivers should limit energy-dense, nutrient-poor snack foods. Also, children ages three and older can follow the National Cholesterol Education Program guidelines of no more than 35 percent of calories from fat (10 percent or less from saturated fat), and no more than 300 milligrams of cholesterol per day. In addition, it is extremely beneficial to increase a child’s physical activity and limit sedentary activities, such as watching television, playing video games, or surfing the Internet.
Programs to address childhood obesity can include behavior modification, exercise counseling, psychological support or therapy, family counseling, and family meal- planning advice. For most, the goal is not weight loss, but rather allowing height to catch up with weight as the child continues to grow. Rapid weight loss is not recommended for preteens or younger children due to the risk of deficiencies and stunted growth.
Avoiding Added Sugars
One major contributing factor to childhood obesity is the consumption of added sugars. Added sugars include not only sugar added to food at the table, but also are ingredients in items such as bread, cookies, cakes, pies, jams, and soft drinks. The added sugar in store- bought items may be listed as white sugar, brown sugar, high-fructose corn syrup, honey, malt syrup, maple syrup, molasses, anhydrous dextrose, crystal dextrose, and concentrated fruit juice. (Not included are sugars that occur naturally in foods, such as the lactose in milk or the fructose in fruits.) In addition, sugars are often “hidden” in items added to foods after they’re prepared, such as ketchup, salad dressing, and other condiments. According to the National Center for Health Statistics, young children and adolescents consume an average of 322 calories per day from added sugars, or about 16 percent of daily calories.National Center for Health Statistics. “Consumption of Added Sugar among US Children and Adolescents, 2005–2008.” NCHS Data Brief, no. 87, (March 2012). http://www.cdc.gov/nchs/data/databriefs/db87.pdf. The primary offenders are processed and packaged foods, along with soda and other beverages. These foods are not only high in sugar, they are also light in terms of nutrients and often take the place of healthier options. Intake of added sugar should be limited to 100–150 calories per day to discourage poor eating habits.
Older Adolescence and Nutrition
LEARNING OBJECTIVES
In this section, we will discuss the nutritional requirements for young people ages fourteen to eighteen. One way that teenagers assert their independence is by choosing what to eat. They have their own money to purchase food and tend to eat more meals away from home. Older adolescents also can be curious and open to new ideas, which includes trying new kinds of food and experimenting with their diet. For example, teens will sometimes skip a main meal and snack instead. That is not necessarily problematic. Their choice of food is more important than the time or place.
However, too many poor choices can make young people nutritionally vulnerable. Teens should be discouraged from eating fast food, which has a high fat and sugar content, or frequenting convenience stores and using vending machines, which typically offer poor nutritional selections. Other challenges that teens may face include obesity and eating disorders. At this life stage, young people still need guidance from parents and other caregivers about nutrition-related matters. It can be helpful to explain to young people how healthy eating habits can support activities they enjoy, such as skateboarding or dancing, or connect to their desires or interests, such as a lean figure, athletic performance, or improved cognition.
Adolescence (Ages Fourteen to Eighteen): Transitioning into Adulthood
As during puberty, growth and development during adolescence differs in males than in females. In teenage girls, fat assumes a larger percentage of body weight, while teenage boys experience greater muscle and bone increases. For both, primary and secondary sex characteristics have fully developed and the rate of growth slows with the end of puberty. Also, the motor functions of an older adolescent are comparable to those of an adult.Elaine U. Polan, RNC, MS and Daphne R. Taylor, RN, MS, Journey Across the Life Span: Human Development and Health Promotion (Philadelphia: F. A. Davis Company, 2003), 171–173. Again, adequate nutrition and healthy choices support this stage of growth and development.
Energy
Adolescents have increased appetites due to increased nutritional requirements. Nutrient needs are greater in adolescence than at any other time in the life cycle, except during pregnancy. The energy requirements for ages fourteen to eighteen are 1,800 to 2,400 calories for girls and 2,000 to 3,200 calories for boys, depending on activity level. The extra energy required for physical development during the teenaged years should be obtained from foods that provide nutrients instead of “empty calories.” Also, teens who participate in sports must make sure to meet their increased energy needs.
Macronutrients
Older adolescents are more responsible for their dietary choices than younger children, but parents and caregivers must make sure that teens continue to meet their nutrient needs. For carbohydrates, the AMDR is 45 to 65 percent of daily calories (203–293 grams for 1,800 daily calories). Adolescents require more servings of grain than younger children, and should eat whole grains, such as wheat, oats, barley, and brown rice. The Institute of Medicine recommends higher intakes of protein for growth in the adolescent population. The AMDR for protein is 10 to 30 percent of daily calories (45–135 grams for 1,800 daily calories), and lean proteins, such as meat, poultry, fish, beans, nuts, and seeds are excellent ways to meet those nutritional needs.
The AMDR for fat is 25 to 35 percent of daily calories (50–70 grams for 1,800 daily calories), and the AMDR for fiber is 25–34 grams per day, depending on daily calories
and activity level. It is essential for young athletes and other physically active teens to intake enough fluids, because they are at a higher risk for becoming dehydrated.
Micronutrients
Micronutrient recommendations for adolescents are mostly the same as for adults, though children this age need more of certain minerals to promote bone growth (e.g., calcium and phosphorus, along with iron and zinc for girls). Again, vitamins and minerals should be obtained from food first, with supplementation for certain micronutrients only (such as iron).
The most important micronutrients for adolescents are calcium, vitamin D, vitamin A, and iron. Adequate calcium and vitamin D are essential for building bone mass. The recommendation for calcium is 1,300 milligrams for both boys and girls. Low-fat milk and cheeses are excellent sources of calcium and help young people avoid saturated fat and cholesterol. It can also be helpful for adolescents to consume products fortified with calcium, such as breakfast cereals and orange juice. Iron supports the growth of muscle and lean body mass. Adolescent girls also need to ensure sufficient iron intake as they start to menstruate. Girls ages twelve to eighteen require 15 milligrams of iron per day. Increased amounts of vitamin C from orange juice and other sources can aid in iron absorption. Also, adequate fruit and vegetable intake allows for meeting vitamin A needs. The table below shows the micronutrient recommendations for older adolescents, which differ slightly for males and females, unlike the recommendations for puberty.
Micronutrient Levels during Older Adolescence
Nutrient | Males, Ages 14–18 | Females, Ages 14–18 |
Vitamin A (mcg) | 900.0 | 700.0 |
Vitamin B6 (mg) | 1.3 | 1.2 |
Vitamin B12 (mcg) | 2.4 | 2.4 |
Vitamin C (mg) | 75.0 | 65.0 |
Vitamin D (mcg) | 5.0 | 5.0 |
Vitamin E (mg) | 15.0 | 15.0 |
Vitamin K (mcg) | 75.0 | 75.0 |
Calcium (mg) | 1,300.0 | 1,300.0 |
Folate mcg) | 400.0 | 400.0 |
Iron (mg) | 11.0 | 15.0 |
Magnesium (mg) | 410.0 | 360.0 |
Niacin (B3) (mg) | 16.0 | 14.0 |
Nutrient | Males, Ages 14–18 | Females, Ages 14–18 |
Phosphorus (mg) | 1,250.0 | 1,250.0 |
Riboflavin (B2) (mg) | 1.3 | 1.0 |
Selenium (mcg) | 55.0 | 55.0 |
Thiamine (B1) (mg) | 1.2 | 1.0 |
Zinc (mg) | 11.0 | 9.0 |
Source: Institute of Medicine. http://www.iom.edu.
Eating Disorders
Many teens struggle with an eating disorder, which can have a detrimental effect on diet and health. A study published by North Dakota State University estimates that these conditions impact twenty-four million people in the United States and seventy million worldwide. North Dakota State University. “Eating Disorder Statistics.” Accessed March 5,
2012. http://www.ndsu.edu/fileadmin/counseling/Eating_Disorder_Statistics.pdf. These disorders are more prevalent among adolescent girls, but have been increasing among adolescent boys in recent years. Because eating disorders often lead to malnourishment, adolescents with an eating disorder are deprived of the crucial nutrients their still- growing bodies need.
Eating disorders involve extreme behavior related to food and exercise. Sometimes referred to as “starving or stuffing,” they encompass a group of conditions marked by undereating or overeating. Some of these conditions include:
female. Approximately 1 to 2 percent of American women and girls have this eating disorder. National Eating Disorders Association. “Learn Basic Terms and Information on a Variety of Eating Disorder Topics.” Accessed March 5,
2012. http://www.nationaleatingdisorders.org/information-resources/general - information.php.
Eating disorders stem from stress, low self-esteem, and other psychological and emotional issues. It is important for parents to watch for signs and symptoms of these disorders, including sudden weight loss, lethargy, vomiting after meals, and the use of appetite suppressants. Eating disorders can lead to serious complications or even be fatal if left untreated. Treatment includes cognitive, behavioral, and nutritional therapy.
Chapter 18: Middle Age Through Old Age and and Nutrition
Adapted from: Zimmerman and Snow. “An Introduction to Nutrition” v. 1.0. and accessed at https://2012books.lardbucket.org/books/an-introduction-to-nutrition/
LEARNING OBJECTIVES
During this stage of the human life cycle, adults begin to experience the first outward signs of aging. Wrinkles begin to appear, joints ache after a highly active day, and body fat accumulates. There is also a loss of muscle tone and elasticity in the connective tissue.Elaine U. Polan, RNC, MS and Daphne R. Taylor, RN, MS, Journey Across the Life Span: Human Development and Health Promotion(Philadelphia: F. A. Davis Company, 2003), 212–213. Throughout the aging process, good nutrition can help middle-aged adults maintain their health and recover from any medical problems or issues they may experience.
Middle Age (Ages Thirty-One to Fifty): Aging Well
Many people in their late thirties and in their forties notice a decline in endurance, the onset of wear-and-tear injuries (such as osteoarthritis), and changes in the digestive system. Wounds and other injuries also take longer to heal. Body composition changes due to fat deposits in the trunk. To maintain health and wellness during the middle-aged years and beyond, it is important to:
Energy
The energy requirements for ages thirty-one to fifty are 1,800 to 2,200 calories for women and 2,200 to 3,000 calories for men, depending on activity level. These estimates do not include women who are pregnant or breastfeeding (see Chapter 12 "Nutrition through the Life Cycle: From Pregnancy to the Toddler Years"). Middle-aged adults must rely on healthy food sources to meet these needs. In many parts of North America, typical dietary patterns do not match the recommended guidelines. For example, five foods— iceberg lettuce, frozen potatoes, fresh potatoes, potato chips, and canned tomatoes— account for over half of all vegetable intake.Adam Drewnowski and Nicole Darmon. “Food Choices and Diet Cost: an Economic Analysis.” The Journal of Nutrition. © 2005
The American Society for Nutritional Sciences. Accessed March 5,
2012. http://jn.nutrition.org/content/135/4/900.full. Following the dietary guidelines in the middle-aged years provides adequate but not excessive energy, macronutrients, vitamins, and minerals.
Macronutrients and Micronutrients
The AMDRs for carbohydrates, protein, fat, fiber, and fluids remain the same from young adulthood into middle age (see Section 13.5 "Young Adulthood and Nutrition" of this chapter). It is important to avoid putting on excess pounds and limiting an intake of SoFAAS to help avoid cardiovascular disease, diabetes, and other chronic conditions.
There are some differences, however, regarding micronutrients. For men, the recommendation for magnesium increases to 420 milligrams daily, while middle-aged women should increase their intake of magnesium to 320 milligrams per day. Other key vitamins needed during the middle-aged years include folate and vitamins B6 and B12 to prevent elevation of homocysteine, a byproduct of metabolism that can damage arterial walls and lead to atherosclerosis, a cardiovascular condition. Again, it is important to meet nutrient needs with food first, then supplementation, such as a daily multivitamin, if you can’t meet your needs through food.
Preventive/Defensive Nutrition
During the middle-aged years, preventive nutrition can promote wellness and help organ systems to function optimally throughout aging. Preventive nutrition is defined as dietary practices directed toward reducing disease and promoting health and well-being. Healthy eating in general—such as eating unrefined carbohydrates instead of refined carbohydrates and avoiding trans fats and saturated fats—helps to promote wellness.
However, there are also some things that people can do to target specific concerns. One example is consuming foods high in antioxidants, such as strawberries, blueberries, and other colorful fruits and vegetables, to reduce the risk of cancer.
Phytochemicals are compounds in fruits and vegetables that act as defense systems for plants. Different phytochemicals are beneficial in different ways. For example, carotenoids, which are found in carrots, cantaloupes, sweet potatoes, and butternut squash, may protect against cardiovascular disease by helping to prevent the oxidation of cholesterol in the arteries, although research is ongoing.Sari Voutilainen, Tarja Nurmi, Jaakko Mursu, and Tiina H. Rissanen. “Carotenoids and Cardiovascular Health.” Am J Clin Nutr 83 (2006): 1265–
2010. http://www.cancer.org/Treatment/TreatmentsandSideEffects/ComplementaryandAl ternativeMedicine/DietandNutrition/lycopene.
Omega-3 fatty acids can help to prevent coronary artery disease. These crucial nutrients are found in oily fish, including salmon, mackerel, tuna, herring, cod, and halibut. Other
beneficial fats that are vital for healthy functioning include monounsaturated fats, which are found in plant oils, avocados, peanuts, and pecans.
Menopause
In the middle-aged years, women undergo a specific change that has a major effect on their health. They begin the process of menopause, typically in their late forties or early fifties. The ovaries slowly cease to produce estrogen and progesterone, which results in the end of menstruation. Menopausal symptoms can vary, but often include hot flashes, night sweats, and mood changes. The hormonal changes that occur during menopause can lead to a number of physiological changes as well, including alterations in body composition, such as weight gain in the abdominal area. Bone loss is another common condition related to menopause due to the loss of female reproductive hormones. Bone thinning increases the risk of fractures, which can affect mobility and the ability to complete everyday tasks, such as cooking, bathing, and dressing.Academy of Nutrition and Dietetics. “Eating Right During Menopause.” © 1995–2012. Accessed March 5, 2012. http://www.eatright.org/Public/content.aspx?id=6809. Recommendations for women experiencing menopause or perimenopause (the stage just prior to the end of the menstruation) include:
Old Age and Nutrition
LEARNING OBJECTIVES
Beginning at age fifty-one, requirements change once again and relate to the nutritional issues and health challenges that older people face. After age sixty, blood pressure rises and the immune system may have more difficulty battling invaders and infections. The skin becomes more wrinkled and hair has turned gray or white or fallen out, resulting in hair thinning. Older adults may gradually lose an inch or two in height. Also, short-term memory might not be as keen as it once was.Beverly McMillan, Illustrated Atlas of the Human Body (Sydney, Australia: Weldon Owen, 2008), 260.
In addition, many people suffer from serious health conditions, such as cardiovascular disease and cancer. Being either underweight or overweight is also a major concern for the elderly. However, many older adults remain in relatively good health and continue to be active into their golden years. Good nutrition is often the key to maintaining health later in life. In addition, the fitness and nutritional choices made earlier in life set the stage for continued health and happiness.
Older Adulthood (Ages Fifty-One and Older): The Golden Years
An adult’s body changes during old age in many ways, including a decline in hormone production, muscle mass, and strength. Also in the later years, the heart has to work harder because each pump is not as efficient as it used to be. Kidneys are not as effective in excreting metabolic products such as sodium, acid, and potassium, which can alter water balance and increase the risk for over- or underhydration. In addition, immune function decreases and there is lower efficiency in the absorption of vitamins and minerals.
Older adults should continue to consume nutrient-dense foods and remain physically active. However, deficiencies are more common after age sixty, primarily due to reduced intake or malabsorption. The loss of mobility among frail, homebound elderly adults also impacts their access to healthy, diverse foods.
Energy
Due to reductions in lean body mass and metabolic rate, older adults require less energy than younger adults. The energy requirements for people ages fifty-one and over are 1,600 to 2,200 calories for women and 2,000 to 2,800 calories for men, depending on activity level. The decrease in physical activity that is typical of older adults also influences nutritional requirements.
Macronutrients
The AMDRs for carbohydrates, protein, and fat remain the same from middle age into old age (see Section 13.5 "Young Adulthood and Nutrition" of this chapter for specifics). Older adults should substitute more unrefined carbohydrates for refined ones, such as whole grains and brown rice. Fiber is especially important in preventing constipation and diverticulitis, and may also reduce the risk of colon cancer. Protein should be lean, and healthy fats, such as omega-3 fatty acids, are part of any good diet.
Micronutrients
An increase in certain micronutrients can help maintain health during this life stage. The recommendations for calcium increase to 1,200 milligrams per day for both men and women to slow bone loss. Also to help protect bones, vitamin D recommendations increase to 10–15 micrograms per day for men and women. Vitamin B6 recommendations rise to 1.7 milligrams per day for older men and 1.5 milligrams per day for older women to help lower levels of homocysteine and protect against cardiovascular disease. As adults age, the production of stomach acid can decrease and lead to an overgrowth of
bacteria in the small intestine. This can affect the absorption of vitamin B12 and cause a deficiency. As a result, older adults need more B12 than younger adults, and require an intake of 2.4 micrograms per day, which helps promote healthy brain functioning. For elderly women, higher iron levels are no longer needed postmenopause and recommendations decrease to 8 milligrams per day. People over age fifty should eat foods rich with all of these micronutrients.
Nutritional Concerns for Older Adults
Dietary choices can help improve health during this life stage and address some of the nutritional concerns that many older adults face. In addition, there are specific concerns related to nutrition that affect adults in their later years. They include medical problems, such as disability and disease, which can impact diet and activity level. For example, dental problems can lead to difficulties with chewing and swallowing, which in turn can make it hard to maintain a healthy diet. The use of dentures or the preparation of pureed or chopped foods can help solve this problem. There also is a decreased thirst response in the elderly, and the kidneys have a decreased ability to concentrate urine, both of which can lead to dehydration.
Sensory Issues
At about age sixty, taste buds begin to decrease in size and number. As a result, the taste thresholdis higher in older adults, meaning that more of the same flavor must be present to detect the taste. Many elderly people lose the ability to distinguish between salty, sour, sweet, and bitter flavors. This can make food seem less appealing and decrease the appetite. An intake of foods high in sugar and sodium can increase due to an inability to discern those tastes. The sense of smell also decreases, which impacts attitudes toward food. Sensory issues may also affect the digestion because the taste and smell of food stimulates the secretion of digestive enzymes in the mouth, stomach, and pancreas.
Gastrointestinal Problems
A number of gastrointestinal issues can affect food intake and digestion among the elderly. Saliva production decreases with age, which affects chewing, swallowing, and taste. Digestive secretions decline later in life as well, which can lead to atrophic gastritis (inflammation of the lining of the stomach). This interferes with the absorption of some vitamins and minerals. Reduction of the digestive enzyme lactase results in a decreased tolerance for dairy products. Slower gastrointestinal motility can result in more constipation, gas, and bloating, and can also be tied to low fluid intake, decreased physical activity, and a diet low in fiber, fruits, and vegetables.
Dysphagia
Some older adults have difficulty getting adequate nutrition because of the disorder dysphagia, which impairs the ability to swallow. Any damage to the parts of the brain that control swallowing can result in dysphagia, therefore stroke is a common cause. Dysphagia is also associated with advanced dementia because of overall brain function
impairment. To assist older adults suffering from dysphagia, it can be helpful to alter food consistency. For example, solid foods can be pureed, ground, or chopped to allow more successful and safe swallow. This decreases the risk of aspiration, which occurs when food flows into the respiratory tract and can result in pneumonia. Typically, speech therapists, physicians, and dietitians work together to determine the appropriate diet for dysphagia patients.
Obesity in Old Age
Similar to other life stages, obesity is a concern for the elderly. Adults over age sixty are more likely to be obese than young or middle-aged adults. As explained throughout this chapter, excess body weight has severe consequences. Being overweight or obese increases the risk for potentially fatal conditions that can afflict the elderly. They include cardiovascular disease, which is the leading cause of death in the United States, and Type 2 diabetes, which causes about seventy thousand deaths in the United States annually.Centers for Disease Control, National Center for Health Statistics. “Deaths and Mortality.” Last updated January 27,
2012. http://www.cdc.gov/nchs/fastats/deaths.htm. Obesity is also a contributing factor for a number of other conditions, including arthritis.
For older adults who are overweight or obese, dietary changes to promote weight loss should be combined with an exercise program to protect muscle mass. This is because dieting reduces muscle as well as fat, which can exacerbate the loss of muscle mass due to aging. Although weight loss among the elderly can be beneficial, it is best to be cautious and consult with a health-care professional before beginning a weight-loss program.
The Anorexia of Aging
In addition to concerns about obesity among senior citizens, being underweight can be a major problem. A condition known as the anorexia of aging is characterized by poor food intake, which results in dangerous weight loss. This major health problem among the elderly leads to a higher risk for immune deficiency, frequent falls, muscle loss, and cognitive deficits. Reduced muscle mass and physical activity mean that older adults need fewer calories per day to maintain a normal weight. It is important for health care providers to examine the causes for anorexia of aging among their patients, which can vary from one individual to another. Understanding why some elderly people eat less as they age can help health-care professionals assess the risk factors associated with this condition. Decreased intake may be due to disability or the lack of a motivation to eat.
Also, many older adults skip at least one meal each day. As a result, some elderly people are unable to meet even reduced energy needs.
Nutritional interventions should focus primarily on a healthy diet. Remedies can include increasing the frequency of meals and adding healthy, high-calorie foods (such as nuts, potatoes, whole-grain pasta, and avocados) to the diet. Liquid supplements between meals may help to improve caloric intake.Morley, J. E. “Anorexia of Aging: Physiologic and Pathologic.” Am J Clin Nutr 66 (1997): 760–
73. http://www.ajcn.org/content/66/4/760.full.pdf. Health care professionals should
consider a patient’s habits and preferences when developing a nutritional treatment plan. After a plan is in place, patients should be weighed on a weekly basis until they show improvement.
Vision Problems
Many older people suffer from vision problems and a loss of vision. Age-related macular degeneration is the leading cause of blindness in Americans over age sixty.American Medical Association, Complete Guide to Prevention and Wellness (Hoboken, NJ: John Wiley & Sons, Inc., 2008), 413. This disorder can make food planning and preparation extremely difficult and people who suffer from it often must depend on caregivers for their meals. Self-feeding also may be difficult if an elderly person cannot see his or her food clearly. Friends and family members can help older adults with shopping and cooking. Food-assistance programs for older adults (such as Meals on Wheels) can also be helpful.
Diet may help to prevent macular degeneration. Consuming colorful fruits and vegetables increases the intake of lutein and zeaxanthin. Several studies have shown that these antioxidants provide protection for the eyes. Lutein and zeaxanthin are found in green, leafy vegetables such as spinach, kale, and collard greens, and also corn, peaches, squash, broccoli, Brussels sprouts, orange juice, and honeydew melon.American Medical Association, Complete Guide to Prevention and Wellness(Hoboken, NJ: John Wiley & Sons, Inc., 2008), 415.
Neurological Conditions
Elderly adults who suffer from dementia may experience memory loss, agitation, and delusions. One in eight people over the age sixty-four and almost half of all people over eighty-five suffer from Alzheimer’s, which is the most common form of dementia. These conditions can have serious effects on diet and nutrition as a person increasingly becomes incapable of caring for himself or herself, which includes the ability to buy and prepare food, and to self-feed.
Longevity and Nutrition
The foods you consume in your younger years influence your health as you age. Good nutrition and regular physical activity can help you live longer and healthier. Conversely, poor nutrition and a lack of exercise can shorten your life and lead to medical problems. The right foods provide numerous benefits at every stage of life. They help an infant grow, an adolescent develop mentally and physically, a young adult achieve his or her physical peak, and an older adult cope with aging. Nutritious foods form the foundation of a healthy life at every age.
Chapter 19: Fitness and Nutrition
http://www.oercommons.org/courses/nutrition-and-medicine/view
Nutrition for fitness and athletes will be similar to that of the normal, balanced person, but there are going to be a few changes. Athletes need a balanced diet to perform at their highest potential.
Fitness:
According to the American College of Sports Medicine (ACSM) fitness is defined through four variables F (frequency), I (intensity), T (time), and T (type). These exercise principles are then applied to the three types of physical fitness, Cardiorespiratory Endurance, Muscular Strength/Endurance and Flexibility. In each of the physical fitness areas, the FITT Principle is applied as follows:
Cardiorespiratory Endurance:
F: 3-5 Days per week (most days)
I: 65-90% of the maximum heart rate T: 20-60 Minutes
T: Any activity relying on the oxidative energy system (120 seconds or longer)
Muscular Strength/Endurance:
F: 2-3 Non Consecutive days per week
I: 100-80% (strength); 80-60% (endurance)
T: 1-8 Repetitions (strength); 12-20 Repetitions (endurance)
T: As many exercises it must be to at least use every muscle of the body once.
Flexibility:
F: 3-7 days per week
I: To a place of slight discomfort T: 20-30 Seconds; at least 2 times
T: Dynamic Stretches (Warm-up), Static Stretches (Cool-down)
Web Links
What makes muscles grow?
Type of Exercise
Web Links
Difference between Endurance and Strength
In cardiorespiratory fitness, the objective of the exercise is to stimulate the cardiorespiratory system. Other activities that accomplish the same objective include swimming, biking, dancing, cross country skiing, aerobic classes, and much more. As such, these activities can be used to build lung capacity and improve cellular and heart function.
However, the more specific the exercise, the better. While vigorous ballroom dancing will certainly help develop the cardiorespiratory system, it will unlikely improve a person’s 10k time. To improve performance in a 10k, athletes spend the majority of their time training by running, as they will have to do in the actual 10k. Cyclists training for the Tour de France, spend up to six hours a day in the saddle, peddling feverishly. These athletes know the importance of training the way they want their body to adapt. This concept, called the principle of specificity, should be taken into consideration when creating a training plan.
In this discussion of type and the principle of specificity, a few additional items should be considered. Stress, as it relates to exercise, is very specific. There are multiple types of stress. The three main stressors are metabolic stress, force stress, and environmental stress. Keep in mind, the body will adapt based on the type of stress being placed on it.
Metabolic stress results from exercise sessions when the energy systems of the body are taxed. For example, sprinting short distances requires near maximum intensity and requires energy (ATP) to be produced primarily through anaerobic pathways, that is, pathways not requiring oxygen to produce ATP. Anaerobic energy production can only be supported for a very limited time (10 seconds to 2 minutes). However, distance running at steady paces requires aerobic energy production, which can last for hours. As a result, the training strategy for the distance runner must be different than the training plan of a sprinter, so the energy systems will adequately adapt.
Likewise, force stress accounts for the amount of force required during an activity. In weightlifting, significant force production is required to lift heavy loads. The type of muscles being developed, fast-twitch muscle fibers, must be recruited to support the activity. In walking and jogging, the forces being absorbed come from the body weight combined with forward momentum. Slow twitch fibers, which are unable to generate as much force as the fast twitch fibers, are the type of muscle fibers primarily recruited in this activity. Because the force
requirements differ, the training strategies must also vary to develop the right kind of musculature.
Environmental stress, such as exercising in the heat, places a tremendous amount of stress on the thermoregulatory systems. As an adaptation to the heat, the amount of sweating increases as does plasma volume, making it much easier to keep the body at a normal temperature during exercise. The only way to adapt is through heat exposure, which can take days to weeks to properly adapt.
In summary, to improve performance, being specific in your training, or training the way you want to adapt, is paramount.
References & Links
1. ACSM guidelines (ACSM.org)
Links
https://www.pledgesports.org/2017/04/the-key-difference-between-fitness-and-endurance/
Video
Muscles TED talk: https://www.youtube.com/watch?v=2tM1LFFxeKg
Nutrition for Fitness/Athletes
Energy Systems and Fuels to Support Activity
The three energy systems used during an exercise bout will be as follows:
Explosive (Immediate) System:
0-7 Seconds
Typical Energy Source: Stored ATP and Phosphogen
Typical Activities in this system: Sprinting, Jumping, Throwing (shotput, javelin, discus), volleyball, softball, football
Anaerobic (Non-Oxidative) System:
7-120 Seconds
Typical Energy Source: Glucose and Glycogen
Typical Activities in this system: Long sprints (200m-600m, Basketball, soccer
Aerobic (Oxidative) System:
From 120 Seconds on
Typical Energy Source: Oxygen
Typical Activities in this system: Long distance running, cycling, rowing
When looking at the energy systems it is a simplistic view to look at the energy systems as a binomial energy source utilizing only one thing or the other. The activity intensity can dictate what type of substrate utilization your body uses. Use the Weblink to better understand the substrate utilization during different exercises.
Web Links
Fat Burning or Sugar Burning Exercise?
Fuels for Exercise
Fat for Energy
Fats (or triglycerides) within the body are ingested as food or synthesized by adipocytes or hepatocytes from carbohydrate precursors (Figure). Lipid metabolism entails the oxidation of fatty acids to either generate energy or synthesize new lipids from smaller constituent molecules. Lipid metabolism is associated with carbohydrate metabolism, as products of glucose (such as acetyl CoA) can be converted into lipids.
Triglyceride Broken Down into a Monoglyceride
A triglyceride molecule (a) breaks down into a monoglyceride (b).
Lipid metabolism begins in the intestine where ingested triglycerides are broken down into smaller chain fatty acids and subsequently into monoglyceride molecules (see Figureb) by pancreatic lipases, enzymes that break down fats after they are emulsified by bile salts. When food reaches the small intestine in the form of chyme, a digestive hormone called cholecystokinin (CCK) is released by intestinal cells in the intestinal mucosa. CCK stimulates the release of pancreatic lipase from the pancreas and stimulates the contraction of the gallbladder to release stored bile salts into the intestine. CCK also travels to the brain, where it can act as a hunger suppressant.
Together, the pancreatic lipases and bile salts break down triglycerides into free fatty acids. These fatty acids can be transported across the intestinal membrane. However, once they cross the membrane, they are recombined to again form triglyceride molecules. Within the intestinal cells, these triglycerides are packaged along with cholesterol molecules in phospholipid vesicles called chylomicrons (Figure). The chylomicrons enable fats and cholesterol to move within the aqueous environment of your lymphatic and circulatory systems. Chylomicrons leave the
enterocytes by exocytosis and enter the lymphatic system via lacteals in the villi of the intestine. From the lymphatic system, the chylomicrons are transported to the circulatory system. Once in the circulation, they can either go to the liver or be stored in fat cells (adipocytes) that comprise adipose (fat) tissue found throughout the body.
Chylomicrons
Chylomicrons contain triglycerides, cholesterol molecules, and other apolipoproteins (protein molecules). They function to carry these water-insoluble molecules from the intestine, through the lymphatic system, and into the bloodstream, which carries the lipids to adipose tissue for storage.
Lipolysis
To obtain energy from fat, triglycerides must first be broken down by hydrolysis into their two principal components, fatty acids and glycerol. This process, called lipolysis, takes place in the cytoplasm. The resulting fatty acids are oxidized by β-oxidation into acetyl CoA, which is used by the Krebs cycle. The glycerol that is released from triglycerides after lipolysis directly enters the glycolysis pathway as DHAP. Because one triglyceride molecule yields three fatty acid molecules with as much as 16 or more carbons in each one, fat molecules yield more energy than carbohydrates and are an important source of energy for the human body. Triglycerides yield more than twice the energy per unit mass when compared to carbohydrates and proteins. Therefore, when glucose levels are low, triglycerides can be converted into acetyl CoA molecules and used to generate ATP through aerobic respiration.
The breakdown of fatty acids, called fatty acid oxidation or beta (β)-oxidation, begins in the cytoplasm, where fatty acids are converted into fatty acyl CoA molecules. This fatty acyl CoA combines with carnitine to create a fatty acyl carnitine molecule, which helps to transport the fatty acid across the mitochondrial membrane. Once inside the mitochondrial matrix, the fatty acyl carnitine molecule is converted back into fatty acyl CoA and then into acetyl CoA (Figure). The newly formed acetyl CoA enters the Krebs cycle and is used to produce ATP in the same way as acetyl CoA derived from pyruvate.
Star:t
+ g
Fatty acid
R- CH2- CH2- CH2- C- OH
Fatty acyl carnitineenters mitochondrial matrix
♦
H, C-• I - CH, - 6 H- CH, - COO-+ HS--CoA
CH, Fatty acylcarnitine
I
0
CH3
r
O= C
R
yIH2
CH3 Carnitine
Fatty acyl CoA
_
- I 3 I
C- CH2- CH2- CH2- R • H,c - 7 - c H,- CH- CH, - Coo :,
II
0
0
II
C- CH2- CH2- CH2- R
Fatty acid
OH
CH
HS--CoA
1)Converting a fatty acid tofatty acyl carniitne allows transportthroughthe mitochondriaml embranes.
2) Fatty acyl carnitine is convretedback tofatty acyl CoA within amitochondiron. R rI r HS--CoA 0 yH2 CoA-S- II - CH - CH - CH - R C 2 2 2 \ o=c Fatty acylCoA | |
I I H ,c - 7 - c H, - CH- CH, - Coo • HS--CoA CH3 Fatty acyl carnitine | |
II II
0
CoA- S- C- CH2 - C- CH2- R
0
Trans-enoyl CoA
2
I I ,(
H 0-1!:!)
Fattyacyl CoA
CoA-s-g J j; CH - R
CoA-S - C-, - cH, - R
0 H
II II
0
CoA-S - g - c@- c@- cH , - R
FAD' FAD,H
- ca: n \d?
FADH2
FAD'
3) Fatty acyl CoA isconverted to -ketoacyl CoA, which is split intoan Acyl CoA and Acetyl CoA
0
0 0
II II
CoA-S - C- CH2- R CoA- S- C- CH2
AcylCoA Acetyl CoA (with shortened carbon chain)
HS--CoA
II
S-CoA- C- CH3
End: Acetyl CoA enters
Krebs cycle
♦
©
During fatty acid oxidation, triglycerides can be broken down into acetyl CoA molecules and used for energy when glucose levels are low.
Ketogenesis
If excessive acetyl CoA is created from the oxidation of fatty acids and the Krebs cycle is overloaded and cannot handle it, the acetyl CoA is diverted to create ketone bodies. These ketone bodies can serve as a fuel source if glucose levels are too low in the body. Ketones serve as fuel in times of prolonged starvation or when patients suffer from uncontrolled diabetes and cannot utilize most of the circulating glucose. In both cases, fat stores are liberated to generate energy through the Krebs cycle and will generate ketone bodies when too much acetyl CoA accumulates.
In this ketone synthesis reaction, excess acetyl CoA is converted into hydroxymethylglutaryl CoA (HMG CoA). HMG CoA is a precursor of cholesterol and is an intermediate that is subsequently converted into β-hydroxybutyrate, the primary ketone body in the blood (Figure).
Ketogenesis
Excess acetyl CoA is diverted from the Krebs cycle to the ketogenesis pathway. This reaction occurs in the mitochondria of liver cells. The result is the production of β-hydroxybutyrate, the primary ketone body found in the blood.
Ketone Body Oxidation
Organs that have classically been thought to be dependent solely on glucose, such as the brain, can actually use ketones as an alternative energy source. This keeps the brain functioning when glucose is limited. When ketones are produced faster than they can be used, they can be broken down into CO2 and acetone. The acetone is removed by exhalation. One symptom of ketogenesis is that the patient’s breath smells sweet like alcohol. This effect provides one way of telling if a diabetic is properly controlling the disease. The carbon dioxide produced can acidify the blood, leading to diabetic ketoacidosis, a dangerous condition in diabetics.
Ketones oxidize to produce energy for the brain. beta (β)-hydroxybutyrate is oxidized to acetoacetate and NADH is released. An HS-CoA molecule is added to acetoacetate, forming acetoacetyl CoA. The carbon within the acetoacetyl CoA that is not bonded to the CoA then detaches, splitting the molecule in two. This carbon then attaches to another free HS-CoA, resulting in two acetyl CoA molecules. These two acetyl CoA molecules are then processed through the Krebs cycle to generate energy (Figure).
Ketone Oxidation
When glucose is limited, ketone bodies can be oxidized to produce acetyl CoA to be used in the Krebs cycle to generate energy.
Lipogenesis
When glucose levels are plentiful, the excess acetyl CoA generated by glycolysis can be converted into fatty acids, triglycerides, cholesterol, steroids, and bile salts. This process, called lipogenesis, creates lipids (fat) from the acetyl CoA and takes place in the cytoplasm of adipocytes (fat cells) and hepatocytes (liver cells). When you eat more glucose or carbohydrates than your body needs, your system uses acetyl CoA to turn the excess into fat. Although there are several metabolic sources of acetyl CoA, it is most commonly derived from glycolysis. Acetyl CoA availability is significant, because it initiates lipogenesis. Lipogenesis begins with acetyl CoA and advances by the subsequent addition of two carbon atoms from another acetyl CoA; this process is repeated until fatty acids are the appropriate length. Because this is a bond-creating anabolic process, ATP is consumed. However, the creation of triglycerides and lipids is an efficient way of storing the energy available in carbohydrates. Triglycerides and lipids, high- energy molecules, are stored in adipose tissue until they are needed.
Although lipogenesis occurs in the cytoplasm, the necessary acetyl CoA is created in the
mitochondria and cannot be transported across the mitochondrial membrane. To solve this problem, pyruvate is converted into both oxaloacetate and acetyl CoA. Two different enzymes are required for these conversions. Oxaloacetate forms via the action of pyruvate carboxylase, whereas the action of pyruvate dehydrogenase creates acetyl CoA. Oxaloacetate and acetyl CoA combine to form citrate, which can cross the mitochondrial membrane and enter the cytoplasm. In the cytoplasm, citrate is converted back into oxaloacetate and acetyl CoA. Oxaloacetate is converted into malate and then into pyruvate. Pyruvate crosses back across the mitochondrial membrane to wait for the next cycle of lipogenesis. The acetyl CoA is converted into malonyl CoA that is used to synthesize fatty acids. Figure summarizes the pathways of lipid metabolism.
Lipid Metabolism
Lipids may follow one of several pathways during metabolism. Glycerol and fatty acids follow different pathways.
Carbohydrates for Energy
Carbohydrates are organic molecules composed of carbon, hydrogen, and oxygen atoms. The family of carbohydrates includes both simple and complex sugars. Glucose and fructose are examples of simple sugars, and starch, glycogen, and cellulose are all examples of complex sugars. The complex sugars are also called polysaccharides and are made of multiple monosaccharide molecules. Polysaccharides serve as energy storage (e.g., starch and glycogen) and as structural components (e.g., chitin in insects and cellulose in plants).
During digestion, carbohydrates are broken down into simple, soluble sugars that can be transported across the intestinal wall into the circulatory system to be transported throughout the body. Carbohydrate digestion begins in the mouth with the action of salivary amylase on starches and ends with monosaccharides being absorbed across the epithelium of the small intestine. Once the absorbed monosaccharides are transported to the tissues, the process of cellular respiration begins (Figure). This section will focus first on glycolysis, a process where the monosaccharide glucose is oxidized, releasing the energy stored in its bonds to produce ATP.
Web Links
Macros for an athlete
Cellular Respiration
Cellular respiration oxidizes glucose molecules through glycolysis, the Krebs cycle, and oxidative phosphorylation to produce ATP.
Glycolysis
Glucose is the body’s most readily available source of energy. After digestive processes break polysaccharides down into monosaccharides, including glucose, the monosaccharides are transported across the wall of the small intestine and into the circulatory system, which transports them to the liver. In the liver, hepatocytes either pass the glucose on through the circulatory system or store excess glucose as glycogen. Cells in the body take up the circulating glucose in response to insulin and, through a series of reactions called glycolysis, transfer some of the energy in glucose to ADP to form ATP (Figure). The last step in glycolysis produces the product pyruvate.
Glycolysis begins with the phosphorylation of glucose by hexokinase to form glucose-6- phosphate. This step uses one ATP, which is the donor of the phosphate group. Under the action of phosphofructokinase, glucose-6-phosphate is converted into fructose-6-phosphate. At this point, a second ATP donates its phosphate group, forming fructose-1,6-bisphosphate. This six-carbon sugar is split to form two phosphorylated three-carbon molecules, glyceraldehyde-3- phosphate and dihydroxyacetone phosphate, which are both converted into glyceraldehyde-3- phosphate. The glyceraldehyde-3-phosphate is further phosphorylated with groups donated by dihydrogen phosphate present in the cell to form the three-carbon molecule 1,3- bisphosphoglycerate. The energy of this reaction comes from the oxidation of (removal of electrons from) glyceraldehyde-3-phosphate. In a series of reactions leading to pyruvate, the two phosphate groups are then transferred to two ADPs to form two ATPs. Thus, glycolysis uses two ATPs but generates four ATPs, yielding a net gain of two ATPs and two molecules of pyruvate. In the presence of oxygen, pyruvate continues on to the Krebs cycle (also called the citric acid cycle or tricarboxylic acid cycle (TCA), where additional energy is extracted and passed on.
Glycolysis Overview
During the energy-consuming phase of glycolysis, two ATPs are consumed, transferring two phosphates to the glucose molecule. The glucose molecule then splits into two three-carbon compounds, each containing a phosphate. During the second phase, an additional phosphate is
added to each of the three-carbon compounds. The energy for this endergonic reaction is provided by the removal (oxidation) of two electrons from each three-carbon compound. During the energy-releasing phase, the phosphates are removed from both three-carbon compounds and used to produce four ATP molecules.
This equation states that glucose, in combination with ATP (the energy source), NAD+ (a coenzyme that serves as an electron acceptor), and inorganic phosphate, breaks down into two pyruvate molecules, generating four ATP molecules—for a net yield of two ATP—and two energy-containing NADH coenzymes. The NADH that is produced in this process will be used later to produce ATP in the mitochondria. Importantly, by the end of this process, one glucose molecule generates two pyruvate molecules, two high-energy ATP molecules, and two electron- carrying NADH molecules.
The following discussions of glycolysis include the enzymes responsible for the reactions. When glucose enters a cell, the enzyme hexokinase (or glucokinase, in the liver) rapidly adds a phosphate to convert it into glucose-6-phosphate. A kinase is a type of enzyme that adds a phosphate molecule to a substrate (in this case, glucose, but it can be true of other molecules also). This conversion step requires one ATP and essentially traps the glucose in the cell, preventing it from passing back through the plasma membrane, thus allowing glycolysis to proceed. It also functions to maintain a concentration gradient with higher glucose levels in the blood than in the tissues. By establishing this concentration gradient, the glucose in the blood will be able to flow from an area of high concentration (the blood) into an area of low concentration (the tissues) to be either used or stored. Hexokinase is found in nearly every tissue in the body. Glucokinase, on the other hand, is expressed in tissues that are active when blood glucose levels are high, such as the liver. Hexokinase has a higher affinity for glucose than glucokinase and therefore is able to convert glucose at a faster rate than glucokinase. This is important when levels of glucose are very low in the body, as it allows glucose to travel preferentially to those tissues that require it more.
In the next step of the first phase of glycolysis, the enzyme glucose-6-phosphate isomerase converts glucose-6-phosphate into fructose-6-phosphate. Like glucose, fructose is also a six carbon-containing sugar. The enzyme phosphofructokinase-1 then adds one more phosphate to convert fructose-6-phosphate into fructose-1-6-bisphosphate, another six-carbon sugar, using another ATP molecule. Aldolase then breaks down this fructose-1-6-bisphosphate into two three-carbon molecules, glyceraldehyde-3-phosphate and dihydroxyacetone phosphate. The triosephosphate isomerase enzyme then converts dihydroxyacetone phosphate into a second glyceraldehyde-3-phosphate molecule. Therefore, by the end of this chemical-priming or energy-consuming phase, one glucose molecule is broken down into two glyceraldehyde-3- phosphate molecules.
The second phase of glycolysis, the energy-yielding phase, creates the energy that is the product of glycolysis. Glyceraldehyde-3-phosphate dehydrogenase converts each three-carbon glyceraldehyde-3-phosphate produced during the energy-consuming phase into 1,3- bisphosphoglycerate. This reaction releases an electron that is then picked up by NAD+ to
create an NADH molecule. NADH is a high-energy molecule, like ATP, but unlike ATP, it is not used as energy currency by the cell. Because there are two glyceraldehyde-3-phosphate molecules, two NADH molecules are synthesized during this step. Each 1,3-bisphosphoglycerate is subsequently dephosphorylated (i.e., a phosphate is removed) by phosphoglycerate kinase into 3-phosphoglycerate. Each phosphate released in this reaction can convert one molecule of ADP into one high-energy ATP molecule, resulting in a gain of two ATP molecules.
The enzyme phosphoglycerate mutase then converts the 3-phosphoglycerate molecules into 2- phosphoglycerate. The enolase enzyme then acts upon the 2-phosphoglycerate molecules to convert them into phosphoenolpyruvate molecules. The last step of glycolysis involves the dephosphorylation of the two phosphoenolpyruvate molecules by pyruvate kinase to create two pyruvate molecules and two ATP molecules.
In summary, one glucose molecule breaks down into two pyruvate molecules, and creates two net ATP molecules and two NADH molecules by glycolysis. Therefore, glycolysis generates energy for the cell and creates pyruvate molecules that can be processed further through the aerobic Krebs cycle (also called the citric acid cycle or tricarboxylic acid cycle); converted into lactic acid or alcohol (in yeast) by fermentation; or used later for the synthesis of glucose through gluconeogenesis.
Anaerobic Respiration
When oxygen is limited or absent, pyruvate enters an anaerobic pathway. In these reactions, pyruvate can be converted into lactic acid. In addition to generating an additional ATP, this pathway serves to keep the pyruvate concentration low so glycolysis continues, and it oxidizes NADH into the NAD+ needed by glycolysis. In this reaction, lactic acid replaces oxygen as the final electron acceptor. Anaerobic respiration occurs in most cells of the body when oxygen is limited or mitochondria are absent or nonfunctional. For example, because erythrocytes (red blood cells) lack mitochondria, they must produce their ATP from anaerobic respiration. This is an effective pathway of ATP production for short periods of time, ranging from seconds to a few minutes. The lactic acid produced diffuses into the plasma and is carried to the liver, where it is converted back into pyruvate or glucose via the Cori cycle. Similarly, when a person exercises, muscles use ATP faster than oxygen can be delivered to them. They depend on glycolysis and lactic acid production for rapid ATP production.
Aerobic Respiration
In the presence of oxygen, pyruvate can enter the Krebs cycle where additional energy is extracted as electrons are transferred from the pyruvate to the receptors NAD+, GDP, and FAD, with carbon dioxide being a “waste product” (Figure). The NADH and FADH2 pass electrons on to the electron transport chain, which uses the transferred energy to produce ATP. As the terminal step in the electron transport chain, oxygen is the terminal electron acceptor and creates water inside the mitochondria.
Aerobic versus Anaerobic Respiration
The process of anaerobic respiration converts glucose into two lactate molecules in the absence of oxygen or within erythrocytes that lack mitochondria. During aerobic respiration, glucose is oxidized into two pyruvate molecules.
In cardiorespiratory fitness, the objective of the exercise is to stimulate the cardiorespiratory system. Other activities that accomplish the same objective include swimming, biking, dancing, cross country skiing, aerobic classes, and much more. As such, these activities can be used to build lung capacity and improve cellular and heart function.
However, the more specific the exercise, the better. While vigorous ballroom dancing will certainly help develop the cardiorespiratory system, it will unlikely improve a person’s 10k time. To improve performance in a 10k, athletes spend the majority of their time training by running, as they will have to do in the actual 10k. Cyclists training for the Tour de France, spend up to six hours a day in the saddle, peddling feverishly. These athletes know the importance of training the way they want their body to adapt. This concept, called the principle of specificity, should be taken into consideration when creating a training plan.
In this discussion of type and the principle of specificity, a few additional items should be considered. Stress, as it relates to exercise, is very specific. There are multiple types of stress. The three main stressors are metabolic stress, force stress, and environmental stress. Keep in mind, the body will adapt based on the type of stress being placed on it.
Metabolic stress results from exercise sessions when the energy systems of the body are taxed. For example, sprinting short distances requires near maximum intensity and requires energy (ATP) to be produced primarily through anaerobic pathways, that is, pathways not requiring oxygen to produce ATP. Anaerobic energy production can only be supported for a very limited time (10 seconds to 2 minutes). However, distance running at steady paces requires aerobic energy production, which can last for hours. As a result, the training strategy for the distance runner must be different than the training plan of a sprinter, so the energy systems will adequately adapt.
Likewise, force stress accounts for the amount of force required during an activity. In weightlifting, significant force production is required to lift heavy loads. The type of muscles being developed, fast-twitch muscle fibers, must be recruited to support the activity. In walking and jogging, the forces being absorbed come from the body weight combined with forward momentum. Slow twitch fibers, which are unable to generate as much force as the fast twitch fibers, are the type of muscle fibers primarily recruited in this activity. Because the force requirements differ, the training strategies must also vary to develop the right kind of musculature.
Environmental stress, such as exercising in the heat, places a tremendous amount of stress on the thermoregulatory systems. As an adaptation to the heat, the amount of sweating increases as does plasma volume, making it much easier to keep the body at a normal temperature during exercise. The only way to adapt is through heat exposure, which can take days to weeks to properly adapt.
In summary, to improve performance, being specific in your training, or training the way you want to adapt, is paramount.
References & Links
Links
http://extension.colostate.edu/topic-areas/nutrition-food-safety-health/nutrition-for-the- athlete-9-362/
Video
Sugar or Fat Video: https://www.youtube.com/watch?v=uWSt-AsqYRU
Nutrition for Fitness/Athletes
Vitamins, minerals and supplements for Athletes
Vitamins, minerals and supplements for the body are essential for most bodily functions so if an athlete speeds this body process up it becomes essentially more important for athletes to maintain a balance. Most of the vitamin and mineral levels could be met through a balanced diet using a variety of foods.
Vitamins needed for activity:
B Vitamin:
The B vitamin group is known for giving energy by converting protein and sugar into energy. Athletes looking for more energy during high-intensity exercises should look for foods with more B6, B12, thiamin, riboflavin (especially females) and folate. This conversion into energy could include the production red blood cells which would have an obvious benefit in long-endurance activities, using the aerobic system. Given the water soluble nature of the B vitamin group there is not a risk for excess/toxicity.
Vitamin D:
Due to the importance of vitamin D in the diet in the roll of the absorption of calcium, athletes who play sports with weight bearing stress, especially those played indoors should make sure that the amount of vitamin D in the diet is sufficient to overcome the stress placed on the bones.
Vitamin E:
Vitamin E can lessen the stress placed on the body during the oxidative stress. The stress can lower immunity, so taking vitamin E can increase the immune system which can lessen the risk of of getting sick.
Vitamin C:
Water soluble vitamin C will help for reducing coughing, wheezing and shortness of breath during or post exercise. Taking large amounts 600-1000 mg of vitamin C can reduce the incidences of athletic-induced asthma.
Minerals needed for activity:
Calcium:
Most activities and sports are reliant upon a strong skeletal system. The absorption of calcium is important for bone density. This absorption of calcium is dependent on absorbing vitamin D also. Great sources of vitamin D and calcium together are in milk. According to the American Academy of Physical Medicine and Rehabilitation stress fracture could be reduced by 62 percent through an extra cup of skim milk per day. Significantly improving skeletal bone density has an obvious effect on performance, especially on those using repetitive movements that place a large amount stress on the skeletal system.
Iron:
The mineral iron will help red blood cells bring oxygen to muscles. Exercise can lead to a
large drop in iron which can lead to anemia. Having low level of iron can lead to energy levels to drop, especially in endurance activities. Females, due to menstruation can have a higher risk of iron deficiencies which can lead to amenorrhea (loss of period) so that they will conserve iron.
Magnesium:
The component of energy metabolism, magnesium, has a role in energy as well as bone formation. Magnesium, as sodium does, is lost through sweat, therefore the longer the duration or the higher the intensity or higher temperatures can lead to both magnesium and sodium level deficiencies.
Sodium:
As one of the electrolytes, the maintenance of hydration is dependent on the levels of
sodium in the body. A low concentration of sodium in the blood can lead to hyponatremia and if one is to replace all fluids by just water alone can be bad for performance, recovery and can be fatal in some cases. Athletes that produce a lot of sweat or perform long endurance activities will need to replace the sodium, possibly during exercise.
Potassium:
Because potassium is essential as the other electrolyte, it keeps the balance of water in the body as sodium does and intake will help prevent cramps and will help with post workout recovery. It keeps intracellular fluid, helping balance water in the body so it is essential either during exercise or post exercise.
Supplements possibly needed for activity:
Branched-chain amino acids (leucine, isoleucine, and valine)_
Can be metabolized by Limited number of short-term clinical No safety concerns reported for 20 g/day or less for up to 6 mitochondria in skeletal muscle trials weeks
to provide energy during exercise
Blocks activity of the neuromodulator adenosine; reduces perceived pain and exertion
Research findings: Little evidence Reported adverse effects: None known
of improved performance in endurance-related aerobic events; possibility of greater gains in muscle mass and strength during training
Numerous clinical trials with mostly Reasonably safe at up to 400-500 mg/day for adults consistent results
Reported adverse effects: Insomnia, restl essness,
Research findings: Might enhance nausea, vomiting, tachycardia, and arrhythmia; risk of death
performance in endurance-type activities (e.g., running) and
intermi ttent, long-duration activities (e.g., soccer) when taken before activity
Dilates blood vessels to increase Few clinical trials with conflicting delivery of oxygen and nutrients results
to skeletal muscle
with acute oral dose of approximately 10-14 g pure caffeine (150- 200 mg/kg)
Few safety concerns reported for up to 9 g for 1 day or 6 g/day for up to 16 days
Research findings: Little research Reported adverse effects: Gastrointestinal discomfort support for use to enhance
performance
Helps supply muscles with energy for short-term,
Numerous clinical trials generally showing a benefit for high-intensity ,
Few safety concerns reported at typical dose (e.g., loading dose of 20 g/day for up to 7 days and 3-5 g/day for up to 12
Deer antler velvet
predominantly anaerobic activity intermittent activity; potential
variation in individual responses
Research findings: May increase strength , po wer, and work from maximal effort muscle contractions; over time helps body adapt to athlete-training regimens; of little value for endurance sports
Contains growth factors (such as Few short-term clinical trials that insulin-like growth factor-1 [IGF- show no benefit for physical
weeks)
Reported adverse effects: Weight gain due to water retention ; anecdotal reports of nausea, diarrhea, muscle cramps , muscle stiffness , heat intolerance
Safety not well studied
11) that could promote muscle tissue growth
performance
Research findings: No evidence for improving aerobic or anaerobic performance , muscular strength , or endurance
Reported adverse effects: Hypoglycemia, headache, edema, and joint pain (from prescription IGF-1); banned in professional athletic competition
DehydroeRiandrosterone Steroid hormone that can be Small number of clinical trials that
_ (DHEA )_ converted into testosterone and show no benefit for physical estradiol performance
Safety not well studied; no safety concerns reported for up to 150 mg/day for 6-12 weeks
Reported adverse effects: Over several months, raises
Research findings: No evidence of testosterone levels in women, which can cause acne and increases in strength, aerobic growth of facial hair
capacity, lean body mass, or testosterone levels in men
Ginseng Unknown mechanism of action; Numerous small clinical trials, most Few safety concerns reported with short-term use
Panax ginseng used in traditional showing no benefit for physical
Chinese medicine as a tonic for performance stamina and vitality; Siberian
Reported adverse effects: For Panax ginseng: headache, sleep disturbances, and gastrointestinal disorders; for
ginseng used to reduce fatigue
Research findings: In various Siberian ginseng: none known doses and types of preparations, no
effects on peak power output, time to exhaustion , perceived exertio n, recovery from intense activity, oxygen consumption, or heart rate
Glutamine Involved in metabolism and energy production; contributes nitrogen for many critical
Few studies of use to enhance performance directly
No safety concerns reported with about 45 g/day for 6 weeks; safe use of up to 0.42 g/kg body weight (e.g., 30 g/day in a person weighing 154 lb) by many patients with
biochemical reactions
Research findings: In adult weight serious conditions (e.g., infec tions, intestinal diseases, and lifters, no effect on muscle burns)
performance , body composition, or
Increases oxygen uptake, reduces heart rate, and
muscle-protein degradation; may help with recovery of muscle strength and reduce muscle soreness after exercise
Numerous clinical trials with conflicting results
Reported adverse effects: None known
No safety concerns reported for use at recommended intakes (8 mg/day for healthy men and postmenopausal
decreases lactate concentrations women and 18 mg/day for healthy premenopausal women) during exercise Research findings: Improved work
Builds, maintains, and repairs muscle
capacity with correction of iron deficiency anemia; conflicting evidence on whether milder iron deficiency without anemia impairs exercise performance
Numerous clinical trials
Research findings: Optimizes muscle training response during exercise and subsequent recovery period
Reported adverse effects: Gastric upset, constipation, nausea, abcominal pain, vomiting, and fainting at intakes above 45 mg/day
No safety concerns reported at daily recommended intakes for athletes of up to about 2.0 g/kg body weight (e.g., 136 g for a person weighing 150 lb)
Reported adverse effects: None known
Increases mitochondria in Numerous small, short-term clinical No safety concerns reported for 1,000 mg/day or less for up muscle, reduces oxidative stress, trials to 8 weeks
decreases inflammation, and
improves blood flow
Involved in production of adenosine triphosphate (ATP)
Research findings: Little to no effect on endurance performance or maximal oxygen consumption
A few small, short-term, clinical trials
Reported adverse effects: None known
Safety as a dietary supplement not well studied; no safety concerns reported for up to 1O g/day for 8 weeks
Research findings: Little to no effect on exercise capacity in both trained and untrained adults
Reported adverse effects: None known
Sodium bicarbonate Enhances disposal of hydrogen
ions generated from intense muscle activity, thereby reducing
Many small, short-term clinical trials No safety concerns reported for short-term use of up to 300 mg/kg body weight
Research findings: Might provide
metabolic acidosis and resulting minor to moderate performance fatigue benefit for short-term and
intermittent high-intensity activity, especially in trained athletes
Reported adverse effects: Nausea , stomach pain , diarrhea, and vomiting
https://ods.od.nih.gov/factsheets/ExerciseAndAthleticPerformance-HealthProfessional/
Web Links
5 great supplements for athletes
References & Links
1. Exercise and Athletic Performance: https://ods.od.nih.gov/factsheets/ExerciseAndAthleticPerformance-HealthProfessional/
Links
http://extension.colostate.edu/topic-areas/nutrition-food-safety-health/nutrition-for-the- athlete-9-362/
https://ods.od.nih.gov/factsheets/ExerciseAndAthleticPerformance-HealthProfessional/
Video
Sugar or Fat Video: https://www.youtube.com/watch?v=uWSt-AsqYRU
Nutrition for Fitness/Athletes
Fluids and Electrolytes to Support Activity
Water is a very important micronutrient for athletes. Activity will lead to fluid loss and will lead to dehydration very quickly after exercise. A very good practice for athletes is to weigh themselves pre/post exercise. This practice will help monitor the amount of sweat that is lost during exercise. This practice can also be used to monitor the amount of sodium and potassium that is being lost during exercise.
Water needed for activity:
Avoiding dehydration could be done by drinking 5 to 7 mL per kilogram of body mass about four hours prior to the athletic event. Drinking water intermittently during exercise will help match the sweat that is being lost during exercise.
Weighing pre and post exercise can be a beneficial for replenishing the amount of water that is lost. An athlete should be replenishing 16-24oz per pound that is lost during exercise. If an athlete gains weight during activity this can be a sign of excess hydration which can show electrolyte imbalance and hyponatremia (Clifford and Maloney, 2015)
Electrolyte drinks help replenish the minerals lost during exercise. Shirreffs and Sawka had a study where:
Fluids and electrolytes (sodium) are consumed by athletes, or recommended to athletes, for a number of reasons, before, during, and after exercise. These reasons are generally to sustain total body water, as deficits (hypohydration) will increase cardiovascular and thermal strain and degrade aerobic performance. Vigorous exercise and warm/hot weather induce sweat production, which contains both water and electrolytes. Daily water (4-10 L) and sodium (3500-7000 mg) losses in active athletes during hot weather exposure can induce water and electrolyte deficits. Both water and sodium need to be replaced to re-establish "normal" total body water (euhydration). This replacement can be by normal eating and drinking practices if there is no urgency for recovery. But if rapid recovery (<24 h) is desired or severe hypohydration (>5% body mass) is encountered, aggressive drinking of fluids and consuming electrolytes should be encouraged to facilitate recovery for subsequent competition.
Vitamin D:
Web Links
Trade Sports Drink for Water Potassium: Important Electrolyte
References & Links
Links
https://www.health.harvard.edu/blog/trade-sports-drinks-for-water-201207305079 https://ods.od.nih.gov/factsheets/ExerciseAndAthleticPerformance-HealthProfessional/
Video
https://www.youtube.com/watch?v=q2vPQYP0dpI
Nutrition for Fitness/Athletes
Diets for Physically Active People
Timing, amount of food and quality of food is very important for an athlete’s performance and recovery post exercise. In order for athletes to properly fuel themselves for exercise and not see long periods of
Water needed for activity:
Avoiding dehydration could be done by drinking 5 to 7 mL per kilogram of body mass about four hours prior to the athletic event. Drinking water intermittently during exercise will help match the sweat that is being lost during exercise.
Weighing pre and post exercise can be a beneficial for replenishing the amount of water that is lost. An athlete should be replenishing 16-24oz per pound that is lost during exercise. If an athlete gains weight during activity this can be a sign of excess hydration which can show electrolyte imbalance and hyponatremia (Clifford and Maloney, 2015)
Electrolyte drinks help replenish the minerals lost during exercise. Shirreffs and Sawka had a study where:
Fluids and electrolytes (sodium) are consumed by athletes, or recommended to athletes, for a number of reasons, before, during, and after exercise. These reasons are generally to sustain total body water, as deficits (hypohydration) will increase cardiovascular and thermal strain and degrade aerobic performance. Vigorous exercise and warm/hot weather induce sweat production, which contains both water and electrolytes. Daily water (4-10 L) and sodium (3500-7000 mg) losses in active athletes during hot weather exposure can induce water and electrolyte deficits. Both water and sodium need to be replaced to re-establish "normal" total body water (euhydration). This replacement can be by normal eating and drinking practices if there is no urgency for recovery. But if rapid recovery (<24 h) is desired or severe hypohydration (>5% body mass) is encountered, aggressive drinking of fluids and consuming electrolytes should be
encouraged to facilitate recovery for subsequent competition.
Web Links
Trade Sports Drink for Water
References & Links
Links
https://www.health.harvard.edu/blog/trade-sports-drinks-for-water-201207305079 https://ods.od.nih.gov/factsheets/ExerciseAndAthleticPerformance-HealthProfessional/
CHAPTER 20: Nutrition and Society: Food Politics and Perspectives
Adapted from: Zimmerman and Snow. “An Introduction to Nutrition” v. 1.0. Accessed on February 22, 2018. https://2012books.lardbucket.org/books/an-introduction-to-nutrition/
Sections:
As discussed in previous chapters, sustainability is a word that’s often talked about in the realm of food and nutrition. The term relates to the goal of achieving a world that meets the needs of its present inhabitants while preserving resources for future generations. As awareness about sustainability has increased among the media and the public, both agricultural producers and consumers have made more of an effort to consider how the choices they make today will impact the planet tomorrow.
Raising free-range chickens that feed out in the open is one example of a sustainable agricultural practice. © Thinkstock
However, defining sustainability can be difficult because the term means different things to different groups. For most, sustainable agriculture can best be described as an umbrella term that encompasses food production and consumption practices that do not harm the environment, that do support agricultural communities, and that are healthy for the consumer.1 From factory farms to smaller-scale ranches and granges, sustainable farming
practices are being implemented more and more as the long-term viability of the current production system has been called into question.
Yet, the concept of sustainability is not new to agricultural science, practice, or even policy. It has evolved throughout modern history as a way to achieve self-reliance. It is also a vehicle for maintaining rural communities and supporting the concept of conservation and protection of the land.2 In 1990, the US federal government defined sustainable agriculture in a piece of legislation known as the Farm Bill. The practice was described as an integrated system of plant and animal production that satisfies human needs for food, along with fiber for fabric and other uses. The Farm Bill further defines sustainable agriculture as a practice that enhances environmental quality and also the natural resource base upon which the agricultural economy depends. Sustainable agriculture also makes the most efficient use of nonrenewable resources, sustains the economic viability of farm operations, and supports the quality of life for farmers and society as a whole.3
In other words, the practice of sustainable agriculture strives to eschew conventional farming methods, including the cultivation of single crops and row crops continuously over many seasons, the dependency on agribusiness, and the rearing of livestock in concentrated, confined systems.3 Instead, sustainability includes a focus on biodiversity among both crops and livestock; conservation and preservation to replenish the soil, air, and water; animal welfare; and fair treatment and wages for farm workers.4 Sustainable agriculture also encourages the health of consumers by rejecting extensive use of pesticides and fertilizers and promoting the consumption of organic, locally produced food. Although many farmers and food companies work to implement these practices, some use the idea of sustainability to attract consumers
without completely committing to the concept. “Greenwashing” is a derisive term (similar to “whitewashing”) for a corporation or industry falsely utilizing a pro-environmental image or message to expand its market base.
Sustainability depends not only on agricultural producers, but also on consumers. The average person can do a number of things to consume a more sustainable diet, from eating less meat to purchasing fruits and vegetables grown on nearby farms. For example, produce sold in the Midwest typically travels an average of more than fifteen hundred miles from farm to supermarket. However, increasing the consumption of more locally-grown produce by 10 percent would save thousands of gallons in fossil fuel each year.5
Some consumers are choosing to make smarter nutritional choices, eat healthier foods, and enjoy fresh, locally grown products. They read the labels on products in their local stores, make more home-cooked meals using whole-food ingredients, and pay attention to the decisions that legislators and other officials make regarding food production and consumption. Will you be one of them? How you can adjust your dietary selections to benefit not only your body and mind but also to help sustain the planet for future generations?
Required Video 20.1
Green Careers: Sustainable Agriculture - http://www.youtube.com/v/9rG3SBQYOms
References and Links
1Sustainable Table. “Introduction to Sustainability.” Accessed October 10, 2011. http://www.sustainabletable.org/intro/.
2Ecological Agriculture Projects. “A History of Sustainable Agriculture.” © 1990 Rod MacRae. http://eap.mcgill.ca/AASA_1.htm.
3Gold, M.V. “Sustainable Agriculture: Definitions and Terms.” US Department of Agriculture, National Agricultural Library. Special Reference Briefs Series no. SRB 99-02 (September 1999, August 2007). http://www.nal.usda.gov/afsic/pubs/terms/srb9902.shtml#toc1.
4Sustainable Table. “What Is Sustainable Agriculture?” Accessed October 10, 2011. http://www.sustainabletable.org/intro/whatis/.
5Heller, M. C., G. A. Keoleian. “US Food System Factsheet.” Center for Sustainable Systems, University of Michigan.
CSS Factsheets, no. CSS01-06 (2001). http://www.css.snre.umich.edu/publication/css-factsheets-us-food-system.
Video Links
Green Careers: Sustainable Agriculture - http://www.youtube.com/v/9rG3SBQYOms
Throughout history, our relationship with food has been influenced by changing practices and perspectives. From the invention of agriculture to the birth of refrigeration, technological advances have also affected what we eat and how we feel about our food. Therefore, it can be helpful to examine theories and customs related to diet and nutrition across different civilizations and time periods.
Civilizations and Time Periods
Diet and cuisine have undergone enormous changes from ancient times to today. The basic diet of the ancient era consisted of cereals, legumes, oil, and wine. These staples were supplemented by vegetables and meat or fish, along with other items, such as honey and salt. During the middle ages, poor people consumed meager diets that consisted of small game supplemented with either barley, oat, or rye, while the wealthy had regular access to meat and fish, along with wheat.1 During the Industrial Revolution, diets became more varied, partly because of the development of refrigeration and other forms of food preservation. In the contemporary era, many people have access to a wide variety of food that is grown locally or shipped from far-off places.
Flatbread made from barley or wheat was a staple in the traditional diet during the ancient era. © Thinkstock
Hunters and Gatherers
Human beings lived as hunters and gatherers until the invention of agriculture. Following a nomadic lifestyle, early people hunted, fished, and gathered fruit and wild berries, depending on their location and the availability of wild plants and wild game. To aid their constant quest for food, humans developed weapons and tools, including spears, nets, traps, fishing tackle, and the bow and arrow.1
The Beginning of Agriculture
About ten thousand years ago, people began to cultivate crops and domesticate livestock in Mesopotamia, an area of the world that is known today as the Middle East. Agriculture flourished in this region due to the fertile floodplain between the Euphrates and Tigris Rivers, and early crops included wheat, barley, and dates. The development of agriculture not only enriched the diet of these early people, it also led to the birth of civilization as farmers began to settle into sizable, stable communities.2
One of the most fertile regions of the ancient world was located along the Nile River Valley in ancient Egypt. The rich soil yielded several harvests per year. Common crops were barley, wheat, lentils, peas, and cabbage, along with grapes, which were used to make wine. Even poor Egyptians ate a reasonably healthy diet that included fish, vegetables, and fruit. However, meat was primarily a privilege of the rich. Popular seasonings of this era included salt, pepper, cumin, coriander, sesame, fennel, and dill.3
Meals Determined Social Status
In ancient Rome, differences in social standing affected the diet. For people of all socioeconomic classes, breakfast and lunch were typically light meals that were often consumed in taverns and cafes. However, dinners were eaten at home and were taken much more seriously. Wealthy senators and landowners ate meals with multiple courses, including appetizers, entrees, and desserts. Rich Romans also held extravagant dinner parties, where guests dined on exotic foods, such as roasted ostrich or pheasant. In contrast, people of the lower classes ate mostly bread and cereals.4 The average person ate out of clay dishes, while wealthy people used bronze, gold, or silver.
Social status determined the kinds of food that people consumed in many other parts of the world as well. In ancient China, emperors used their wealth and power to hire the best chefs and acquire delicacies, such as honey, to sweeten food. Dishes of the ancient era included steamed Mandarin fish, rice and wheat noodles, and fried prawns. Imperial cuisine also included improved versions of dishes that were consumed by the common people, such as soups and cereals.5
The Medieval Era
The eating habits of most people during the Medieval Era depended mainly on location and financial status. In the feudal system of Europe, the majority of the population could not afford to flavor their food with extravagant spices or sugar. In addition, transporting food was either outrageously expensive or out of the question due to the inability to preserve food for a long period of time. As a result, the common diet consisted of either wheat, meat, or fish, depending on location. The typical diet of the lower classes was based on cereals and grains, porridge, and gruel. These staples were supplemented with seasonal fruits, vegetables, and herbs. Wine, beer, and cider were also common, and were often safer to drink than the un-sanitized, untreated water.
The Crusades
During the Medieval Era, soldiers from Europe waged war over religion in the Middle East in military campaigns that came to be known as the Crusades. Upon their return, the crusaders brought back new foods and spices, exposing Europeans of the middle ages to unusual flavors. Cooking with exotic spices, such as black pepper, saffron, and ginger, became associated with wealth because they were expensive and had to be imported.
Food Preservation in the Past
During the Medieval and Renaissance eras, most meals consisted of locally grown crops because it was extremely difficult to transport food over long distances. This was mostly due to an inability to preserve food for long periods. At that time, food preservation consisted mostly of drying, salting, and smoking. Pickling, which is also known as brining or corning, was another common practice and involved the use of fermentation to preserve food.
The Modern Era
The modern era began in North America and Europe with the dawn of the Industrial Age. Before that period, people predominantly lived in agrarian communities. Farming played an important role in the development of the United States and Canada. Almost all areas of the country had agrarian economies dictated by the harvesting seasons. In the 1800s, society began to change as new machines made it easier to cultivate crops, and to package, ship, and store food. The invention of the seed drill, the steel plow, and the reaper helped to speed up planting and harvesting. Also, food could be transported more economically as a result of developments in rail and refrigeration. These and other changes ushered in the modern era and affected the production and consumption of food.
Food Preservation in Modern Times
Technological innovations during the 1800s and 1900s also changed the way we cultivate, prepare, and think about food. The invention and refinement of the refrigerator and freezer made it possible for people to store food for much longer periods. This, in turn, allowed for the transportation of food over greater distances. For example, oranges grown in Florida would still be fresh when they arrived in Seattle.
Prior to refrigeration, people relied on a number of different methods to store and preserve food, such as pickling. Other preservation techniques included using sugar or honey, canning, and preparing a confit, which is one of the oldest ways to preserve food and involves salting meat and cooking it in its own fat. To store foods for long periods, people used iceboxes or kept vegetables, such as potatoes, onions, and winter squash, in cellars during the winter months.
The Great Depression
During the Great Depression of the 1930s, the United States faced incredible food shortages and many people went hungry. This was partly because extreme droughts turned parts of the Midwest into a Dust Bowl, where farmers struggled to raise crops. Millions of Americans were unemployed or underemployed and were forced to wait in long breadlines for free food. This was also a period of incredible reforms, as the government worked to provide for and protect the people. Some important changes included subsidies and support for suffering farmers.
World War II
Food shortages also occurred during World War II in the 1940s. At that time, people voluntarily made due with less to ensure that soldiers training and fighting overseas had the supplies they needed. To focus on saving at home, government programs included rationing food (particularly meat, butter, and sugar), while the media encouraged families to plant their own fruits and vegetables in “victory” (backyard) gardens.
Contemporary Life
Today, agriculture remains a large part of the economy in many developing nations. In fact, nearly 50 percent of the world’s labor is employed in agriculture.2 In the United States however, less than 2 percent of Americans produce food for the rest of the population.6 Also, most farms are no longer small-scale or family-owned. Large-scale agribusiness is typical for both crop cultivation and livestock rearing, including concentrated animal feeding operations. Conventional farming practices can include abuses to animals and the land. Therefore, more and more consumers have begun to seek out organic and locally grown foods from smaller- scale farms that are less harmful to the environment.
Other changes also affect food production and consumption in the modern era. The invention of the microwave in the 1950s spurred the growth of frozen foods and TV dinners. Appliances such as blenders and food processors, toasters, coffee and espresso machines, deep fryers, and indoor grills have all contributed to the convenience of food preparation and the kinds of meals that people enjoy cooking and eating.
Diet Trends over Time
Today, consumers can choose from a huge variety of dietary choices that were not available in the past. For example, strawberries can be purchased in New York City in wintertime, because they are quickly and easily transported from places where the crop is in season, such as California, Mexico, or South America. In the western world, especially in North America, food products are also relatively cheap. As a result, there is much less disparity between the diets of the lower and upper classes than in the past. It would not be unusual to find the same kind of meat or poultry served for dinner in a wealthy neighborhood as in a poorer community.
References and Links
1Our Food Recipes. “European Medieval Food.” © 2011–2012. http://www.our-food-recipes.com/medieval- food.html.
2Bioworld. “History of Agriculture.” Accessed October 10, 2011. http://www.bioworldusa.com/agriculture/history- agriculture.
3Experience Ancient Egypt. “Ancient Egyptian Food: The Pharaonic Diet.” © 2009–2011. http://www.experience-
ancient-egypt.com/ancient-egyptian-food.html.
4PBS. “Home Life.” The Roman Empire in the First Century. © 2006 Devillier Donegan Enterprises. http://www.pbs.org/empires/romans/empire/home.html.
5China.org. “The History of Chinese Imperial Cuisines.” © China Information Center. Accessed December 5, 2011. http://www.china.org.cn/english/imperial/25995.htm.
6Gold, M.V. “Sustainable Agriculture: Definitions and Terms.” US Department of Agriculture, National Agricultural Library. Special Reference Briefs Series no. SRB 99-02 (September 1999, August 2007). http://www.nal.usda.gov/afsic/pubs/terms/srb9902.shtml#toc1.
The Food Industry
Agriculture is one of the world’s largest industries. It encompasses trillions of dollars and employs billions of people. In the United States alone, customers spent about $500 billion annually on food products at grocery stores and supermarkets.1 The food industry includes a complex collective of businesses that touches on everything from crop cultivation to manufacturing and processing, from marketing and advertising to distribution and shipment, to food regulation.
The Food System
The food system is a network of farmers and related operations, including food processing, wholesale and distribution, retail, industry technology, and marketing. The milk industry, for example, includes everything from the farm that raises livestock, to the milking facility that extracts the product, to the processing company that pasteurizes milk and packages it into cartons, to the shipping company that delivers the product to stores, to the markets and groceries that stock and sell the product, to the advertising agency that touts the product to consumers. All of these components play a part in a very large system.
These cows are lined up at a milking facility. © Thinkstock
Food Preservation and Processing
Two important aspects of a food system are preservation and processing. Each provides for or protects consumers in different ways. Food preservation includes the handling or treating of food to prevent or slow down spoilage. Food processing involves transforming raw ingredients into packaged food, from fresh-baked goods to frozen dinners. Although there are numerous benefits to both, preservation and processing also pose some concerns, in terms of both nutrition and sustainability.
Food Preservation
Food preservation protects consumers from harmful or toxic food. There are different ways to preserve food. Some are ancient methods that have been practiced for generations, such as curing, smoking, pickling, salting, fermenting, canning, and preserving fruit in the form of jam. Others include the use of modern techniques and technology, including drying, vacuum packing, pasteurization, and freezing and refrigeration. Preservation guards against foodborne illnesses, and also protects the flavor, color, moisture content, or nutritive value of food.
Irradiation
Another method of preservation is irradiation, which reduces potential pathogens to enhance food safety. This process involves treating food with ionizing radiation, which kills the bacteria and parasites that cause toxicity and disease. Similar technology is used to sterilize surgical instruments to avoid infection.2 Foods currently approved for irradiation by the FDA include flour, fruits and vegetables, juices, herbs, spices, eggs, and meat and poultry.
Most forms of preservation can affect the quality of food. For example, freezing slightly affects the nutritional content, curing and smoking can introduce carcinogens, and salting greatly increases the sodium. There are also concerns about the effects of using irradiation to preserve food. Studies have shown that this process can change the flavor, texture, color, odor, and nutritional content of food. For example, the yolks of irradiated eggs have less color than non- irradiated eggs.
Food Processing
Food processing includes the methods and techniques used to transform raw ingredients into packaged food. Workers in this industry use harvested crops or slaughtered and butchered livestock to create products that are marketed to the public. There are different ways in which food can be processed, from a one-off product, such as a wedding cake, to a mass-produced product, such as a line of cupcakes packaged and sold in stores.
The Pros and Cons of Food Processing
Food processing has a number of important benefits, such as creating products that have a much longer shelf life than raw foods. Also, food processing protects the health of the consumer and allows for easier shipment and the marketing of foods by corporations. However, there are certain drawbacks. Food processing can reduce the nutritional content of raw ingredients. For example, canning involves the use of heat, which destroys the vitamin C in canned fruit. Also, certain food additives that are included during processing, such as high fructose corn syrup, can affect the health of a consumer. However, the level of added sugar can make a major difference. Small amounts of added sugar and other sweeteners, about 6 to 9 teaspoons a day or less, are not considered harmful.3
Pictured here are English muffins as they run along a conveyor belt at a bakery production plant. © Thinkstock
Food Regulation and Control
Food regulatory agencies work to protect the consumer and ensure the safety of our food. Food and drug regulation in the United States began in the late nineteenth century when state and local governments began to enact regulatory policies. In 1906, Congress passed the Pure Food and Drugs Act, which led to the creation of the US Food and Drug Administration (FDA). Today, a number of agencies are in charge of monitoring how food is produced, processed, and packaged.4
Regulatory Agencies
Food regulation is divided among different agencies, primarily the FDA and the US Department of Agriculture (USDA). Regulatory agencies in Canada include the Canadian Food Inspection
Agency and Health Canada. The North American public depends on these and other agencies to ensure that the food they purchase and consume from supermarkets, restaurants, and other sources is safe and healthy to eat. It can be confusing to know which agency monitors and manages which regulatory practice. For example, the FDA oversees the safety of eggs when
they’re in the shells, while the USDA is in charge of the eggs once they are out of their shells.
The Food and Drug Administration
The FDA enforces the safety of domestic and imported foods. It also monitors supplements, food labels, claims that corporations make about the benefits of products, and pharmaceutical drugs. Sometimes, the FDA must recall contaminated foods and remove them from the market to protect public health. For example, in 2011 contaminated peanut butter led to the recall of thousands of jars of a few popular brands.5 Recalls are almost always voluntary and often are requested by companies after a problem has been discovered. In rare cases, the FDA will request a recall. But no matter what triggers the removal of a product, the FDA’s role is to oversee the strategy and assess the adequacy and effectiveness of the recall.
Required Video 20.2
FDA 101: Product Recalls http://www.youtube.com/v/zaSGcXmPt3Q
The US Department of Agriculture
Headed by the Secretary of Agriculture, the USDA develops and executes federal policy on farming and food. This agency supports farmers and ranchers, protects natural resources, promotes trade, and seeks to end hunger in the United States and abroad. The USDA also assures food safety, and in particular oversees the regulation of meat, poultry, and processed egg products.
The Environmental Protection Agency
A third federal government agency, the Environmental Protection Agency (EPA), also plays a role in the regulation of food. The EPA works to protect human health and the environment. Founded in 1970, the agency conducts environmental assessment, education, research, and regulation. The EPA also works to prevent pollution and protect natural resources. Two of its many regulatory practices in the area of agriculture include overseeing water quality and the use of pesticides.
Food Safety and Hazard Analysis
Government regulatory agencies utilize HACCP programs to ensure food safety. HACCP, or hazard analysis and critical control points, is a system used to identify potential hazards and prevent foodborne illnesses. Some of the seven aspects of an HACCP program include identifying the points in a manufacturing process during which potential hazards could be introduced, establishing corrective actions, and maintaining record-keeping procedures. The USDA uses HACCP to regulate meat, while the FDA uses the seven-point system to monitor
seafood and juice. In these industries, HACCP systems are used in all stages of production, processing, packaging, and distribution.6 Currently, the use of HACCP is voluntary for all other food products.
Food Additives
If you examine the label for a processed food product, it is not unusual to see a long list of added materials. These natural or synthetic substances are food additives and there are more than three hundred used during food processing today. The most popular additives are benzoates, nitrites, sulfites, and sorbates, which prevent molds and yeast from growing on food.7
Food additives are introduced in the processing stage for a variety of reasons. Some control acidity and alkalinity, while others enhance the color or flavor of food. Some additives stabilize food and keep it from breaking down, while others add body or texture. Table 14.1 "Food Additives" lists some common food additives and their uses:
Table 14.1 "Food Additives
Additive | Reason for Adding |
Beta-carotene | Adds artificial coloring to food |
Caffeine | Acts as a stimulant |
Citric acid | Increases tartness to prevent food from becoming rancid |
Dextrin | Thickens gravies, sauces, and baking mixes |
Gelatin | Stabilizes, thickens, or texturizes food |
Modified food starch | Keeps ingredients from separating and prevents lumps |
MSG | Enhances flavor in a variety of foods |
Pectin | Gives candies and jams a gel-like texture |
Polysorbates | Blends oil and water and keep them from separating |
Soy lecithin | Emulsifies and stabilizes chocolate, margarine, and other items |
Sulfites | Prevent discoloration in dried fruits |
Xanthan gum | Thickens, emulsifies, and stabilizes dairy products and dressings |
Source: Center for Science in the Public Interest. “Chemical Cuisine: Learn about Food Additives.” ©2012. Center for Science in the Public Interest. http://www.cspinet.org/reports/chemcuisine.htm.
The Pros and Cons of Food Additives
The FDA works to protect the public from potentially dangerous additives. Passed in 1958, the Food Additives Amendment states that a manufacturer is responsible for demonstrating the safety of an additive before it can be approved. The Delaney Clause that was added to this legislation prohibits the approval of any additive found to cause cancer in animals or humans. However, most additives are considered to be “generally recognized as safe,” a status that is determined by the FDA and referred to as GRAS.
Food additives are typically included in the processing stage to improve the quality and consistency of a product. Many additives also make items more “shelf stable,” meaning they will last a lot longer on store shelves and can generate more profit for store owners. Additives
can also help to prevent spoilage that results from changes in temperature, damage during distribution, and other adverse conditions. In addition, food additives can protect consumers from exposure to rancid products and food-borne illnesses.
Food additives aren’t always beneficial, however. Some substances have been associated with certain diseases if consumed in large amounts. For example, the FDA estimates that sulfites can cause allergic reactions in 1 percent of the general population and in 5 percent of asthmatics.
Similarly, the additive monosodium glutamate, which is commonly known as MSG, may cause headaches, nausea, weakness, difficulty breathing, rapid heartbeat, and chest pain in some individuals.8
The Effect of New Technologies
As mentioned earlier, new technology has had a tremendous effect on the food we eat and the customs and culture related to food consumption. For example, microwaves are used to reduce cooking time or to heat up leftover food. Refrigerators and freezers allow produce to travel great distances and last longer. On the extreme end of making food last longer, there is special food for astronauts that is appropriate for consumption in space. It is safe to store, easy to prepare in the low-gravity environment of a spacecraft, and contains balanced nutrition to promote the health of people working in space. In the military, soldiers consume Meals Ready- to-Eat (MREs), which contain an entire meal in a single pouch.
Genetically Modified Foods
Genetically modified foods (also known as GM or GMO foods), are plants or animals that have undergone some form of genetic engineering. In the United States, much of the soybean, corn, and canola crop is genetically modified. The process involves the alteration of an organism’s DNA, which allows farmers to cultivate plants with desirable characteristics.9 For example, scientists could extract a gene that produces a chemical with antifreeze properties from a fish that lives in an arctic region (such as a flounder). They could then splice that gene into a completely different species, such as a tomato, to make it resistant to frost, which would enable farms to grow that crop year-round.10
Certain modifications can be beneficial in resisting pests or pesticides, improving the ripening process, increasing the nutritional content of food, or providing resistance to common viruses. Although genetic engineering has improved productivity for farmers, it has also stirred up debate about consumer safety and environmental protection. Possible side effects related to the consumption of GM foods include an increase in allergenicity, or tendencies to provoke allergic reactions. There is also some concern related to the possible transfer of the genes used to create genetically engineered foods from plants to people. This could influence human health if antibiotic-resistant genes are transferred to the consumer. Therefore, the World Health Organization (WHO) and other groups have encouraged the use of genetic engineering without antibiotic-resistance genes. Genetically modified plants may adversely affect the environment as well and could lead to the contamination of non-genetically engineered organisms.11
Genetically modified foods fall under the purview of the EPA, the USDA, and the FDA. Each agency has different responsibilities and concerns in the regulation of GM crops. The EPA ensures that pesticides used for GM plants are safe for the environment. The USDA makes sure genetically engineered seeds are safe for cultivation prior to planting. The FDA determines if foods made from GM plants are safe to eat. Although these agencies act independently, they work closely together and many products are reviewed by all three.10
Required Video 20.3
Too Much Controversy over Genetically Modified Foods? http://www.youtube.com/v/v-vYXzXxN70
Food Enrichment and Fortification
Many foods are enriched or fortified to boost their nutritional value. Enrichment involves adding nutrients to restore those that were lost during processing. For example, iron and certain B vitamins are added to white flour to replace the nutrients that are removed in the process of milling wheat. Fortification is slightly different than enrichment and involves adding new nutrients to enhance a food’s nutritive value. For example, folic acid is typically added to cereals and grain products, while calcium is added to some orange juice.
The Health of the Population
Certain enrichment and fortification processes have been instrumental in protecting public health. For example, adding iodine to salt has virtually eliminated iodine deficiencies, which protects against thyroid problems. Adding folic acid to wheat helps increase intake for pregnant women, which decreases the risk of neural tube defects in their children. Also, vegans or other people who do not consume many dairy products are able to drink orange juice or soy milk that has been fortified with calcium to meet the daily recommendations. However, there is some concern that foods of little nutritive value will be fortified in an effort to improve their allure, such as soft drinks with added vitamins.
References and Links
1Plunkett Research, Ltd. “US Food Industry Overview.” Accessed December 5, 2011, http://www.plunkettresearch.com/food%20beverage%20grocery%20market %20research/industry%20statistics. 2Centers for Disease Control and Prevention. “Food Irradiation.” Accessed October 11, 2005. http://www.cdc.gov/ncidod/dbmd/diseaseinfo/foodirradiation.htm.
3American Heart Association. “Sugar and Carbohydrates.” Last updated October 12, 2010. http://www.heart.org/HEARTORG/GettingHealthy/NutritionCenter/HealthyDietGoals/Sugars-and- Carbohydrates_UCM_303296_Article.jsp#.
4EH.Net Encyclopedia. “History of Food and Drug Regulation in the United States.” February 4, 2010. http://eh.net/encyclopedia/article/Law.Food.and.Drug.Regulation.
5US Food and Drug Administration. “FDA 101: Product Recalls—From First Alert to Effectiveness Checks.” Last updated September 9, 2011. http://www.fda.gov/ForConsumers/ConsumerUpdates/ucm049070.htm.
6US Food and Drug Administration. “Hazard Analysis & Critical Control Points (HACCP).” Last updated April 27, 2011. http://www.fda.gov/food/foodsafety/hazardanalysiscriticalcontrolpointshaccp/default.htm.
7How Stuff Works. “The Dangers of Food Additives.” Accessed October 5, 2011. http://health.howstuffworks.com/wellness/food-nutrition/facts/dangers-of-food -additives.htm. 8Sustainable Table. “The Issues: Additives.” Accessed October 10, 2011. http://www.sustainabletable.org/issues/additives/#fn14.
9Genomics.Energy.gov. “What Are Genetically Modified Foods?” Last modified November 5, 2008. http://www.ornl.gov/sci/techresources/Human_Genome/elsi/gmfood.shtml.
10Whitman, D. B. “Genetically Modified Foods: Harmful or Helpful?” ProQuest Discovery Guides (April 2000). http://www.csa.com/discoveryguides/gmfood/overview.php
11World Health Organization. “Food Safety: 20 Questions on Genetically Modified Foods.” © 2011. http://www.who.int/foodsafety/publications/biotech/20questions/en/.
Video Links
FDA 101: Product Recalls - http://www.youtube.com/v/zaSGcXmPt3Q
Too Much Controversy over Genetically Modified Foods? - http://www.youtube.com/v/v-vYXzXxN70
The Politics of Food
Some people have begun to view their choices regarding diet and nutrition in light of their political views. More and more, consumers weigh their thoughts on the environment and the world, while making decisions about what to purchase in the grocery store. For example, many people choose to eat free-range chickens due to concerns about animal welfare. Others worry about the higher cost of organically produced food or find that those products are not available in their communities. As a result, feelings about food have become a political mine field.
Food Politics
The production and sale of food is an extremely big business and touches people in all industries and walks of life. Food is not only crucial for day-to-day survival, but also strongly affects overall health and well-being, as well as the economy and culture of a region or a country. So, it is no wonder that more and more producers and consumers alike are speaking out about food to ensure that their interests are protected. Food politics can influence many stakeholders and interests, but always involve the production, regulation, inspection, distribution, and/or retail of food.
Stakeholders
Stakeholders in food politics include large and small farmers, along with large and small food companies. Other important stakeholders include restaurants and other food-service providers, food distributors, grocery stores and other retail outlets, consumers, and trade associations.
Anti-hunger advocates, nutrition advocates, and food-industry lobbyists also have important roles to play. Nongovernmental organizations, such as the American Cancer Society and the WHO, also work to promote good health and nutrition. Each group has its own perspective and its own agenda in disputes related to food.
Disputes
Food politics can be influenced by ethical, cultural, medical, and environmental disputes over agricultural methods and regulatory policies. They are also greatly influenced by manufacturing processes, marketing practices, and the pursuit of the highest possible profit margin by food manufacturers and distributers. Common disputes and controversies include the genetic modification of plants, the potential dangers of food additives, chemical run-off from large- scale farms, and the reliance on factory-farming practices, such as the use of pesticides in crop cultivation and antibiotics in livestock feed. Additional issues and concerns include the use of sugar, salt, and other potentially unhealthy ingredients, the promotion of fast food and junk food to children, and sanitary standards related to livestock.
The Role of Government
Federal and state policy plays a major role in the politics of food production and distribution. As previously discussed, government agencies regulate the proper processing and preparation of foods, as well as overseeing shipping and storage. They pay particular attention to concerns related to public health. As a result, the enforcement of regulations has been strongly influenced by public concern over food-related events, such as outbreaks of foodborne illnesses.
Food Production, Distribution, and Safety
Many consumers have concerns about safety practices during the production and distribution of food. This is especially critical given recent outbreaks of food-borne illnesses. For example, during fall 2011 in the United States, there was an eruption of the bacteria Listeria monocytogenes in cantaloupe. It was one of the deadliest outbreaks in over a decade and resulted in a number of deaths and hospitalizations.1 In January 2011, the Food Safety Modernization Act was passed to grant more authority to the FDA to improve food safety. The FDA and other agencies also address consumer-related concerns about protecting the nation’s food supply in the event of a terrorist attack.
Whole chickens are suspended at a meat production plant and will soon be separated into parts. © Thinkstock
Addressing Hunger
Government agencies also play an important role in addressing hunger via federal food- assistance programs. The agencies provide debit cards (formerly distributed in the form of food vouchers or food stamps) to consumers to help them purchase food and they also provide other forms of aid to low-income adults and families who face hunger and nutritional deficits. This topic will be discussed in greater detail later in this chapter.
The Dual Role of the USDA
The USDA has a dual role in the advancement of American agribusiness and the promotion of health and nutrition among the public. This can create conflicts of interest, and some question whether the USDA values the interests of the agriculture and food industries over consumer health.
However, there is no question that the USDA makes a great deal of effort to educate the public about diet and nutrition. Working with the US Department of Health and Human Services, the agency codeveloped the Dietary Guidelines for Americans to inform consumers about the ways their dietary habits affect their health. The USDA also implements all federal nutrition programs.
The Farm Bill
The Farm Bill (introduced in 1990) is a massive piece of legislation that determines the farm and food policy of the federal government. It addresses policy related to federal food programs and other responsibilities of the USDA. The Farm Bill also covers a wide range of agricultural programs and provisions, including farm subsidies and rural development. And, it influences international trade, commodity prices, environmental preservation, and food safety.
The massive Farm Bill is updated and renewed every five years. Over the decades, it has expanded to incorporate new issues, such as conservation and bioenergy. The Farm Bill passed in 2008, known as the Food, Conservation, and Energy Act, included new policy on horticulture and livestock provisions. The 2008 bill also differed from previous legislation in terms of the large number and scope of proposals that were raised.2
Agricultural Subsidies
The Farm Bill can directly and indirectly have wide-ranging effects. For example, the bill dictates subsidies and other forms of agricultural funding or support. Farmers rely on this kind of support to offset varying crop yields and unfavorable weather conditions. The agricultural industry also depends on the federal government to provide some form of price control to guard against flooding the market and dragging down prices. As an example, major changes in the policy of agricultural subsidies were implemented in the 1970s to increase farm incomes and produce cheaper food. As a result of these policies and subsidies, much more corn was grown, giving rise to high fructose corn syrup as a primary sweetener in a number of products today, since corn syrup is cheaper to produce. It is also sweeter than cane sugar, which encouraged its widespread use.
Historically, Congress has pursued farm support programs to ensure that the US population has continued access to abundant and affordable food. However, some leaders worry about the effectiveness of government programs as well as the cost to taxpayers and consumers. Others question if continued farm support is even needed and wonder if it remains compatible with current economic objectives, domestic policy, trade policy, and regulatory restrictions.2 For example, federal dairy policies can raise the price of milk and other dairy products, which can detrimentally affect school lunch and food stamp programs. Regarding all of these issues, Congress must heed the demands of its constituents. In the end, it is inevitable that consumers’ growing interest in food issues will affect not only the choices they make in the grocery store, but also the decisions they make in the voting booth.
References and Links
1Centers for Disease Control and Prevention. “Multistate Outbreak of Listeriosis Associated with Jensen Farms Cantaloupe—United States.” August–September, 2011. http://www.cdc.gov/mmwr/preview/mmwrhtml/mm6039a5.htm?s_cid= mm6039a5_w.
2Johnson, R. and J. Monke, “What Is the ‘Farm Bill’?” Congressional Research Service. CRS Report for Congress, no. RS22131 (January 3, 2011). http://www.nationalaglawcenter.org/assets/crs/RS22131.pdf.
Food Costs and Inflation
Statistics show that Americans spend more than $1.5 trillion on food each year at supermarkets, in restaurants, and from other food providers.1 According to the USDA, a thrifty family of four spends about $540-$620 per month on groceries.2 A number of factors affect the rising cost of food. They include agricultural production, processing and manufacturing, wholesale distribution, retail distribution, and consumption.
Around the world, commodity prices rose sharply in 2010 as crop production shortfalls led to reduced supplies and a higher volatility in agricultural markets. Other factors that played a role in increasing food prices include a population boom that has drastically increased demand, droughts and other natural disasters that have crippled farmers, and trade policies and practices that are unfair to developing nations.
Rising agricultural commodity prices have led to concerns about food insecurity and hunger. In an agricultural outlook report for 2010–2020, the Secretary-General of the Organization for Economic Co-operation and Development states, “While higher prices are generally good news for farmers, the effect on the poor in developing countries who spend a high proportion of their income on food can be devastating. That is why we are calling on governments to improve information and transparency of both physical and financial markets, encourage investments that increase productivity in developing countries, remove production and trade distorting policies, and assist the vulnerable to better manage risk and uncertainty.”3
Who Bears the Cost?
The cost of our food is influenced by the policies and practices of farms, food and beverage companies, food wholesalers, food retailers, and food service companies. These costs include the energy required to produce and distribute food products from farm field to supermarket to table. Rising prices also reflect the marketing and advertising of food. All of these factors affect all participants in a food system, but some participants are more affected than others. A 2011 report by the Economic Research Service of the USDA shows the division of the consumer food dollar among various aspects of the American food system. A far greater amount of the money you spend to buy a product goes toward the marketing components than toward the actual farmer.4
The Consumer Price Index
The Consumer Price Index (CPI) measures changes in the price level paid for goods and services. This economic indicator is based on the expenditures of the residents of urban areas, including working professionals, the self-employed, the poor, the unemployed, and retired workers, as well as urban wage earners and clerical workers. The CPI has subsidies for many different types of products, including food and beverages. It is a closely-watched statistic that is used in a variety of ways, including measuring inflation and regulating prices.
Implications around the World
Food prices and inflation disproportionately affect people at lower income levels. For the poorest people of the world, increasing prices can raise levels of hunger and starvation. In many developing countries where the cost for staple crops steadily rises, consumers have faced shortages or even the fear of shortages, which can result in hoarding and rioting. This happened in 2007 and 2008 during rice shortages in India and other parts of Asia. Rioters burned hundreds of food ration stores in the Indian region West Bengal. In the West African nation Burkina Faso, food rioters looted stores and burned government buildings as a result of rising prices for food and other necessities.5 In some poor countries, protests also have been fueled by concerns over corruption, because officials earned fortunes from oil and minerals, while locals struggled to put food on their tables. Bringing down prices would quell protests, but could take a decade or more to accomplish.
The End of the Era of Cheap Food
Concerns about food shortages and rising prices reflect the end of the era of cheap food. Following World War II, grain prices fell steadily around the world for decades. As farms grew in scale, factory-farm practices, such as the use of synthetic and mined fertilizers and pesticides, increased. Agribusinesses also invested in massive planting and harvesting machines. These practices pushed crop yields up and crop prices down. Food became so inexpensive that we
entered what came to be called the “era of cheap food.”
However, by 2008, economic experts had declared that the era of cheap food was over. The rapid growth in farm output had slowed to the point that it failed to keep pace with population increases and rising affluence in once-developing nations. Consumption of four staples—wheat, rice, corn, and soybeans—outstripped production and resulted in dramatic stockpile decreases.
The consequence of this imbalance has been huge spikes felt moderately in the West and to a much greater degree in the developing world. As a result, hunger has worsened for tens of millions of poor people around the world.6
Two major trends played a part in this shift. First, prosperity in India and China led to increased food consumption in general, but more specifically to increased meat consumption. Increased meat consumption has led to an increased demand for livestock feed, which has contributed to an overall rise in prices. The second trend relates to biofuels, which are made from a wide variety of crops (such as corn and palm nuts), which increasingly are used to make fuel instead of to feed people.
The world population in 2010 was 6.9 billion.7 It is projected to grow to 9.4 billion by 2050.8 The rate of increase is particularly high in the developing world, and the increased population, along with poverty and political instability, are helping to foster long-term food insecurity. In the coming decades, farmers will need to greatly increase their output to meet the rising demand, while adapting to any future trends.9
References and Links
1Plunkett Research, Ltd. “US Food Industry Overview.” 2011. http://www.plunkettresearch.com/food%20beverage%20grocery%20market %20research/industry%20statistics. 2US Department of Agriculture. “Official USDA Food Plans: Cost of Food at Home at Four Levels, US Average,
August 2011.” Issued September 2011. http://www.cnpp.usda.gov/Publications/FoodPlans/2011/CostofFoodAug2011.pdf.
3Organization for Economic Co-operation and Development. “OECD-FAO Agricultural Outlook 2010–2020.” June 17, 2011. http://www.oecd.org/document/31/0,3746,en_21571361_44315115_48182047_1_1_1_1,00.html. 4US Department of Agriculture, Economic Research Service. “Overview.” Last updated November 19, 2012. http://www.ers.usda.gov/data-products/food-expenditures.aspx.
5Vivienne Walt, “The World’s Growing Food-Price Crisis,” Time Magazine, 27 February 2008. http://www.time.com/time/world/article/0,8599,1717572-1,00.html.
6Justin Gillis, “A Warming Planet Struggles to Feed Itself,” The New York Times, 4 June 2011. http://www.nytimes.com/2011/06/05/science/earth/05harvest.html?_r=2&hp.
7United Nations. “World Population Prospects, the 2010 Revision.” http://esa.un.org/wpp/Analytical- Figures/htm/fig_1.htm.
8Food and Agricultural Organization of the United Nations. “Executive Summary.” http://www.fao.org/docrep/004/y3557e/y3557e03.htm.
9Christian Science Monitor. “Why the Era of Cheap Food Is Over.” December 31, 2007. http://www.csmonitor.com/2007/1231/p13s01-wogi.html.
The Issues of Food Security
Physiologically, hunger relates to appetite and is the body’s response to a need for nourishment. Through stomach discomfort or intestinal rumbling, the body alerts the brain that it requires food. This uneasy sensation is easily addressed with a snack or a full meal. However, the term “hunger” also relates to a weakened condition that is a consequence of a prolonged
lack of food. People who suffer from this form of hunger typically experience malnourishment, along with poor growth and development.
Hunger
Adequate food intake that meets nutritional requirements is essential to achieve a healthy, productive lifestyle. However, millions of people in North America, not to mention globally, go hungry and are malnourished each year due to a recurring and involuntary lack of food. The economic crisis of 2008 caused a dramatic increase in hunger across the United States.1
Key Hunger Statistics
In 2010, 925 million people around the world were classified as hungry. Although this was a decrease from a historic high of more than one billion people from the previous year, it is still an unbearable number. Every night, millions and millions of people go to sleep hungry due to a lack of the money or resources needed to acquire an adequate amount of food. This graph shows the division of hungry people around the globe.
Key Hunger Terms
A number of terms are used to categorize and classify hunger. Two key terms, food security and food insecurity, focus on status and affect hunger statistics. Another term, malnutrition, refers to the deficiencies that a hungry person experiences.
Food Security
Most American households are considered to be food secure, which means they have adequate access to food and consume enough nutrients to achieve a healthy lifestyle. However, a minority of US households will experience food insecurity at certain points during the year, which means their access to food is limited due to a lack of money or other resources. This graphic shows the percentage of food-secure and food-insecure households in the United States during the year 2010.
Food Insecurity
Food insecurity is defined as not having adequate access to food that meets nutritional needs. According to the USDA, about 48.8 million people live in food-insecure households and have reported multiple indications of food access problems. About sixteen million of those have “very low food security,” which means one or more people in the household were hungry at some point over the course of a year due to the inability to afford enough food. The difference between low and very low food security is that members of low insecurity households have reported problems of food access, but have reported only a few instances of reduced food intake, if any.2 African American and Hispanic households experience food insecurity at much higher rates than the national average.2
Households with limited resources employ a variety of methods to increase their access to adequate food. Some families purchase junk food and fast food—cheaper options that are also very unhealthy. Other families who struggle with food security supplement the groceries they
purchase by participating in government assistance programs. They may also obtain food from emergency providers, such as food banks and soup kitchens in their communities.
Malnutrition
A person living in a food-insecure household may suffer from malnutrition, which results from a failure to meet nutrient requirements. This can occur as a result of consuming too little food or not enough key nutrients. There are two basic types of malnutrition. The first is macronutrient deficiency and relates to the lack of adequate protein, which is required for cell growth, maintenance, and repair. The second type of malnutrition is micronutrient deficiency and relates to inadequate vitamin and mineral intake.3 Even people who are overweight or obese can suffer from this kind of malnutrition if they eat foods that do not meet all of their nutritional needs.
At-Risk Groups
Worldwide, three main groups are most at risk of hunger: the rural poor in developing nations who also lack access to electricity and safe drinking water, the urban poor who live in expanding cities and lack the means to buy food, and victims of earthquakes, hurricanes, and other natural and man-made catastrophes.4 In the United States, there are additional subgroups that are at risk and are more likely than others to face hunger and malnutrition. They include low-income families and the working poor, who are employed but have incomes below the federal poverty level.
Senior citizens are also a major at-risk group. Many elderly people are frail and isolated, which affects their ability to meet their dietary requirements. In addition, many also have low incomes, limited resources, and difficulty purchasing or preparing food due to health issues or poor mobility. As a result, more than six million senior citizens in the United States face the threat of hunger.5
The Homeless
One of the groups that struggles with hunger are the millions of homeless people across North America. According to a recent study by the US Conference of Mayors, the majority of reporting cities saw an increase in the number of homeless families.6 Hunger and homelessness often go hand-in-hand as homeless families and adults turn to soup kitchens or food pantries or resort to begging for food.
Children
Rising hunger rates in the United States particularly affect children. Nearly one out of four children, or 21.6 percent of all American children, lives in a food-insecure household and spends at least part of the year hungry.4 Hunger delays their growth and development and affects their educational progress because it is more difficult for hungry or malnourished students to concentrate in school. In addition, children who are undernourished are more susceptible to contracting diseases, such as measles and pneumonia.3
Required Video 20.4
Going Hungry in America http://www.youtube.com/v/FBQSCQcfY18
Government Programs
The federal government has established a number of programs that work to alleviate hunger and ensure that many low-income families receive the nutrition they require to live a healthy life. A number of programs were strengthened by the passage of the Healthy, Hunger-Free Kids Act of 2010. This legislation authorized funding and set the policy for several key core programs that provide a safety net for food-insecure children across the United States.
The Federal Poverty Level
The federal poverty level (FPL) is used to determine eligibility for food-assistance programs. This monetary figure is the minimum amount that a family would need to acquire shelter, food, clothing, and other necessities. It is calculated based on family size and is adjusted for annual inflation. Although many people who fall below the FPL are unemployed, the working poor can qualify for food programs and other forms of public assistance if their income is less than a certain percentage of the federal poverty level, along with other qualifications.
USDA Food Assistance Programs
Government food and nutrition assistance programs that are organized and operated by the USDA work to increase food security. They provide low-income households with access to food, the tools for consuming a healthy diet, and education about nutrition. The USDA monitors the extent and severity of food insecurity via an annual survey. This contributes to the efficiency of food assistance programs as well as the effectiveness of private charities and other initiatives aimed at reducing food insecurity.2
The Supplemental Nutrition Assistance Program
Formerly known as the Food Stamp Program, the Supplemental Nutrition Assistance Program (SNAP) provides monthly benefits for low-income households to purchase approved food items at authorized stores. Clients qualify for the program based on available household income, assets, and certain basic expenses. In an average month, SNAP provides benefits to more than forty million people in the United States.2
The program provides Electronic Benefit Transfers (EBT) which work similarly to a debit card. Clients receive a card with a certain allocation of money for each month that can be used only for food. In 2010, the average benefit was about $134 per person, per month and total federal expenditures for the program were $68.2 billion.2
The Special, Supplemental Program for Women, Infants, and Children
The Special, Supplemental Program for Women, Infants and Children (WIC) provides food packages to pregnant and breastfeeding women, as well as to infants and children up to age
five, to promote adequate intake for healthy growth and development. Most state WIC programs provide vouchers that participants use to acquire supplemental packages at authorized stores. In 2010, WIC served approximately 9.2 million participants per month at an average monthly cost of about forty-two dollars per person. 2
The National School Lunch Program
The National School Lunch Program (NSLP) and School Breakfast Program (SBP) ensure that children in elementary and middle schools receive at least one healthy meal each school day, or two if both the NSLP and SBP are provided. According to the USDA, these programs operate in over 101,000 public and nonprofit private schools and residential child-care institutions.7
In 2010, the programs provided meals to an average of 31.6 million children each school day. Fifty-six percent of the lunches served were free, and an additional 10 percent were provided at reduced prices.
Other Food-Assistance Programs for Children
Other government programs provide meals for children after school hours and during summer breaks. The Child and Adult Care Food Program (CACFP) offers meals and snacks at child-care centers, daycare homes, and after-school programs. Through CACFP, more than 3.2 million children and 112,000 adults receive nutritious meals and snacks each day.8 The Summer Food Service Program provides meals to children during summer break. Sponsors include day camps and other recreation programs where at least half of the attendees live in households with incomes below the federal poverty level.9 These and other programs help to fill in the gaps during the typical day of a food-insecure child.
The Head Start Program
Head Start is a health and development program for children aged three to five, from low- income families. The philosophy behind the organization is that early intervention can help address the educational, social, and nutritional deficiencies that children from lower-income families often experience. Launched in 1965, it is one of the longest-running, poverty-related programs in the United States. Today, Head Start programs include education, meals, snacks, and access to other social services and health guidance.10
Other Forms of Assistance
Other forms of assistance include locally-operated charitable organizations, such as food banks and food pantries, which acquire food from local manufacturers, retailers, farmers, and community members to give to low-income families. Neighborhood soup kitchens provide meals to the homeless and other people in need. These and other organizations are run by nonprofit groups, as well as religious institutions, to provide an additional safety net for those in need of food.
References and Links
1World Hunger.org. “Hunger in America: 2011 United States Hunger and Poverty Facts.” Accessed October 10, 2011. http://www.worldhunger.org/articles/Learn/us_hunger_facts.htm.
2Coleman-Jensen, A. et al. “Household Food Security in the United States in 2010.” US Department of Agriculture,
Economic Research Report, no. ERR-125 (September 2011).
3World Hunger. “2011 World Hunger and Poverty Facts and Statistics.” Accessed October 10, 2011. http://www.worldhunger.org/articles/Learn/world%20hunger%20facts%202002.htm.
4Food and Agriculture Organization of the United Nations. “Hunger: Frequently Asked Questions.” Accessed October 10, 2011. http://www.fao.org/hunger/en/
5Meals on Wheels. “Our Vision and Mission.” Accessed October 10, 2011. http://www.mowaa.org/page.aspx?pid=299
6The United States Conference of Mayors. “Hunger and Homelessness Survey: A Status Report on Hunger and Homelessness in America’s Cities, a 27-City Survey.” December 2009. http://usmayors.org/pressreleases/uploads/USCMHungercompleteWEB2009.pdf.
7US Department of Agriculture. “National School Lunch Program.” October 2011. http://www.fns.usda.gov/cnd/Lunch/AboutLunch/NSLPFactSheet.pdf.
8US Department of Agriculture. “Child & Adult Care Food Program.” Last modified June 10, 2011. http://www.fns.usda.gov/cnd/care/.
9US Department of Agriculture. “Summer Food Service Program.” st.TER 14 2011r Congress library. Last modified July 20, 2011. http://www.summerfood.usda.gov/default.htm.
10US Department of Health and Human Services. “About the Office of Head Start.” Last reviewed February 23, 2011. http://www.acf.hhs.gov/programs/ohs/about/index.html.
Video Links
Going Hungry in America - http://www.youtube.com/v/FBQSCQcfY18
Nutrition and Your Health
The adage, “you are what you eat,” seems to be more true today than ever. In recent years, consumers have become more conscientious about the decisions they make in the supermarket. Organically grown food is the fastest growing segment of the food industry. Also, farmers’ markets and chains that are health-food-oriented are thriving in many parts of North America. Shoppers have begun to pay more attention to the effect of food on their health and well-being. That includes not only the kinds of foods that they purchase, but also the manner in which meals are cooked and consumed. The preparation of food can greatly affect its nutritional value. Also, studies have shown that eating at a table with family members or friends can promote both health and happiness.
Family Meals
In the past, families routinely sat down together to eat dinner. But in recent decades, that comfortable tradition has fallen by the wayside. In 1900, 2 percent of meals were eaten outside of the home. By 2010, that figure had risen to 50 percent.1 Today, family members often go their own way at mealtimes and when they do sit down together, about three times a week, the meal often lasts less than twenty minutes and is spent eating a microwaved meal in front of a television.
Home-cooked meals provide parents an opportunity to teach their children about nutrition. © Thinkstock
However, recent studies have shown that home-cooked, family meals really matter. Family meals usually lead to the consumption of healthy food packed with nutrition, rather than an intake of empty calories. Other benefits include strengthening familial bonds, improving family communication, and helping young children learn table manners. Increased frequency of family meals has also been associated with certain developmental assets, such as support, boundaries and expectations, commitment to learning, positive values, and social competency.2
Home-prepared meals provide an opportunity for more balanced and better-portioned meals with fewer calories, sodium, and less saturated fat. When families prepare food together, parents or caregivers can also use the time to teach children about the ways their dietary selections can affect their health.
The Adolescent Diet
Teenagers’ dietary choices are influenced by their family’s economic status, the availability of food inside and outside the home, and established traditions. Studies have found links between the prevalence of family meals during adolescence and the establishment of healthy dietary
behaviors by young adulthood. Yet, many of today’s teenagers make food selections on their own, which often means eating junk food or fast food on the go.
However, adolescents who regularly consume family meals or have done so in the past are more likely to eat breakfast and to eat more fruits and vegetables. Research has shown that adolescents who have regular meals with their parents are 42 percent less likely to drink alcohol, 50 percent less likely to smoke cigarettes, and 66 percent less likely to use marijuana. Regular family dinners also help protect teens from bulimia, anorexia, and diet pills. In addition, the frequency of family meals was inversely related to lower academic scores and incidents of depression or suicide.1
Sustainable Eating
As discussed at the beginning of this chapter, sustainable agricultural practices provide healthy, nutritious food for the consumers of today, while preserving natural resources for the
consumers of tomorrow. Sustainability not only has economic and environmental benefits, but also personal benefits, including reduced exposure to pesticides, antibiotics, and growth hormones. Sustainable eaters do all of the following:
Disease Prevention and Management
Eating fresh, healthy foods not only stimulates your taste buds, but also can improve your quality of life and help you to live longer. As discussed, food fuels your body and helps you to maintain a healthy weight. Nutrition also contributes to longevity and plays an important role in preventing a number of diseases and disorders, from obesity to cardiovascular disease. Some dietary changes can also help to manage certain chronic conditions, including high blood pressure and diabetes. A doctor or a nutritionist can provide guidance to determine the dietary changes needed to ensure and maintain your health.
Heart Health
According to the WHO, cardiovascular disease is the leading cause of death on the planet.3 However, a healthy diet can go a long way toward preventing a number of conditions that contribute to cardiovascular malfunction, including high levels of blood cholesterol and narrowed arteries. As discussed in this text, it is extremely helpful to reduce the intake of trans- fat, saturated fat, and sodium. This can considerably lower the risk of cardiovascular disease, or manage further incidents and artery blockages in current heart patients. It is also beneficial to eat a diet high in fiber and to include more omega-3 fatty acids, such as the kind found in mackerel, salmon, and other oily fish.
High Blood Pressure
Blood pressure is the force of blood pumping through the arteries. When pressure levels become too high, it results in a condition known as hypertension, which is asymptomatic but can lead to a number of other problems, including heart attacks, heart failure, kidney failure, and strokes. For people with high blood pressure, it can be beneficial to follow the same recommendations as those for heart patients. First of all, it is crucial to reduce the intake of sodium to prevent pressure levels from continuing to rise. It can also be helpful to increase
potassium intake. However, patients should check with a doctor or dietitian first, especially if there are kidney disease concerns.
Diabetes
The rising rates of diabetes have triggered a health crisis in the United States and around the world. In diabetics, the levels of blood glucose, or blood sugar, are too high because of the body’s inability to produce insulin or to use it effectively. There are two types of this disease. Although the causes of Type 1 diabetes are not completely understood, it is known that obesity and genetics are major factors for Type 2.
Nutrition plays a role in lowering the risk of Type 2 diabetes or managing either form of the disease. However, it is a myth that there is one diabetes diet that every patient should follow. Instead, diabetics should keep track of the foods they consume that contain carbohydrates to manage and control blood-glucose levels. Also, a dietitian can help patients create a specific meal plan that fits their preferences, lifestyle, and health goals.
Kidney Disease
Chronic kidney failure is the gradual loss of kidney function and can cause dangerous levels of fluid and waste to build up in the body. Nutrition is very important in managing end-stage renal disease, and a patient with this condition should discuss a meal plan with a dietitian and physician. Certain macro- and micronutrients will need to be monitored closely, including protein, potassium, sodium, and phosphorus. Kidney patients must also keep track of their caloric intake and dietitians may recommend consuming more fast-releasing carbohydrates and low-saturated fats to boost the number of calories consumed each day.
Cancer
Certain cancers are linked to being overweight or obese. Additionally, some foods are related to either an increased or decreased risk for certain cancers. Foods linked to decreased cancer risk include whole grains, high-fiber foods, fruits, and vegetables. Foods linked to increased cancer risk include processed meats and excess alcohol.
Digestive Disorders
Digestive disorders can include constipation, heartburn or gastroesophageal reflux disease, inflammatory bowel disease, including Crohn’s and ulcerative colitis, and irritable bowel
syndrome. These disorders should be addressed with a physician. However, for many of them, diet can play an important role in prevention and management. For example, getting enough fiber and fluids in your diet and being active can help to alleviate constipation.
References and Links
1Mark Hyman, MD, “How Eating at Home Can Save Your Life,” Huffington Post.com, 9 January 2011. http://www.huffingtonpost.com/dr-mark-hyman/family-dinner-how _b_806114.html?
2Rochford, M. “Do Family Meals Still Matter?” Visions: Family and Community Health Sciences (Rutgers University) 21, no. 3 (2009).
3World Health Organization. “The Top 10 Causes of Death.” Accessed http://www.who.int/mediacentre/factsheets/fs310/en/.
Diets around the World
In the past, people’s culture and location determined the foods they ate and the manner in which they prepared their meals. For example, in the Middle East, wheat was a staple grain and was used to make flatbread and porridge, while halfway around the world in Mesoamerica, maize was the staple crop and was used to make tortillas and tamales. Today, most people have access to a wide variety of food and can prepare them any way they choose. However, customs and traditions still strongly influence diet and cuisine in most areas of the world.
Comparing Diets
There are a multitude of diets across the globe, in all regions and cultures. Each is influenced by the traditions of the past, along with the produce and livestock available. Local tastes, agricultural economics, and incomes still have a profound effect on what many people eat around the world. In this section, you will read a few examples of cuisines in different countries and regions, demonstrating differences in preferences. We will also compare common dietary choices in each region for a key meal—breakfast.
North America
The people of the United States and Canada consume a wide variety of food. Throughout both countries, people enjoy eating all kinds of cuisine from barbecue, pizza, peanut butter sandwiches, and pie to sushi, tacos, chow Mein, and roti (an Indian flatbread). This is partly due to the influence of immigration. As people immigrated to North America, they brought their dietary differences with them. In the 1800s, for example, Italian immigrants continued to cook spaghetti, pesto, and other cultural dishes after arriving in the United States. Today, Italian cuisine is enjoyed by many Americans from all backgrounds.
The variety of North American cuisine has also been impacted by regional variations. For example, fried chicken, cornbread, and sweet tea are popular in the southern states, while clam chowder, lobster rolls, and apple cider are enjoyed in New England. Also, as more people seek to support sustainable agriculture, locally grown crops and whole-food cooking practices often factor into what Americans eat and how they eat it.
Breakfast in North America
Meals can vary widely from one region of the world to another. Therefore, it can be interesting and informative to compare the choices made for a particular meal around the globe.
Throughout this section, we will explore the kinds of foods that people consume as they begin their day. Breakfast is a vital meal in any part of the world because it breaks the long overnight fast. An adequate breakfast also provides fuel for the first part of the day and helps improve concentration and energy levels.
Let’s begin with breakfast in North America. On weekdays, North Americans often eat breakfast in a hurry or on the go. Therefore, many people choose breakfast foods that are quick and easy to prepare or can be eaten during the trip to school or the office. As a result, breakfast cereals
with milk are extremely popular, and also oatmeal, toast, or bagels. However, on the weekends, some people spend a longer time enjoying a hearty breakfast or going out for brunch. Typical choices emphasize hot foods and include egg dishes, such as omelets and scrambled or fried eggs, along with pancakes, waffles, french toast, bacon or sausage, and orange juice, coffee, or tea to drink.
Central and South America
Both Central America and South America feature cuisines with rich Latin flavors. In addition, rice and corn are staples in both and form the basis for many dishes. Both regions are also affected by the mixture of influences from the native populations and the cultural traditions brought by Spanish and Portuguese immigrants during the 1600s and beyond.
South America has a diverse population, which is reflected in dietary choices across the continent. The northwestern region boasts some of the most exotic food in Latin America. In northeastern South America, many dishes feature a contrast of sweet and salty tastes, including raisins, prunes, capers, and olives. Also, rice grown in the area and seafood off the coast are key ingredients in South American-style paella. The north central part of the continent reflects a Spanish influence. Many of the dominant spices—cumin, oregano, cinnamon, and anise—came from Spain, along with orange and lime juices, wine, and olive oil. The south is cattle country and the locals enjoy grass-fed beef cooked in the form of asados, which are large cuts roasted in a campfire. Another popular meat dish is parrilladas, which are thick steaks grilled over oak.1
From Mexico in the North to Panama in the South, Central American cuisine features some of the world’s favorite foods, including rice, beans, corn, peppers, and tropical fruits. This area combines a variety of culinary traditions derived from the native Maya and Aztec populations, arrivals from Spain, and African and Latin-influenced neighbors along the Caribbean. In this region of the world, tamales are common. Spicy seasonings, including hot chili peppers, are also very popular.
Typical Southern and Central American Foods
Typical foods in South and Central America include quinoa, which is a grain-like crop that is cultivated for its edible seeds. Quinoa has a high protein and fiber content, is gluten-free, and is particularly tasty cooked in pilafs. Another popular grain product is the tortilla, which is a flatbread made from wheat or corn. Tortillas are used to make a number of dishes, including burritos, enchiladas, and tacos. Fruits and vegetables that are common in Mexico, Central America, and South America include corn, avocados, yucca, peppers, potatoes, mangoes, and papayas. Rice, beans, and a soft cheese known as queso fresco are common to the cuisine in this area of the world as well.
Tamales, which are popular in Mexico and parts of Central and South America, are made from a shell called a masa that is stuffed with meat or vegetables and steamed or boiled in a wrapper of dried corn leaves. The wrapping is discarded prior to eating. © Thinkstock
Breakfast in Central America
In this region, the first meal of the day commonly includes huevos rancheros (fried eggs served over a tortilla and topped with tomato sauce). Other popular breakfast dishes include pan dulce (a sweetened bread), along with fried plantains, and a spicy sausage called chorizo. The typical beverage is coffee, which is available in many forms, including café con leche (which is sweetened with lots of milk) and café de olla (with cinnamon and brown sugar). Hot chocolate is also popular and tends to be thick, rich, and flavored with spices such as cinnamon or achiote. In the Yucatan region, huevos motulenos are prepared by spreading refried beans onto fresh tortillas with fried eggs, peas, chopped ham, and cheese.
Europe
European cuisine is extremely diverse. The diet in Great Britain is different from what people typically consume in Germany, for example. However, across the continent, meat dishes are prominent, along with an emphasis on sauces. Potatoes, wheat, and dairy products are also staples of the European diet.
The nations along the Mediterranean Sea are particularly renowned for their flavorful food. This part of the world boasts a number of famous dishes associated with their countries of origin. They include Italy’s pasta, France’s coq au vin, and Spain’s paella.
Italy
Although Italy is a relatively small nation, the difference in cuisine from one region to another can be great. For example, the people of northern Italy tend to rely on dairy products such as butter, cream, and cheeses made from cow’s milk, because the land is flatter and better suited to raising cattle. In southern Italy, there is greater reliance on olive oil than butter, and cheeses are more likely to be made from sheep’s milk.2
However, there are a number of common ingredients and dishes across the country. Italian cuisine includes a variety of pasta, such as spaghetti, linguine, penne, and ravioli. Other well- known dishes are pizza, risotto, and polenta. Italians are also known for cooking with certain spices, including garlic, oregano, and basil.
France
For centuries, the French have been famous for their rich, extravagant cuisine. Butter, olive oil, pork fat, goose fat, and duck fat are all key ingredients. Common French dishes include quiche, fondue, baguettes, and also creams and tarts. Frites, or French fries, are cut in different shapes and fried in different fats, depending on the region. Fresh-baked bread is also found across the nation from the skinny baguettes of Paris to the sourdough breads in other parts of the country.
Every region of France seems to have its version of coq au vin (braised chicken most often cooked with garlic, mushrooms, and pork fat in wine). For instance, in the northeast, the dish is prepared a la biere (in beer). In Normandy in the northwest, coq au vin is cooked au cidre (in apple cider).3
Spain
One of the most popular Spanish dishes is paella, a gumbo of rice, seafood, green vegetables, beans, and various meats. The ingredients can vary wildly from one region to another, but rice is always the staple of the dish. Spain is also renowned for its tapas, which are appetizers or snacks. In restaurants that specialize in preparing and serving tapas, diners often order a number of different dishes from a lengthy menu and combine them to make a full meal.
Cooks in Spain rely on a variety of olive oils known for their flavors, ranging from smooth and subtle to fruity and robust. Spanish cuisine combines Roman, Moorish, and New World flavors. Key ingredients include rice, paprika, saffron, chorizo, and citrus fruits.4
Required Video 20.5
The Mediterranean Diet http://www.youtube.com/v/-gQ-zHsBt2k
Breakfast in Europe
In some countries, such as France, Italy, and Belgium, coffee and bread are common breakfast foods. However, the people of Great Britain and Ireland tend to enjoy a bigger breakfast with oatmeal or cold cereal, along with meats like bacon and sausage, plus eggs and toast. Tea is also popular in this area, not only for breakfast, but throughout the day. The continental-style breakfast is most commonly associated with France and includes fresh-baked croissants, toast, or a rich French pastry called brioche, along with a hot cup of tea, coffee, or café au lait.
Africa
The continent of Africa is home to many different countries and cultural groups. This diversity is reflected in the cuisine and dietary choices of the African people. Traditionally, various African cuisines combine locally grown cereals and grains, with fruits and vegetables. In some regions, dairy products dominate, while in others meat and poultry form the basis of many dishes.
Ethiopia
Ethiopia, located along the Horn of Africa, is one of the few African countries never colonized by a foreign nation prior to the modern era. So, outside influences on the culture were limited. Religious influences from Jewish, Islamic, and Catholic traditions played a larger role on the shaping of Ethiopian cuisine, because of the need to adhere to different dietary restrictions. For example, approximately half of Ethiopians are Muslim and must abstain from eating pork or using spices and nuts to flavor dishes. Ethiopia is also known for dishes that use local herbs and spices, including fenugreek, cumin, cardamom, coriander, saffron, and mustard. Many dishes also reflect a history of vegetarian cooking since meat was not always readily available.5
In addition, Ethiopians use their hands to eat. First, diners tear off pieces of injera, a spongy, tangy flatbread made from teff flour. Then, they use the pieces as utensils to scoop up vegetables, legumes, and meats from a communal plate.6 Teff is a grass that grows in the highlands of Ethiopia and is a staple of the diet.
Central and West Africa
Stretching from mountains in the north to the Congo River, Central Africa primarily features traditional cuisine. Meals are focused on certain staples, including cassava, which is a mashed root vegetable, and also plantains, peanuts, and chili peppers. In West Africa, which includes the Sahara Desert and Atlantic coast, the cuisine features dishes made from tomatoes, onions, chili peppers, and palm nut oil. Popular dishes in both regions include stews and porridges, such as ground nut stew made from peanuts, and also fufu, a paste made from cassava or maize.
Breakfast in Africa
African breakfast choices are strongly influenced by the colonial heritage of a region. The people of West Africa typically enjoy the French continental-style breakfast. However, in the eastern and southern parts of the continent, the traditional English breakfast is more common. In North Africa, breakfast is likely to include tea or coffee, with breads made from sorghum or millet. In East and West Africa, a common breakfast dish is uji, a thick porridge made from cassava, millet, rice, or corn. Kitoza is a delicacy made from dried strips of beef that are eaten with porridge in Madagascar. In Algeria, French bread, jam, and coffee is a typical breakfast.
The people of Cameroon eat beignets, which is a doughnut eaten with beans or dipped in a sticky, sugary liquid called bouilli.
Asia
Asia is a massive continent that encompasses the countries of the Middle East, parts of Russia, and the island nations of the southeast. Due to this diversity, Asian cuisine can be broken down into several regional styles, including South Asia, which is represented for our purposes here by
India, and East Asia which is represented for our purposes by China, Korea, and Japan. Even with this variety, the Asian nations have some dietary choices in common. For example, rice is a staple used in many dishes across the continent.
India
In India, there is much variety between the different provinces. The nation’s many kinds of regional cuisines can date back thousands of years and are influenced by geography, food availability, economics, and local customs. However, vegetarian diets are common across the nation for religious reasons, among others. As a result, Indian dishes are often based on rice, lentils, and vegetables, rather than meat or poultry. Indian cooking also features spicy seasonings, including curries, mustard oil, cumin, chili pepper, garlic, ginger, and garam masala, which is a blend of several spices.7 India is also known for its breads, including the flatbreads roti and chapati. Dishes that are popular not only in India but around the world include samosa, a potato-stuffed pastry; shahi paneer, a creamy curry dish made out of soft cheese and tomato sauce; and chana masala, chickpeas in curry sauce.8
China
China has the world’s most sizable population. As a result, there are many different culinary traditions across this vast country, which is usually divided into eight distinct cuisine regions. For example, Cantonese cuisine, which is also known as Guangdong, features light, mellow dishes that are often made with sauces, including sweet-and-sour sauce and oyster sauce.
Cantonese-style cuisine has been popularized in Chinese restaurants around the world. Another cuisine is known as Zhejiang, which is often shortened to Zhe, and originates from a province in southern China. It features dishes made from seafood, freshwater fish, and bamboo shoots.9
Key ingredients that are used in several, but not all, of the different regions include rice, tofu, ginger, and garlic. Tea is also a popular choice in most parts of the country.
Chinese use chopsticks as utensils. These small tapered sticks can be made from a variety of materials, including wood, plastic, bamboo, metal, bone, and ivory. Both chopsticks are held in one hand, between the thumb and fingers, and are used to pick up food.
Korea
Korean cuisine is primarily centered on rice, vegetables, and meat. Commonly-used ingredients include sesame oil, soy sauce, bean paste, garlic, ginger, and red pepper. Most meals feature a number of side dishes, along with a bowl of steam-cooked, short grain rice. Kimchi, a fermented cabbage dish, is the most common side dish served in Korea and is consumed at almost every meal. Another signature dish, bibimbap, is a bowl of white rice topped with sautéed vegetables and chili pepper paste and can include egg or sliced meat. Bulgogi consists of marinated, barbecued beef.10
Japan
As in other parts of Asia, rice is a staple in Japan, along with seafood, which is plentiful on this island nation. Other commonly-used ingredients include noodles, teriyaki sauce, dried seaweed, mushrooms and other vegetables, meat, and miso, which is soybean paste. Some favorite foods
include the raw fish dishes sashimi and sushi, which are not only popular in Japan, but are also around the world. Typical beverages include green tea and also sake, which is a wine made of fermented rice.11
The traditional table setting in Japan includes placing a bowl of rice on the left and a bowl of miso soup on the right side. Behind the rice and the soup are three flat plates which hold the accompanying side dishes. Similar to China, chopsticks are used in Japan and are generally placed at the front of the table setting. At school or work, many Japanese people eat out of a bento lunch box, which is a single-portion takeout or home-cooked meal. Bento boxes typically include rice, fish or meat, and cooked or pickled vegetables.
The Middle East
Middle Eastern cuisine encompasses a number of different cooking styles from Asian countries along the Mediterranean, as well as from North African nations, such as Egypt and Libya. In this part of the world, lamb is the most commonly consumed meat and is prepared in a number of ways, including as a shish kebab, in a stew, or spit-roasted. However, kosher beef, kosher poultry, and fish are eaten as well. Other staples include the fruits and vegetables that grow in the hills of many Middle Eastern countries, such as dates, olives, figs, apricots, cucumber, cabbage, potatoes, and eggplant. Common grains include couscous, millet, rice, and bulghur.
Popular dishes include Syrian baba ganoush, which is pureed eggplant, and kibbeh, or lamb with bulghur wheat, from Lebanon.12 A flatbread called pita served with hummus, or pureed chickpeas, is another popular dish in this region of the world.
Most people who reside in the Arab countries of the Middle East are Muslim, which can affect their diet. Many Muslims do not consume alcohol or pork. They also observe certain diet- related religious traditions, such as a daytime fast during the month of Ramadan. Other residents of the Middle East include Jews and Christians, and their traditions also affect what foods they eat and how they prepare it. For example, many Jews in Israel keep kosher and follow a set of dietary laws that impact food choices, storage, and preparation.
Breakfast in Asia
To continue the comparison of breakfast around the world, let’s examine the first meal of the day in many parts of Asia. In India, the first meal of the day commonly includes eggs scrambled with spices, potatoes, and onions, as well as fresh fruit and yogurt. Breakfast in China often consists of rice complemented by vegetables, meat, or fish. In Korea, a traditional breakfast would include soup made of either beef ribs or pork intestines, a selection of bread and pastries, rice, and kimchi, which is believed to promote intestinal health. Breakfast in Japan does not greatly differ from any other meal. It typically consists of a bowl of steamed white rice, a small piece of fish, a bowl of miso soup with tofu, vegetables, green tea, and occasionally pickled plums called umeboshi. Hot bowls of noodles in broth topped with pork slices, scallions, and bamboo shoots are also common.
Congee is a common breakfast food across Asia. This dish is a porridge made of rice that is consumed in a number of Asian countries, including Vietnam, Thailand, Burma, and Bangladesh.
Congee can be prepared both savory and sweet and contain a variety of ingredients, usually meats, vegetables, and herbs. It can be eaten alone or served as a side dish.
The Diversity of Palates and Habits
Around the globe, people enjoy different foods and different flavors. In some cultures, the main dishes are meat-based, while others focus on plant-based meals. You can also find different staples in different regions of the world, including rice, potatoes, pasta, corn, beans, root vegetables, and many kinds of grains. Different flavors are also popular on different parts of the planet, from sweet to salty to sour to spicy.
In the different regions of China, congee is prepared with various types of rice, which results in different consistencies. © Thinkstock
Food Availability
People tend to eat what grows or lives nearby. For example, people in coastal areas tend to consume more seafood, while those in inland areas tend to structure their diet around locally- grown crops, such as potatoes or wheat. In many developing countries, a large part of the diet is composed of cereal grains, starchy roots, and legumes. However, a number of common staples are consumed worldwide, including rice, corn, wheat, potatoes, cassava, and beans.
Income and Consumption
In addition to regional dissimilarities in diets, income also plays a major role in what foods people eat and how they prepare them. The average global calorie consumption has increased to record levels in recent years. This is a consequence of rising incomes, which have allowed consumers in many regions to expand both the variety and the quantity of food they eat.
Among developing countries, the daily intake of calories per person rose by nearly 25 percent from the early 1970s to the mid-1990s.13 People in the western world were able to increase their consumption of meat and poultry, fruits and vegetables, and fats and oils. However, those gains were minimal in the poorest countries, where many continue to struggle with hunger and a limited diet.14
Different Ways of Eating
People from different parts of the world consume their food in different ways and what is common in one country may be considered impolite in another. For example, in some areas people eat with their fingers, while in others using a fork is much more acceptable. In some regions of the world, people slurp their soup, while in others they quietly sip it. In some places,
diners eat off of individual plates, while in others people sit at a table with a large communal plate from which everyone eats.
No matter where you travel, you will find that food production, purchase, and preparation affect all facets of life, from health and economics to religion and culture. Therefore, it is vital for people from all walks of life to consider the choices they make regarding food, and how those decisions affect not only their bodies, but also their world. Alice Waters, an influential chef and founder of the nonprofit program Edible Schoolyard, as well as an advocate for sustainable production and consumption, has said, “Remember food is precious. Good food can only come from good ingredients. Its proper price includes the cost of preserving the environment and paying fairly for the labor of the people who produce it. Food should never be taken for granted.15
Required Video 20.6
Alice Waters: Edible Education
http://www.youtube.com/v/MTadAxKxq3M
References and Links
1Cooking Light. “South American Cuisine.” © 2012 Time Inc. Lifestyle Group. http://www.cookinglight.com/food/world-cuisine/south-american-cuisine -00400000001391/. 2Cooking Light. “Regional Italian Cuisine.” © 2012 Time Inc. Lifestyle Group. http://www.cookinglight.com/food/world-cuisine/regional-italian-cuisine -00400000001340/. 3Cooking Light. “France’s Regional Cuisine.” © 2012 Time Inc. Lifestyle Group. http://www.cookinglight.com/food/world-cuisine/frances-regional-cuisine -00400000001365/.
4Cooking Light. “Spanish Flavor.” © 2012 Time Inc. Lifestyle Group. http://www.cookinglight.com/food/world- cuisine/specialties-spanish -00400000001203/.
5Cooking Light. “Ethiopian Tastes.” © 2012 Time Inc. Lifestyle Group. http://www.cookinglight.com/food/vegetarian/ethiopian-tastes-00400000037116/.
6Ethiopian Restaurant.com. “Injera.” © 2004–2012. http://www.ethiopianrestaurant.com/injera.html 7Curry Dishes.com. “Guide to Easy Indian Recipes, Curry Recipes and Curry Spices.” © 2009. http://www.currydishes.com/.
8Food-India.com. “Your Guide to Indian Food.” © 2003–2011. http://www.food-india.com/. 9eChinacities.com. “China’s Eight Cuisines Revealed and How to Identify Them.” ©2008–2011 http://www.echinacities.com/expat-corner/china-s-8-cuisines-revealed -and-how-to-indentify-them.html. 10Korea Tourism Organization. “Food in Korea.” Accessed October 10, 2011. http://visitkorea.or.kr/enu/1051_Food.jsp.
11Web MD. “Diets of the World: The Japanese Diet.” © 2005–2011. http://www.webmd.com/diet/features/diets- of-world-japanese-diet.
12Saveur. “Middle Eastern Recipes.” Accessed December 5, 2011. http://www.saveur.com/solrSearchResults.jsp?fq=Cuisine:Middle\%20Eastern& sitesection=recipes.
13US Department of Agriculture, Foreign Agricultural Service. “Diets Around the World: How the Menu Varies.” Last modified October 14, 2004. http://www.fas.usda.gov/info/agexporter/2000/Apr/diets.htm.
14Centers for Disease Control and Prevention. “Caloric Consumption on the Rise in the United States, Particularly Among Women.” NCHS Press Room, February 5, 2004. http://www.cdc.gov/nchs/pressroom/04news/calorie.htm. 15Waters, A. “The Art of Eating.” PlanetGreen.com. March 31, 2009. http://planetgreen.discovery.com/feature/earth-day/alice-waters-eat-green.html.
Video Links
The Mediterranean Diet - http://www.youtube.com/v/-gQ-zHsBt2k
Alice Waters: Edible Education - http://www.youtube.com/v/MTadAxKxq3M
Start Your Sustainable Future Today
As we near the end of our journey in the world of health and nutrition, let’s address how to adjust your lifestyle today to ensure better health and wellness tomorrow. Adopting sustainable practices can go a long way toward helping you achieve optimal health, while also helping to protect the health of our planet. Remember, that sustainability involves meeting present nutritional needs while preserving resources for the future. It includes agricultural practices and processes, along with the choices that consumers make when they shop for their food. Ideally, sustainable practices include methods that are healthy, conserve the environment, protect livestock, respect food industry workers, provide fair wages to farmers, and support farming communities. When a practice or a process is sustainable, it can be maintained for decades, or even centuries, to come.
Living a Sustainable Lifestyle
There are a number of steps you can take to live a more sustainable lifestyle. Utilizing an environmentally-friendly approach to good nutrition is a great way to remain and stay healthy. As an initial step, you might try to buy more whole foods rather than processed foods. You might also drink more water, rather than sodas and juices with added sugar. It is also a good idea to drink from a reusable water bottle to avoid adding more plastic to your local landfill, not to mention saving the fuel it takes to ship bottles of water. Here are some other suggestions to live a more sustainable lifestyle:
Learn more about food. Learn about your local food system, what is native to the area, what is imported or shipped in, how food moves from farms to processors to retail in your area, and what practices are used. Read labels to see where food comes from and what the growing and processing practices are. You might also try taking a cooking class to learn more about food in general.
Eat a plant-based diet. A plant-based diet is not necessarily vegetarian or vegan; it simply emphasizes whole grains, fruits, vegetables, and legumes over meat and poultry. Plant-based foods are good sources of carbohydrates, protein, fat, vitamins, and minerals. They also help to decrease your risk for cancer and other chronic conditions.
Support local farmers. Purchase more locally grown food to promote sustainability. This could involve going to a farmer’s market or a nearby farm. Locally grown food requires less fossil fuel because it does not have to travel great distances. Locally grown food also puts money back
into your community and helps farmers in your area. Shopping at a farmer’s market or a local farm may also provide an opportunity to talk to the farmer who grew the food to learn more about what you put on your plate.
Join a community garden. You can’t get more local than food that is grown in your own backyard. Consider growing your own food, or trying a community garden if you do not have the space at your home. Produce from a local garden will not only be fresher, it will often taste better. In addition, it will provide an opportunity to get to know like-minded individuals in your community.
Help spread the word. Talk to friends and family members about food, nutrition, and living a sustainable lifestyle. Also, pay attention to food and nutrition policy at the federal, state, and local levels. Take a look at what foods are available in your community. Are there supermarkets or corner stores? What is available in the university dining hall? If healthy options are lacking, can you talk to someone to bring about changes?
Changing Your Behavior
Living a sustainable lifestyle and achieving optimal health is not easy. Taking steps to exercise more, eat healthier foods, and work harder to avoid food contamination may involve making major changes in your life. However, change is a process, and researchers have long studied the various stages of that process, as well as what helps or hinders it. While creating and implementing change is not easy, the more conscious you are of the process, and the more you prepare, the greater the chances are for success. Learning about the different stages of behavioral change can help you take a proactive approach to living a sustainable lifestyle.