Notes
Introduction
Most chemistry textbooks introduce students to the mathematics of chemistry, such as scientific notation, significant digits, and unit conversions. However, many students need to review and practice other mathematical topics, such as powers of ten, metric prefixes and conversions, determining when conversions are exact or measured, solving equations for a variable, and canceling units. This book contains tutorials on these topics, as well as links to more practice problems. It is suitable for any beginning introductory or general chemistry student.
Powers of 10
Exponents
We use the base-10 numbering system, where each place represents a power of 10. Places to the right of the decimal are called decimal places.

Numbers that are very big or very small are easily represented in scientific notation, which multiplies a number between 1 and 9 by 10 with a power or exponent. In the number below, the exponent is 3. $$ 4.321 x 10³ $$ Positive exponents represent big numbers (numbers greater than 1) and tell how many times the 10 is multiplied by itself. $$ 10^0 = 1 $$ note: anything to the zero power is 1 $$ 10^1 = 10 $$ note: anything to the one power is itself $$ 10^2 = 10 x 10 = 100 $$
$$ 10^3 = 10 x 10 x 10 = 1000 $$
Notice that the number in the positive exponent is equal to the number of zeros in the number being represented.
A negative exponent means to take 1 over the number represented by the positive exponent. This is called the reciprocal.

Therefore, negative exponents represent small numbers (numbers less than 1). Notice that the number in the negative exponent is one more than the number of zeros between the decimal point and the 1 in the number being represented.
We can use this information to simplify complex fractions as shown in the following example.
Example 1.1

For more practice understanding and simplifying exponents, try these flashcards.
Scientific Notation and Your Calculator
Powers of 10 are used when numbers are expressed in scientific notation. For example: $$ 4.32 x 10^2 --> 432 $$
$$ 4.32 x 10^{-2} --> 0.0432 $$
Your textbook or this online text gives you more information and practice using scientific notation.
When doing calculations with numbers, it’s important to keep the power with the number. Using the EE or EXP key on your calculator will do this efficiently without the need to use parentheses. You can find the EE key above the comma on most Texas Instruments calculators (use the 2nd key to access).
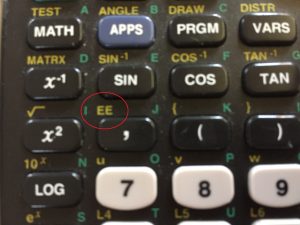
You will press the EE or EXP key in place of the “X,” “10,” and “^” keys. For example, to enter 4.32 x 10² in your calculator, you would press 4 . 3 2 EE 2. You do NOT punch the X, 10, or ^ keys. If you want to type in a negative exponent, use the “(-)” key on your calculator instead of the minus key.
Using the EE or EXP key will keep the whole number together, including the times-ten-to-the-power part, so no parentheses are need when using that number in a calculation. See the following example.
Example 2.1

For more practice using the EE or EXP on your calculator, try these flashcards.
Metric Prefixes
Powers of 10 are also used in the metric system, which is commonly used by scientists. Metric prefixes are used before the base metric unit. The units for some quantities commonly measured in chemistry are shown below:
| Quantity | Unit | Abbreviation |
|---|---|---|
| mass | gram | g |
| time | second | s |
| length | meter | m |
| volume | liter | L |
| energy | Joule | J |
Using Standard Definitions
Metric prefix definitions are often shown in texts in the following format.
| 106 | mega | M |
|---|---|---|
| 103 | kilo | k |
| 10-1 | deci | d |
| 10-2 | centi | c |
| 10-3 | milli | m |
| 10-6 | micro | µ |
Since the prefix kilo means 10^3, a kilometer means 10^3 meters or 1000 meters: $$ 1 km = 10^3 m - or - 1 km = 1000 m $$ Notice that the 103 or 1000 isn’t placed on the same side of the equals sign as the k, it’s on the opposite side of the equals sign. For example, 103 km = 1 m is wrong. You will need to know many metric prefixes and be able to correctly write the equality between the prefixed unit (km, in this case) and the no-prefix unit (m, in this case). Suppose you need the equality between Mg and g, so you need to put in the numbers in this equality:

Put a 1 in front of the prefixed unit (Mg, in this case), then the number the prefix means in front of the no-prefix unit (g, in this case). $$ 1 Mg = 10^6 g $$ One way to think about it is that when you remove the M prefix from the left side, you will have to replace it with the number that M means (106) on the right side. Again, don’t write the definition and the prefix on the same side. For example, 106 Mg = 1 g is wrong.
Example 3.1

Using Definitions with Positive Exponents Only
As we have seen, 1 cm = 10^-2 m. However, this isn’t the only way we can write the equality. If we multiply both sides by 10^2, we will have the following true equality $$ 10^2 cm = 1 m - or - 100 cm = 1 m $$ Centi means 10^-2. If we put that in front of the cm the equality is wrong. However, if we put 10^2 (note positive exponent) in front of the cm the equality is true.
So when you memorize the prefix definitions, you can either remember the table as given earlier, or you can put all powers as positive and remember if the prefix means bigger or smaller than the base unit. In the table below, X represents the base unit.

Using the prefixes defined in this way, when trying to determine which numbers go where, first decide which is the bigger unit and put a 1 in front of it. Then think, “lots of small things equals one big thing,” and place the big number in front of the small unit. For example, L is bigger than cL, so put a 1 in front of L. Lots of cL equals 1 L, where the “lots of” is 100 because centi means 100 times smaller .
$$
100 cL = 1 L
$$

For more practice writing metric equalities, try these flashcards.
Metric Conversions
Now that you’ve practiced writing metric equalities, it’s time to use them in conversions. Going from a prefixed unit to no-prefix unit (or vice-versa) is pretty straightforward.

When going from one prefixed unit to another prefixed unit, it is best to do the conversion in two steps. First, go from the prefixed unit of the given quantity to the no-prefix unit, using the prefix definition you have memorized. Then, go from the no-prefix unit to the prefixed unit you desire in the end, using the definition you have memorized. Two steps are necessary, because you have memorized each prefix relative to the no-prefix quantity, not relative to another prefix. See the following example for an illustration.

For more practice performing metric conversions, try these flashcards.
Uncertainty in Numbers: Exact vs. Measured Numbers
As we saw in the Metric Prefixes chapter, scientists use both numbers and units to record things they’ve measured or calculated. For example $$ 5.43 cm $$ The number or value is 5.43, and the unit is cm, short for centimeter.
When scientists record measurements or calculations, they are very careful to specify the amount of uncertainty in their measurement or calculation. This is done using significant figures (also called significant digits). Writing numbers with the proper number of significant figures means that you write all the digits known with certainty plus one (and only one) digit that you have guessed on. This means that when you record a measurement from a device such as a ruler or graduated cylinder, you record all the numbers you know for sure plus one last number that you guess between the tic marks on the measuring device. You record only one digit for this guess. Your text or this online text has examples.
Your text also explains how to round the answer from a mathematical calculation to the correct number of significant figures depending on if the math contains addition and subtraction or multiplication and division. When performing unit conversions, you most often use the multiplication/division rule, which counts the number of significant figures in each number and rounds the answer to match the fewest significant figures. Here, we want to practice determining the number of significant figures in equalities that will be used for unit conversions.
Exact Numbers
All quantities that have been measured will have a finite number of significant figures, since the last digit recorded will be a guess and will contain uncertainty. However, if a quantity is exact, it has an infinite number of significant figures. This is because there is no last digit that was guessed, all digits were known with certainty (and all places further to the right of the number are know with certainty to be zero). So how do you tell if a number is measured or exact?
One kind of exact number is when you count things that can’t come in parts, such as 4 people in the room or 3 cans of diet coke in the refrigerator. Each of those has an infinite number of significant figures, not one. That is, we can keep writing zeros after the decimal place and can never get to a digit that was rounded or had uncertainty. Another example is when you use the number of things you counted to calculate the average of those things. For example, to calculate the average of three numbers – say 92, 85, and 89 – you would add the numbers up and divide by 3. The 3 is counted, so it has an infinite number of significant figures and won’t play a factor in determining the number of significant figures in the answer of the calculation.
Other exact numbers come from definitions of units, such as all the metric prefixes or definitions within the English system. Here are some examples of defined quantities that have an infinite number of significant figures (sf):
60 s = 1 min (infinite sf)
60 min = 1 hr (infinite sf)
4 qt = 1 gal (infinite sf)
2 c = 1 pt (infinite sf)
3 ft = 1 yd (infinite sf)
Measured Numbers
If an equality relates the measurement between the metric and English system, then the numbers are measured, not exact. The exception to this is the inch to centimeter conversion. The inch was originally defined as the length of three grains of barley. Since the length of three grains of barley isn’t constant, in the 1930’s it was redefined based on the metric system, thereby making it exact.
1 in = 2.54 cm (infinite sf)
Two measured English to metric conversions are shown below, rounded to three significant figures each. $$ 2.20 lb = 1 kg (3 sf) $$
$$ 1.06 qt = 1 L (3 sf) $$
Constants, such as $$ c = 3.00 x 10^8 m/s $$
$$ h = 6.63 x 10^{34} kg·m2/s $$
$$ R = 1.10 x 10^8 m^{-1} $$
are also measured quantities and have a finite number of significant digits.
If you look up the conversions or constants above on the internet, you would find them reported to more than the three significant figures shown here. That means the conversions and constants written above have been rounded. Whenever a conversion or constant has been rounded, the number has a finite number of significant figures. This means that when you use these numbers in calculations, they could limit the number of significant figures you would report for the answer of the calculation. That is, if you had a precise calculation with lots of significant figures and used it in a calculation with a conversion factor or constant rounded to just a few significant figures, the conversion factor or constant would reduce the precision of your calculation – it would cause more uncertainty because it was rounded. Therefore, it is a good rule of thumb to make sure that when conversion factors or constants are used in calculations with measured quantities, they have at least as many significant figures as the measured quantities so that they don’t introduce uncertainty.
For practice determining the number of significant digits in conversions, try these flashcards.
Using Mathematical Equations
Squared and Cubed Units
Some units are squared, such as an area of 150 m2, or cubed, such as a volume of 25 cm3. Remember that m2 means mm, and cm3 means cmcm*cm. When performing unit conversions on a unit raised to a power, you need to remember to raise the conversion factor to the power as well. That is, you need to convert both meters in m2, or all three centimeters in cm3. This is illustrated in the following examples.


In chemistry we will use cm3 for volume or the volume unit L (with or without metric prefixes). When converting between these units, you should know that 1 cm3 = 1 mL. Note that the centimeter is cubed but the milliliter is not. Therefore, in the following example going from m3 to cm3 requires a cubed conversion factor but going from mL to L does not.

Canceling Units
When using mathematical equations in chemistry, the numbers you plug into the equation will also have units. The units follow the same math as the numbers and cancel accordingly. It’s important to include the units with the numbers you put into an equation and follow through with canceling them, because that is how you know whether or not you need to the change units of the given quantities you are plugging into the equation. You won’t be told ahead of time if you need to change units, you will discover it during the unit cancellation process.

Following through with the cancellation of units will also help you catch any algebra errors that you have made, as shown in the following example.

For practice canceling units, try these flashcards.
Rearranging Equations
You will need to solve mathematical equations where all but one of the variables is given. The most common method for doing this is to rearrange the equation so that the unknown variable is alone as a numerator on one side of the equals sign, with all the other variables and constants on the other side. While solving, remembering the following will be useful.
- What you do to one side of the equation, you must do to the other side.
- Multiplication and division are inverse operations (that is, they undo each other). Therefore,
$$ \frac{ab}{a} = b $$
Addition and subtraction are inverse operations.
Dividing is the same thing as multiplying by the inverse.
ab is the same as ba.
a = b can be written at b = a.
Anything can be written as a fraction with a denominator of 1. Therefore, $$ a\frac{b}{c} = \frac{ab}{c} $$
Here are a couple of simple examples, where only multiplication and division is needed to solve for the specified variable.

When the variable you are solving for is in the denominator, be sure to first get it in the numerator, then get it by itself. See the following examples.


For practice rearranging equations, try using these flashcards.
Common Notation
Mathematical equations can have variables and constants in them, each represented by letters. A variable can change value, while a constant has a fixed value. There is a table of commonly used constants and their values in the text.
Equations may also contain a variety of mathematical symbols. Below is a table of mathematical symbols that you should know.
| Symbol | Definition |
|---|---|
| ° | degree Celsius or Fahrenheit; also used for standard state, which is the state (solid, liquid, or gas) of a substance at room conditions ( 1 atm, 25 °C) |
| ∑ | summation (add the things that follow) |
| ≈ or ≅ | almost or approximately equal to |
| ∝ | proportional to |
| ∞ | infinity |
When two variables are directly proportional to each other, it means when one variable increases the other increases, too. They each might increase by different amounts, so they aren’t equal to each other. While it’s incorrect to put an equals sign between them, we can put a proportionality sign between them, as shown here for the variables V and T. $$ V ∝ T $$ When two variables are inversely proportional, it means when one variable increases the other decreases. We can represent this mathematically by using the proportionality sign and taking the reciprocal of one of the variables, such as $$ V ∝ \frac{1}{P} $$ Note that in mathematical equations, the proportionality sign can be replaced by an equals sign and a constant. $$ V ∝ T $$ can be rewritten as $$ V = cT $$ where c is a constant (called the proportionality constant)
This is useful when turning relationships between quantities discovered in the laboratory into mathematical equations.
Subscripts are used when there exists more than one value of the same variable during a calculation. For example, a gas will have one volume at a specific pressure, but a different volume at a different pressure. The product of the volume and pressure of the gas under each conditions is equal, as shown by the equation $$ P1V1 = P2V2 $$ While it doesn’t matter which condition is associated with which subscript, both variables for a specific condition must have the same subscript. That is, V1 is the volume of the gas when it has pressure P1.
Equations in chemistry may also contain Greek letters. You should be familiar with the Greek letters in the table below.
| Greek letter | Name | Common Use in Chemistry |
|---|---|---|
| µ | mu (lower case) | metric prefix for micro (10^6) |
| π | pi (lower case) | 3.14 |
| Δ | delta (upper case) | change, specifically, final – initial |
| λ | lambda (lower case) | wavelength (see Electronic Structure chapter) |
| ν | nu (lower case) | frequency (see Electronic Structure chapter) |
| σ | sigma (lower case) | a type of bonding (see the chapter on Covalent Bonding) |
| π | pi (lower case) | a type of bonding (see the chapter on Covalent Bonding) |
| Ψ | psi (upper case) | wavefunction (see Electronic Structure chapter) |
Weighted Average
I’m sure you know that to calculate an average or mean, you add the numbers then divide by how many numbers you added. For example, the normal way to calculate the average of 45, 67, and 82 is $$ Average = \frac{45+67+72}{3}=61 $$ In this calculation, each of the numbers contributes the same amount to the average. An alternate way to calculate an average is the multiply each number by the fraction or percent it contributes to the whole. In the example above, each number contributes 1/3 or 0.3333 to the average, so the average could be calculated as $$ Average = (45)(0.3333) + (67)(0.3333) + (72)(0.3333) = 61 $$ While you will need to calculate the average often in chemistry, on occasion, you will need to calculate a weighted average, where each of the numbers contributes a different amount (or weight) to the average. When calculating a weighted average, you will use the alternate way of calculating the average shown above, except that each number will contribute a different percent. This might come up in calculating your grade in a course or in calculating the average atomic mass of an element, as the following two examples illustrate.


It may be that you will be given the average and need to calculate one of the component scores or masses, as the following examples illustrate.


Graphing: How to Make a Graph
How to Make a Graph
Dependent and Independent Varaible
A graph is a visual way to represent quantitative data that can quickly convey the relationship between two variables. One variable is controlled by the experimenter and is called the independent variable. The other variable changes based on change in the independent variable, it is called the dependent variable. The independent variable should be placed on the x-axis, while the dependent variable is on the y-axis. We refer to or title the graph with the y-axis variable vs the x-axis variable.
Example 11.1
Suppose you measured the solubility of a compound (how much dissolves per Liter of water) at different temperatures. Which variable is the independent variable and should be placed on the x-axis? Which is the proper way to refer to the graph, Solubility vs Temperature or Temperature vs Solubility
Answer: The independent variable it the one the experimenter controls, so it is the temperature in this example. Graphs should be referred to as y vx x, so this would be a graph of Solubility vs Temperature.
Best Practices for Creating Graphs
Now that you know which variable to put on which axis, you can create your graph. Using Excel or other computer program will make the process easier, as the axes will be automatically generated with constant intervals between gradations and your data will be placed on the graph for you. Here are some guidelines to follow when creating your graph:
- Use the “Scatter” plot so the data points are shown but there are no lines connecting the points.
- Adjust the x- and y-axis ranges so that the data points fill the entire graph region.
- Title the graph.
- Label each axis with the variable it represents and include units on the label.
- If you expect the graph to fit to a function add the appropriate trendline and display the equation and R-squared value in an open area on the graph.
- If you are displaying only one set of data, delete the Legend.
Linear Best Fit
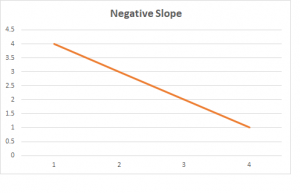
When adding a linear trendline in Excel or other computer program, the computer performs a least squares regression calculation on the data to create the best line that fits the data. The result is the equation of the line in the form $$ y = mx + b $$ where m is the slope and b is the y-intercept (the point where the line crosses the y-axis). The slope is defined as the change in the y-axis over the change in the x-axis $$ slope=\frac{Δy}{Δx} =\frac{y2−y1}{x2−x1} =\frac{rise}{run} $$ where the two x and y points are taken from the line, not the data. A positive slope is when the line angles upwards (from left to right) and occurs when the dependent variable increases as the independent variable is increased. A negative slope is when the line angles downwards (from left to right) and occurs when the dependent variable decreases as the independent variable increases.

Chemists often use the equation of a line generated from their data to calculate the y-value for a value of x they didn’t measure. Or, they can measure the y value for a sample with an unknown x to determine the value of x. Each of these methods is illustrated in the following examples.
Example 12.1
Suppose you measured the pressure of a sample of gas at various temperatures, graphed Pressure vs Temperature (where kPa and K are units) and obtained the following equation of a line: $$ y = 0.2078 kPa·K^{-1} x + 0.0171 kPa $$
What would be the pressure of this gas at 425 K?
Answer: Since you controlled temperature and measured pressured, temperature is on the x-axis and absorbance is on the y-axis. You want to know the y value that corresponds to an x value of 400 K, so plug that value of x into the equation. $$ y = (0.2078 kPa·K^{-1})(425 K) + 0.0171 kPa = 88.3 kPa $$ Example 12.2
Suppose you measured the absorbance of eight solutions as a function of concentration, graphed Absorbance vs Concentration (where M^-1 are the units on the slope), and obtained the following equation of a line: $$ y = 0.440 M^-1 x + 0.080 $$ If you had a sample with unknown concentration that had an absorbance of 0.232, what is the concentration of the sample?
Answer: Since you controlled concentration and measured absorbance, concentration is on the x-axis and absorbance is on the y-axis. You measured a y value and want to calculate an x value. Therefore, rearrange the equation of the line to solve for x $$ x = (y – 0.080)/0.440 M^-1 $$ Now plug in the measured value of y for your unknown and solve $$ x = (0.232 – 0.080)/0.440 M^-1 = 0.345 M $$ Excel and other programs also calculate R-squared, which is a statistical measure of how close the data are to the fitted regression line. The value of the R-squared ranges from 0 to 1, with 1 being a perfect fit. Most data collected in chemistry labs should have an R-squared greater than 0.9.